Copyright
©The Author(s) 2021.
World J Clin Cases. Feb 26, 2021; 9(6): 1304-1317
Published online Feb 26, 2021. doi: 10.12998/wjcc.v9.i6.1304
Published online Feb 26, 2021. doi: 10.12998/wjcc.v9.i6.1304
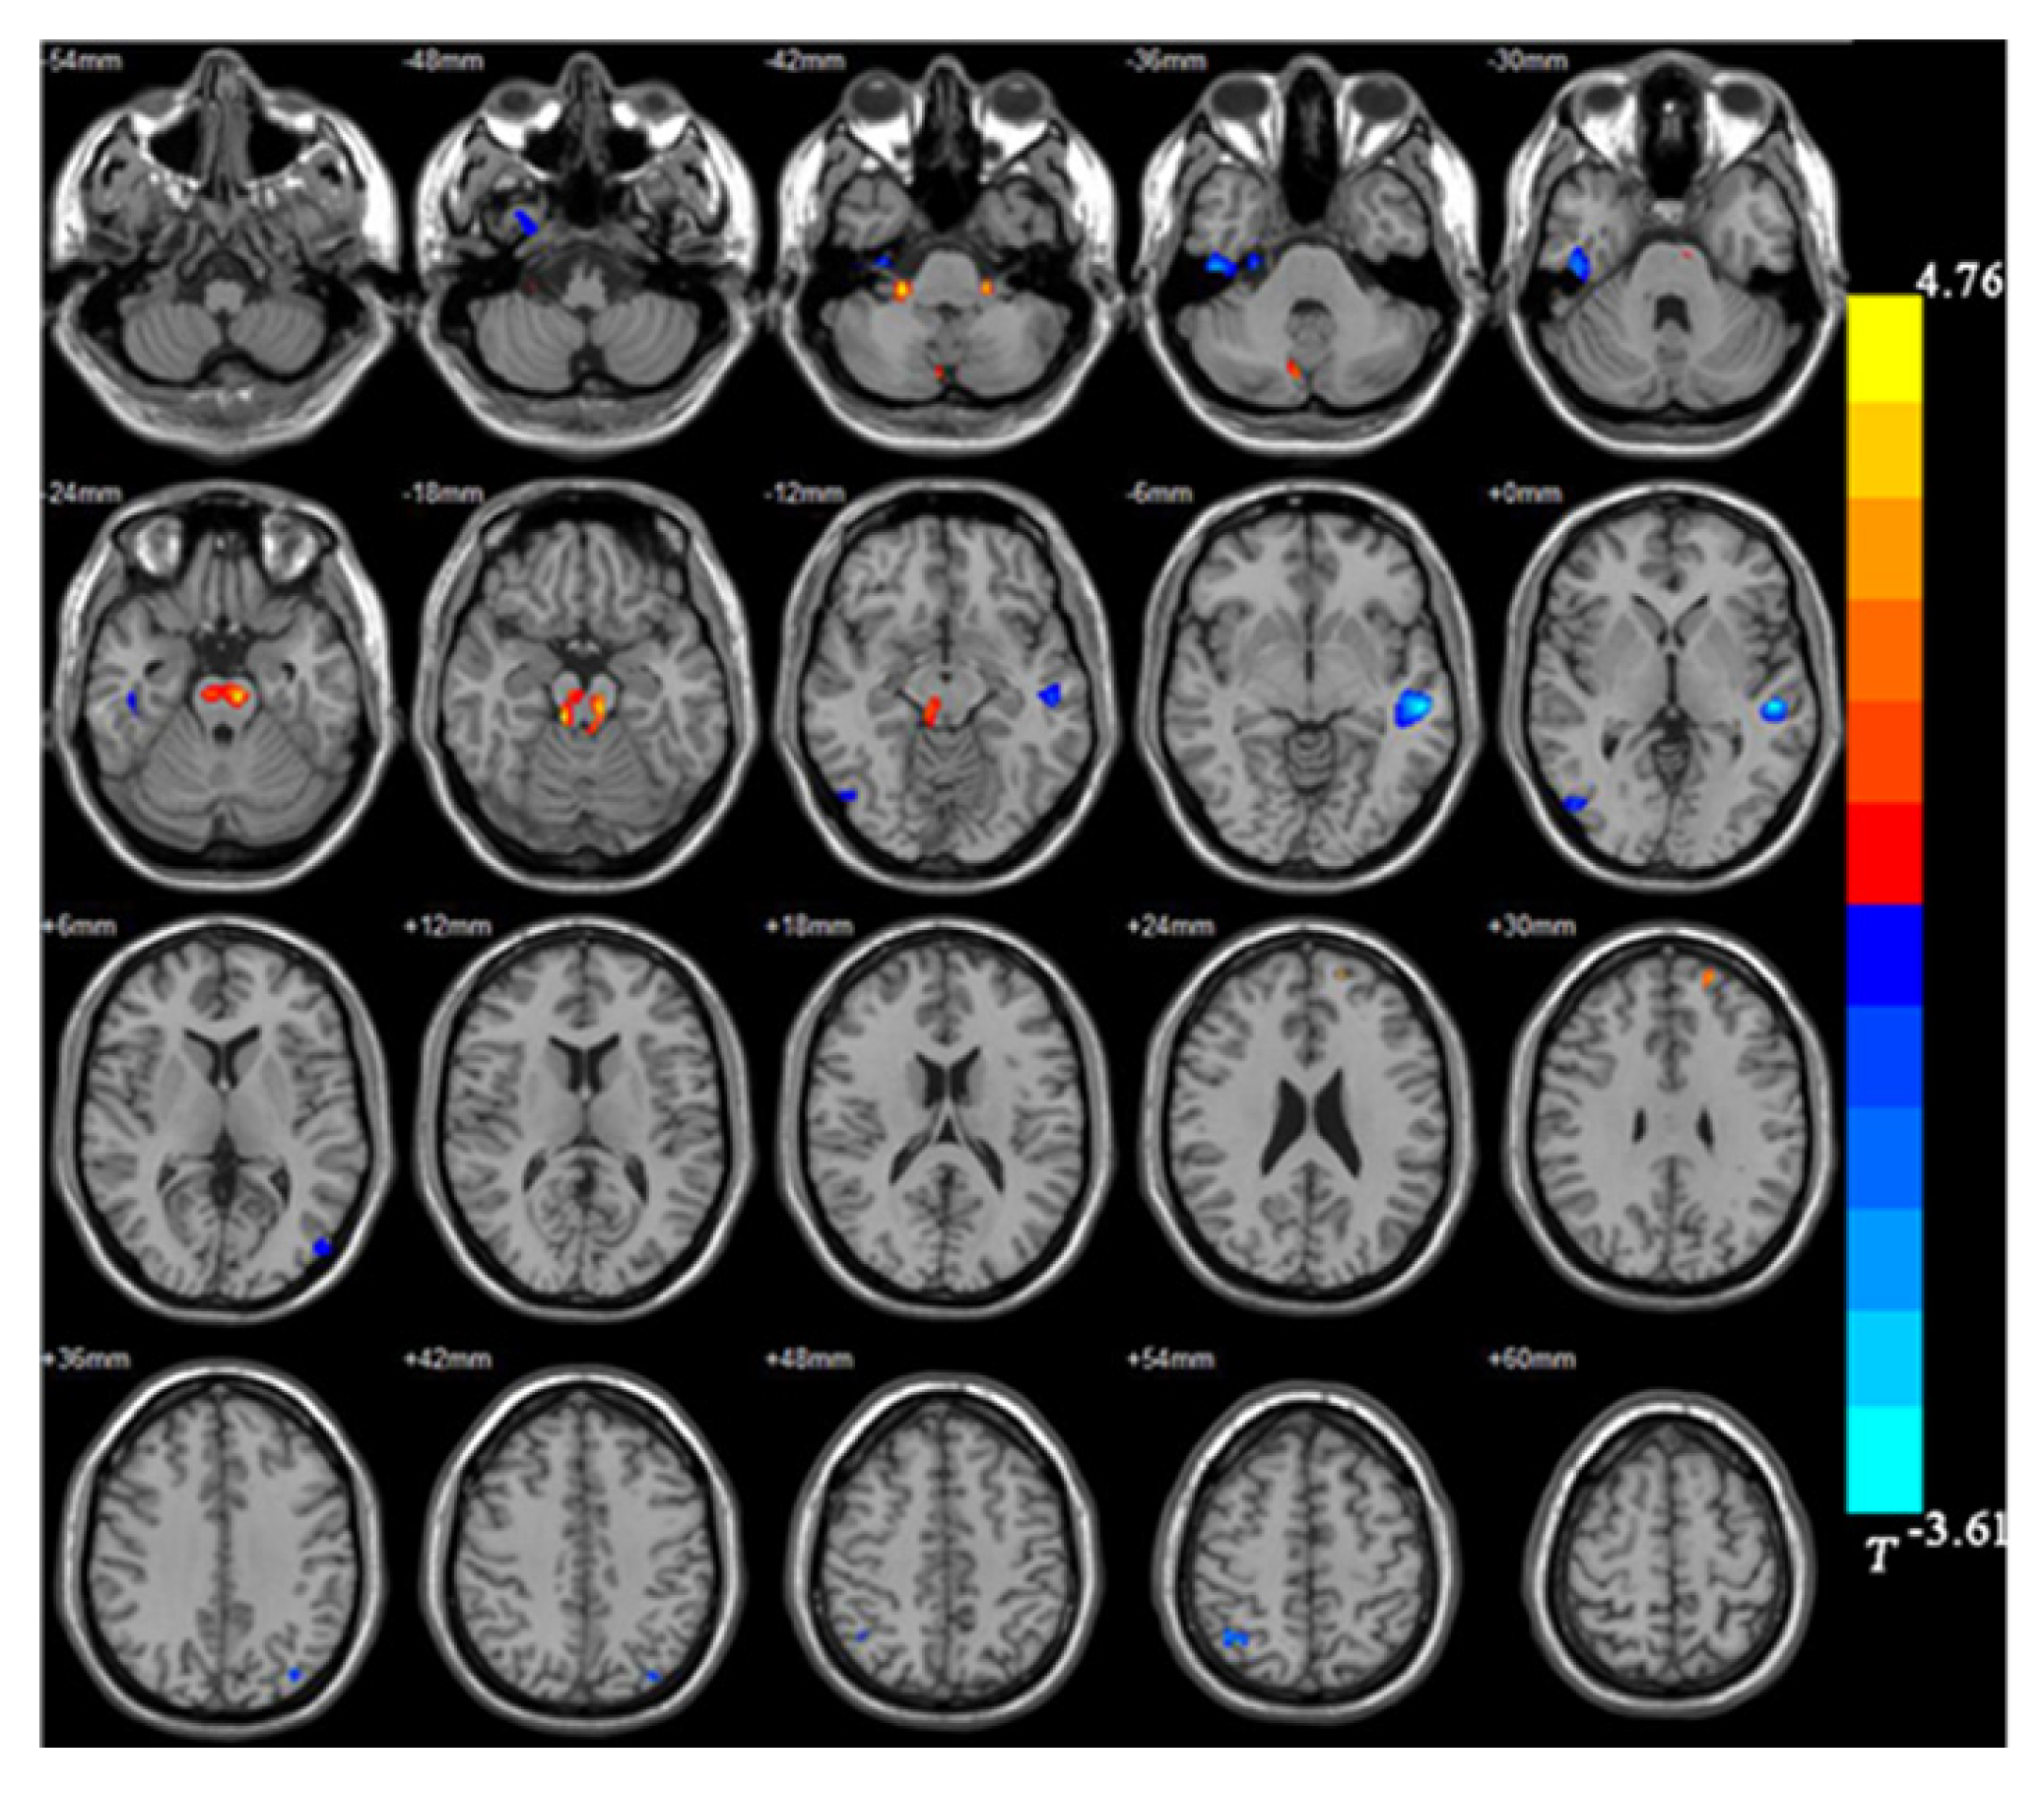
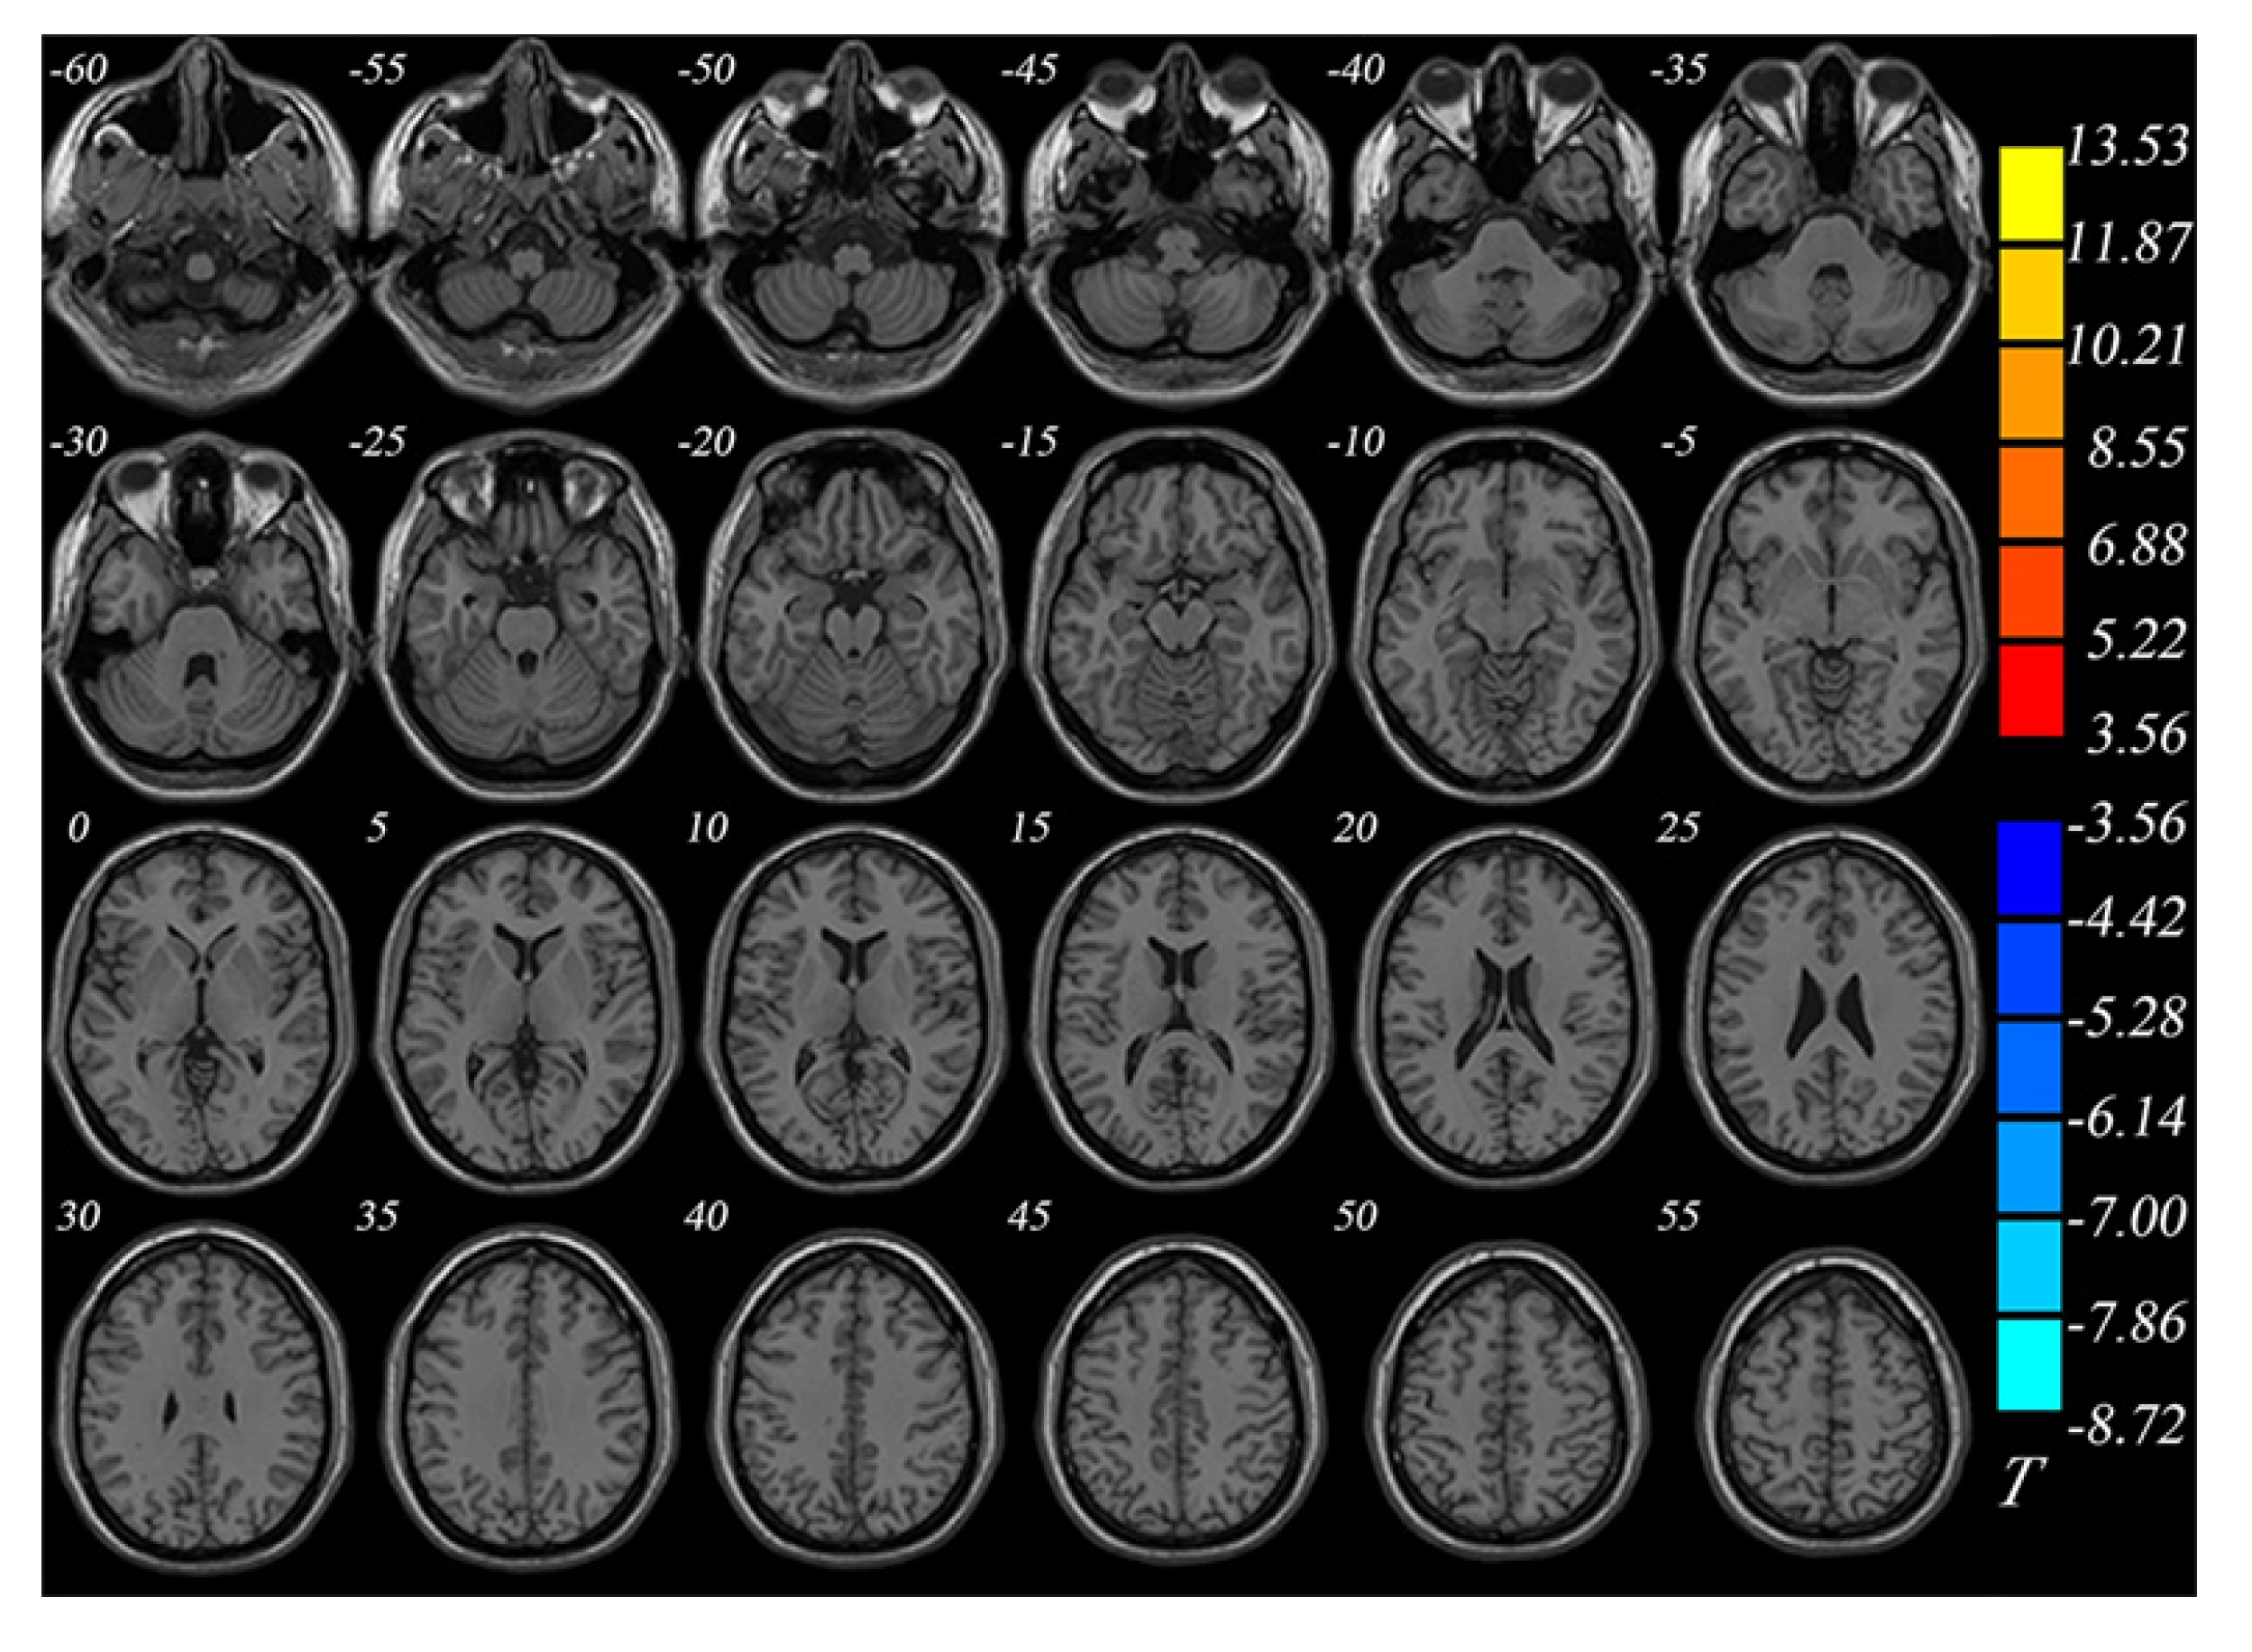
Figure 1 Distribution of brain regions with larger/smaller gray matter volume in the bipolar depression group compared with the control group.
Red: Larger gray matter volume (GMV); Blue: Smaller GMV.
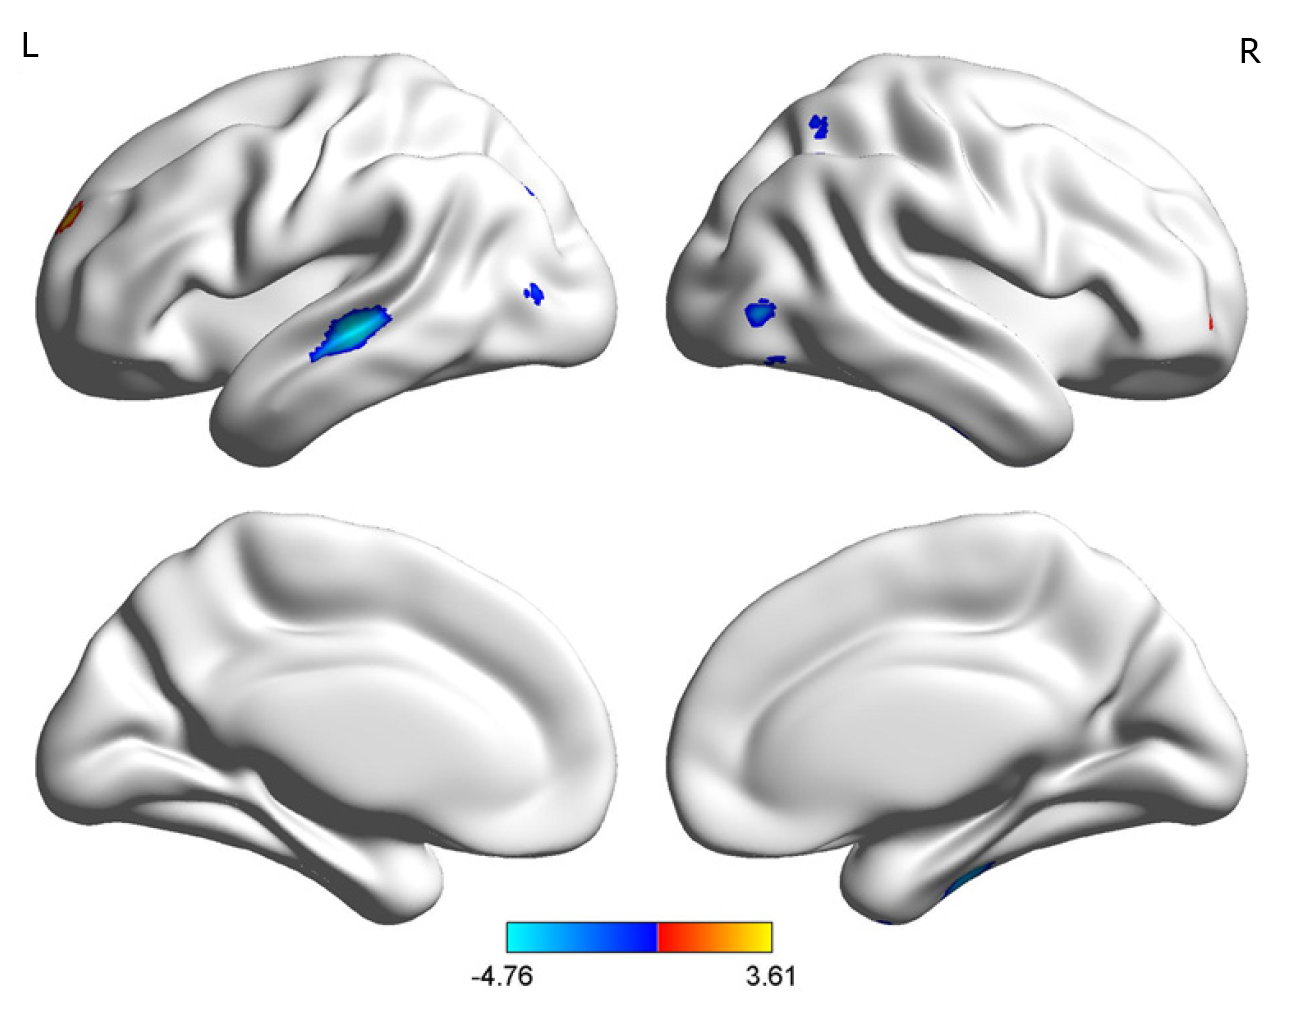
Figure 2 Comparison of voxel-based morphometry results between the bipolar depression group and the normal control group (Brainnet viewer).
Red: Larger gray matter volume; Blue: Smaller gray matter volume.
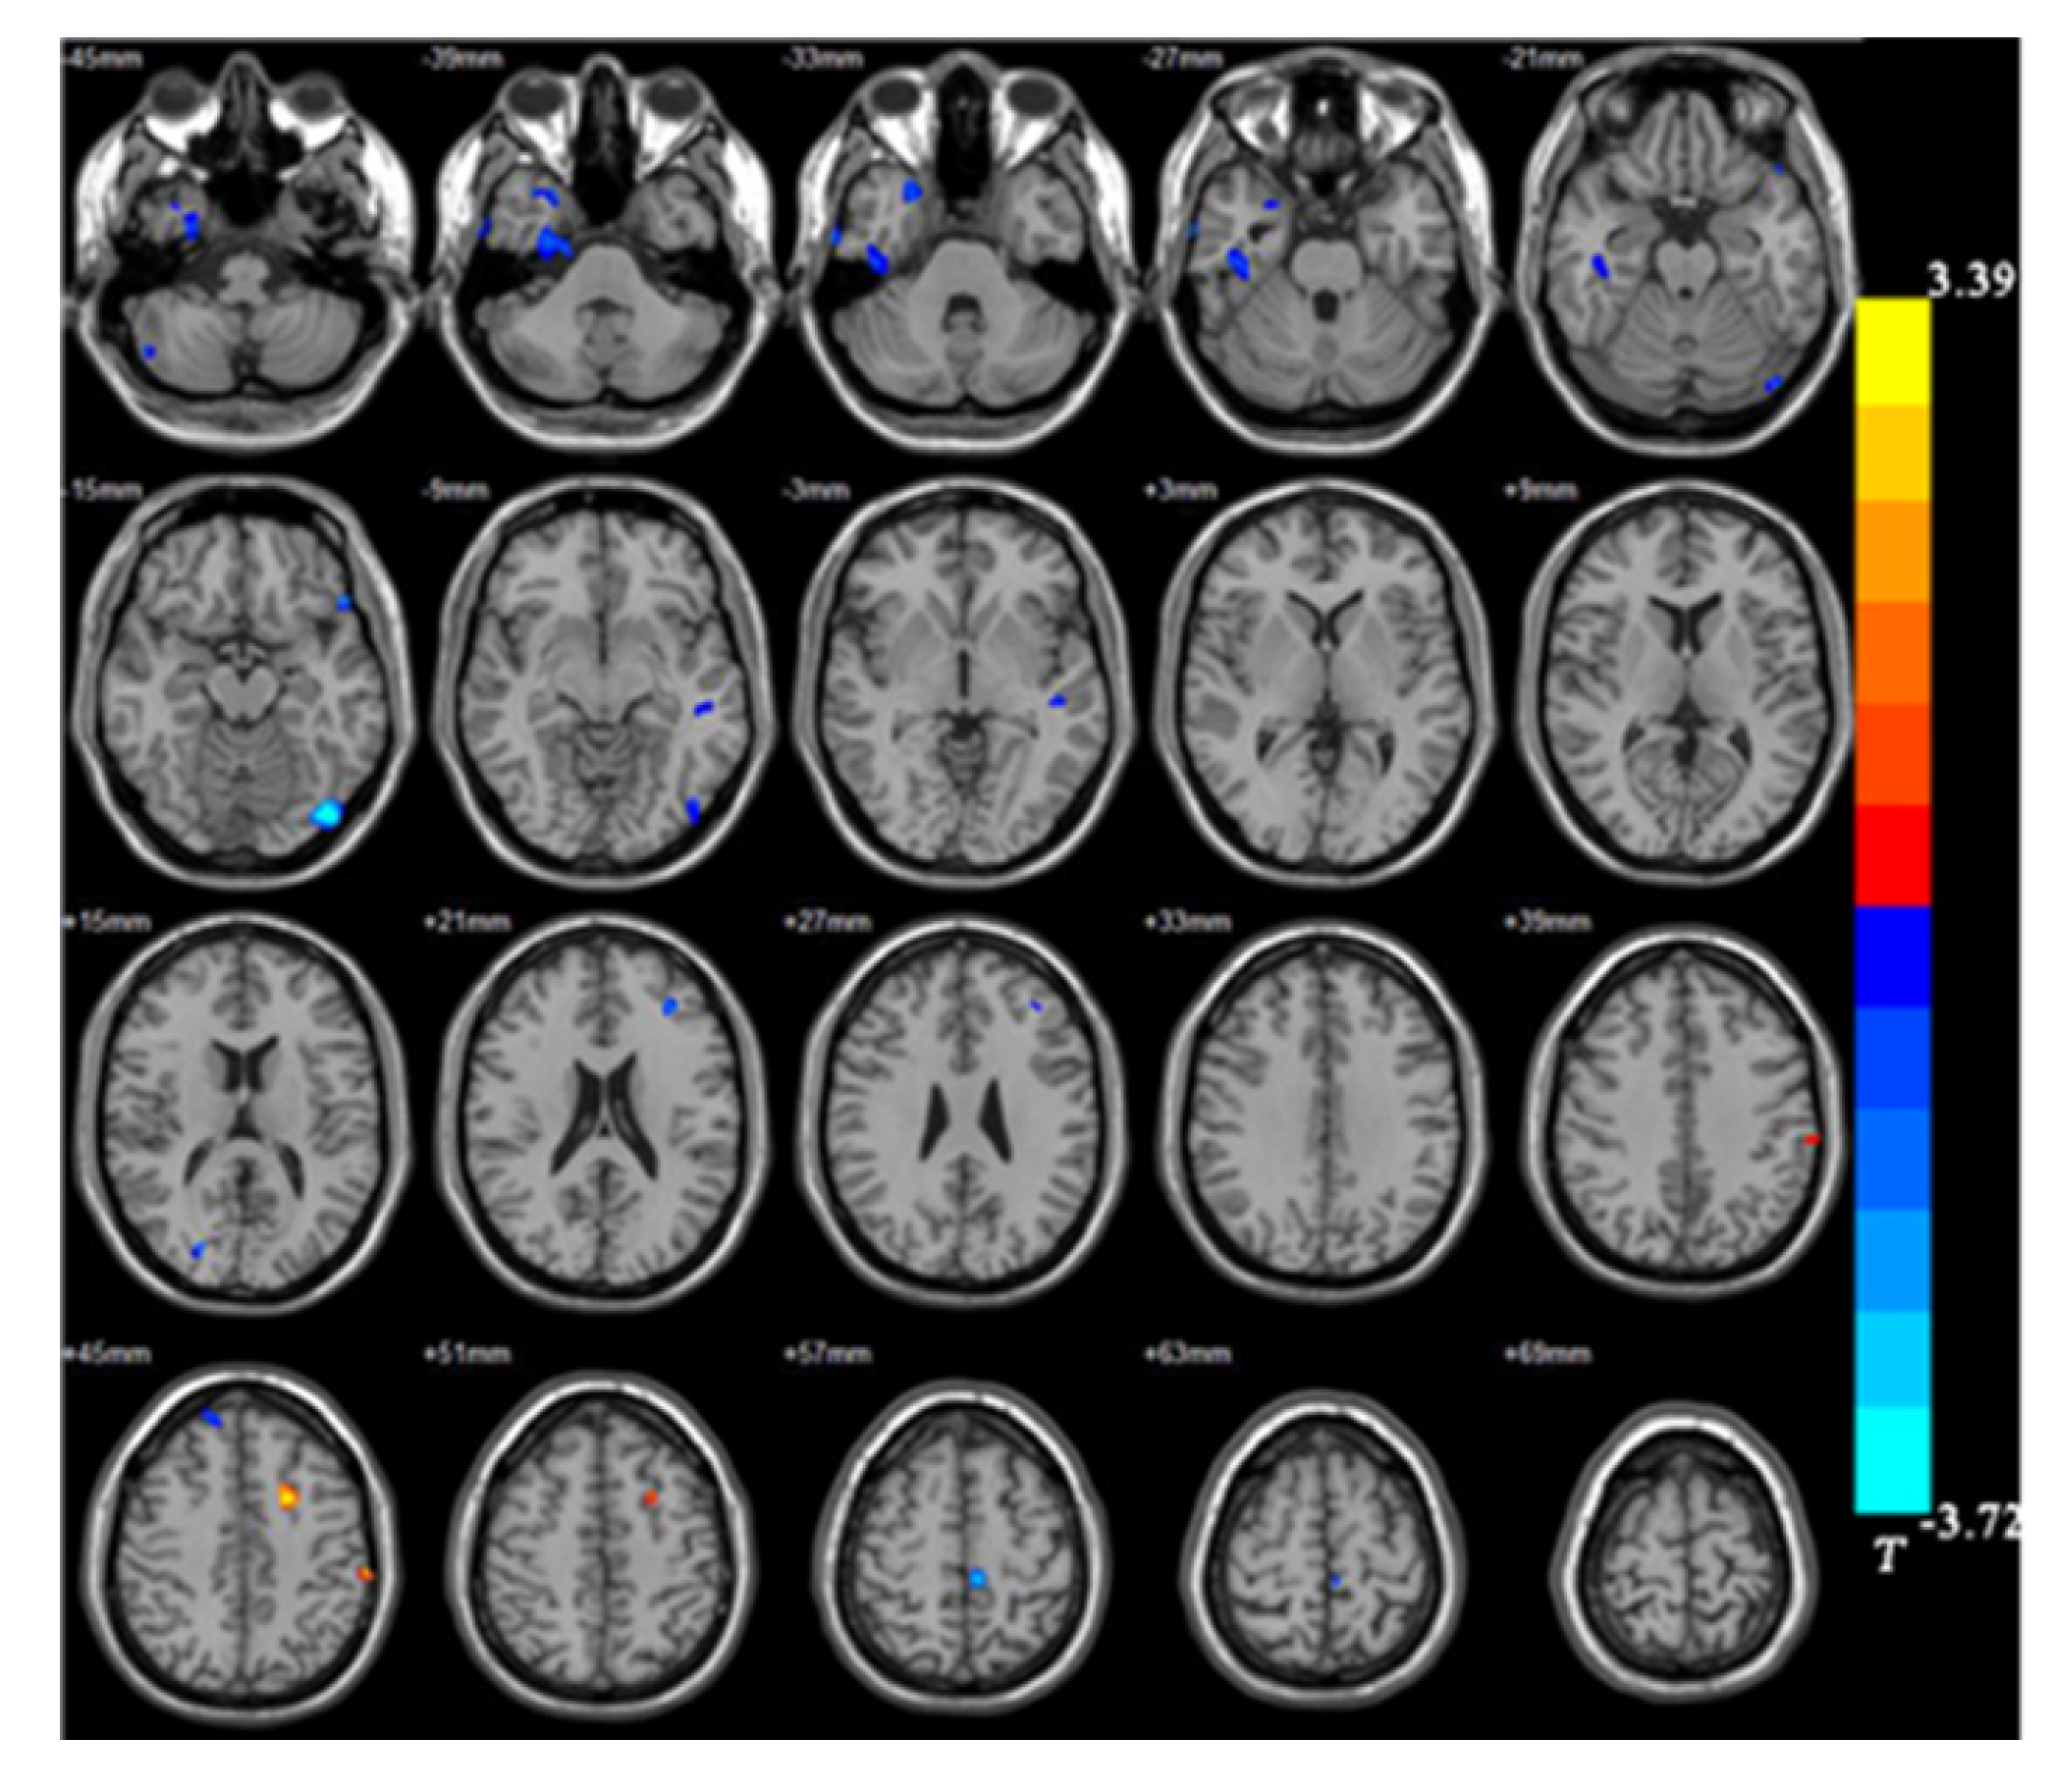
Figure 3 Distribution of brain regions with larger/smaller gray matter volume in the unipolar depression group compared with the control group.
Red: Larger gray matter volume (GMV); Blue: Smaller GMV.
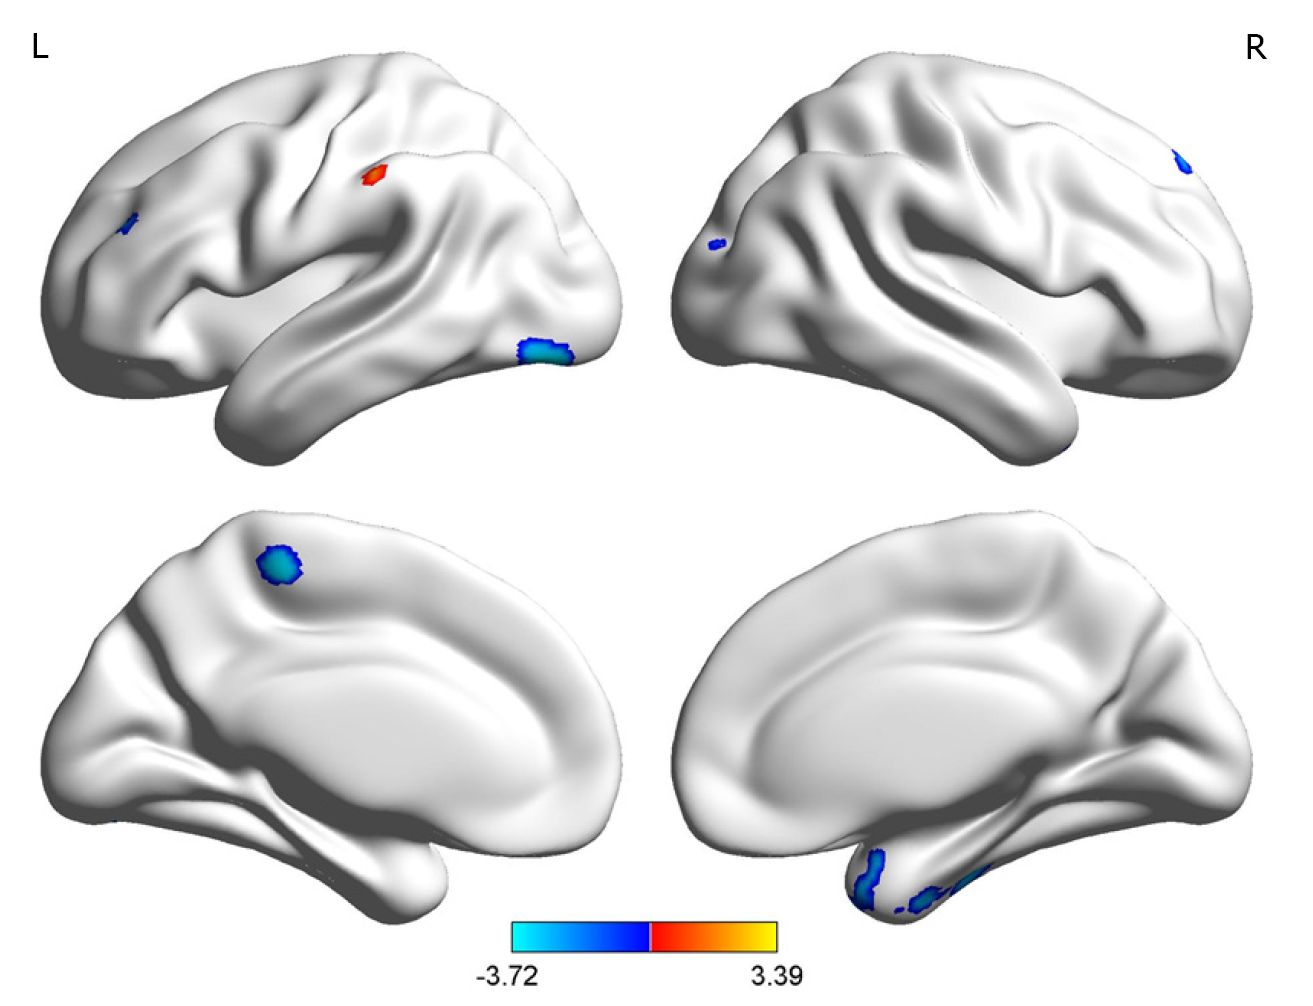
Figure 4 Comparison of voxel-based morphometry results between the unipolar depression group and the normal control group (Brainnet viewer).
Red: Larger gray matter volume (GMV); Blue: Smaller GMV.
Figure 5 Comparison of gray matter volumes between the unipolar depression group and bipolar depression group (Brainnet viewer).
- Citation: Zhang YN, Li H, Shen ZW, Xu C, Huang YJ, Wu RH. Healthy individuals vs patients with bipolar or unipolar depression in gray matter volume. World J Clin Cases 2021; 9(6): 1304-1317
- URL: https://www.wjgnet.com/2307-8960/full/v9/i6/1304.htm
- DOI: https://dx.doi.org/10.12998/wjcc.v9.i6.1304


