Copyright
©The Author(s) 2021.
World J Clin Cases. Feb 26, 2021; 9(6): 1284-1292
Published online Feb 26, 2021. doi: 10.12998/wjcc.v9.i6.1284
Published online Feb 26, 2021. doi: 10.12998/wjcc.v9.i6.1284
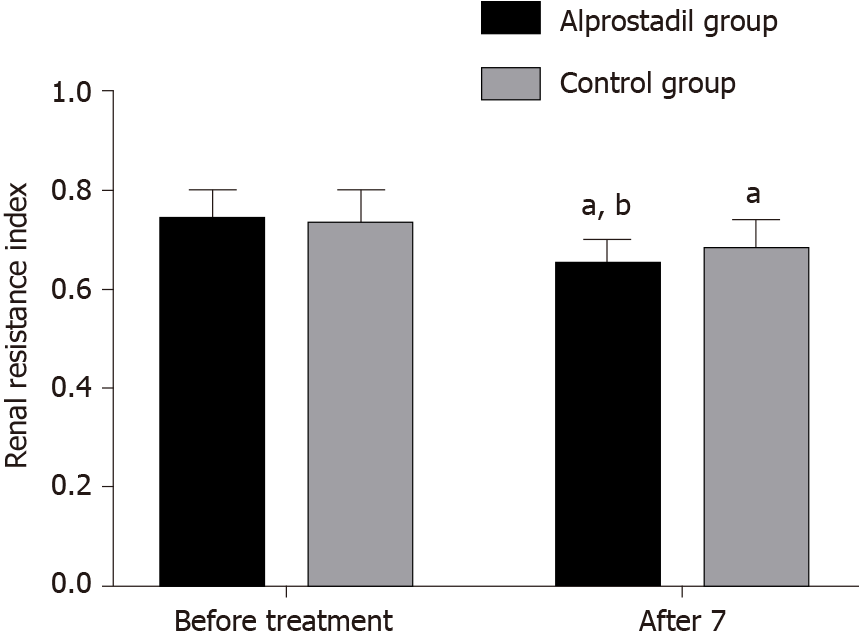
Figure 1 Histogram of renal resistance index in the two groups of patients.
Compared with this group before treatment aP < 0.05, compared with the control group bP < 0.05.
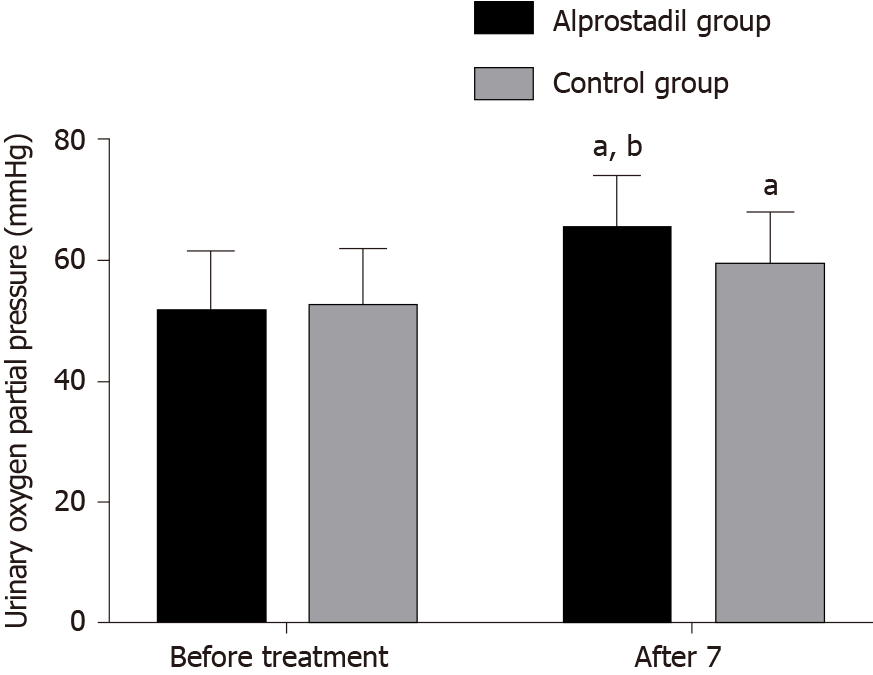
Figure 2 Histogram of partial pressure of oxygen in urine of the two groups of patients.
Compared with this group before treatment aP < 0.05, compared with the control group bP < 0.05.
- Citation: Jia Y, Liu LL, Su JL, Meng XH, Wang WX, Tian C. Effect of alprostadil in the treatment of intensive care unit patients with acute renal injury. World J Clin Cases 2021; 9(6): 1284-1292
- URL: https://www.wjgnet.com/2307-8960/full/v9/i6/1284.htm
- DOI: https://dx.doi.org/10.12998/wjcc.v9.i6.1284


