Copyright
©The Author(s) 2021.
World J Clin Cases. Feb 26, 2021; 9(6): 1271-1283
Published online Feb 26, 2021. doi: 10.12998/wjcc.v9.i6.1271
Published online Feb 26, 2021. doi: 10.12998/wjcc.v9.i6.1271
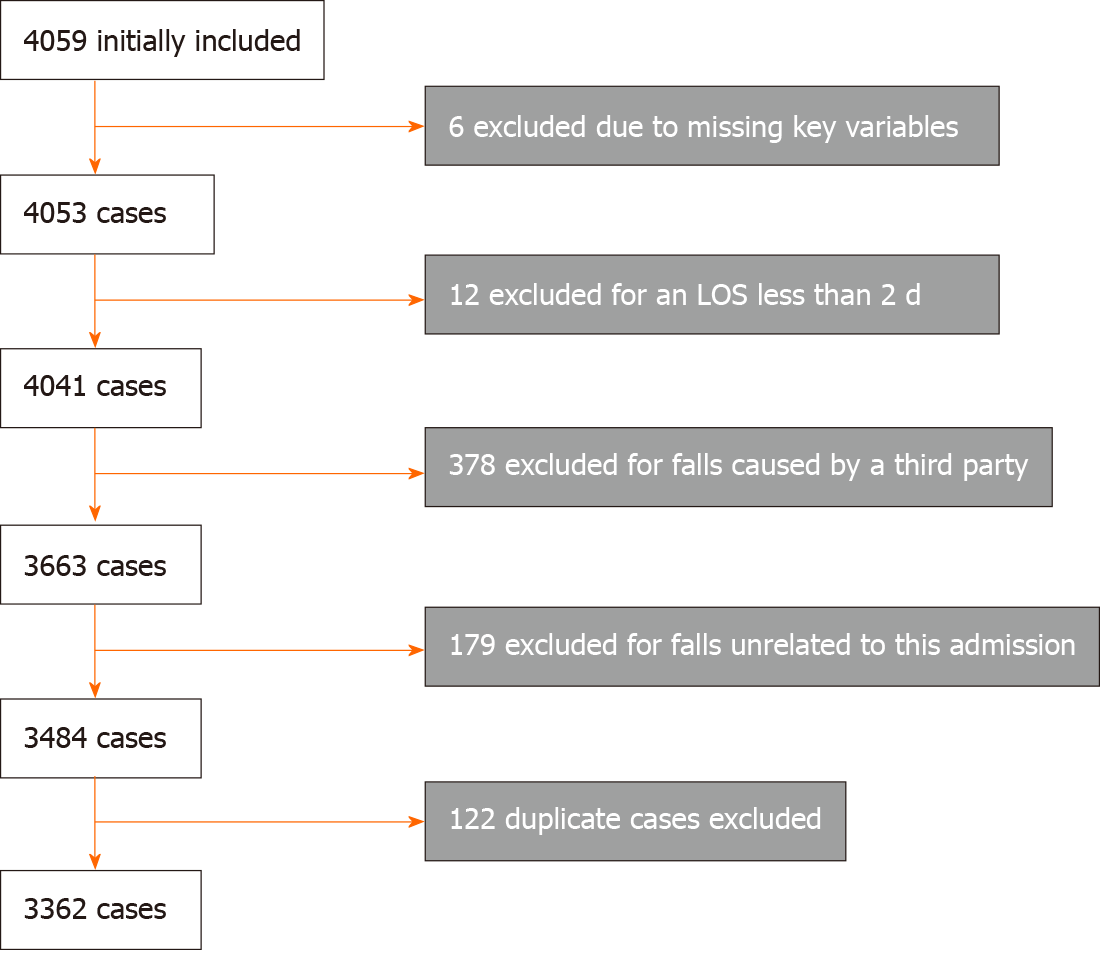
Figure 1 Flow diagram of included and excluded cases.
LOS: Length of stay.
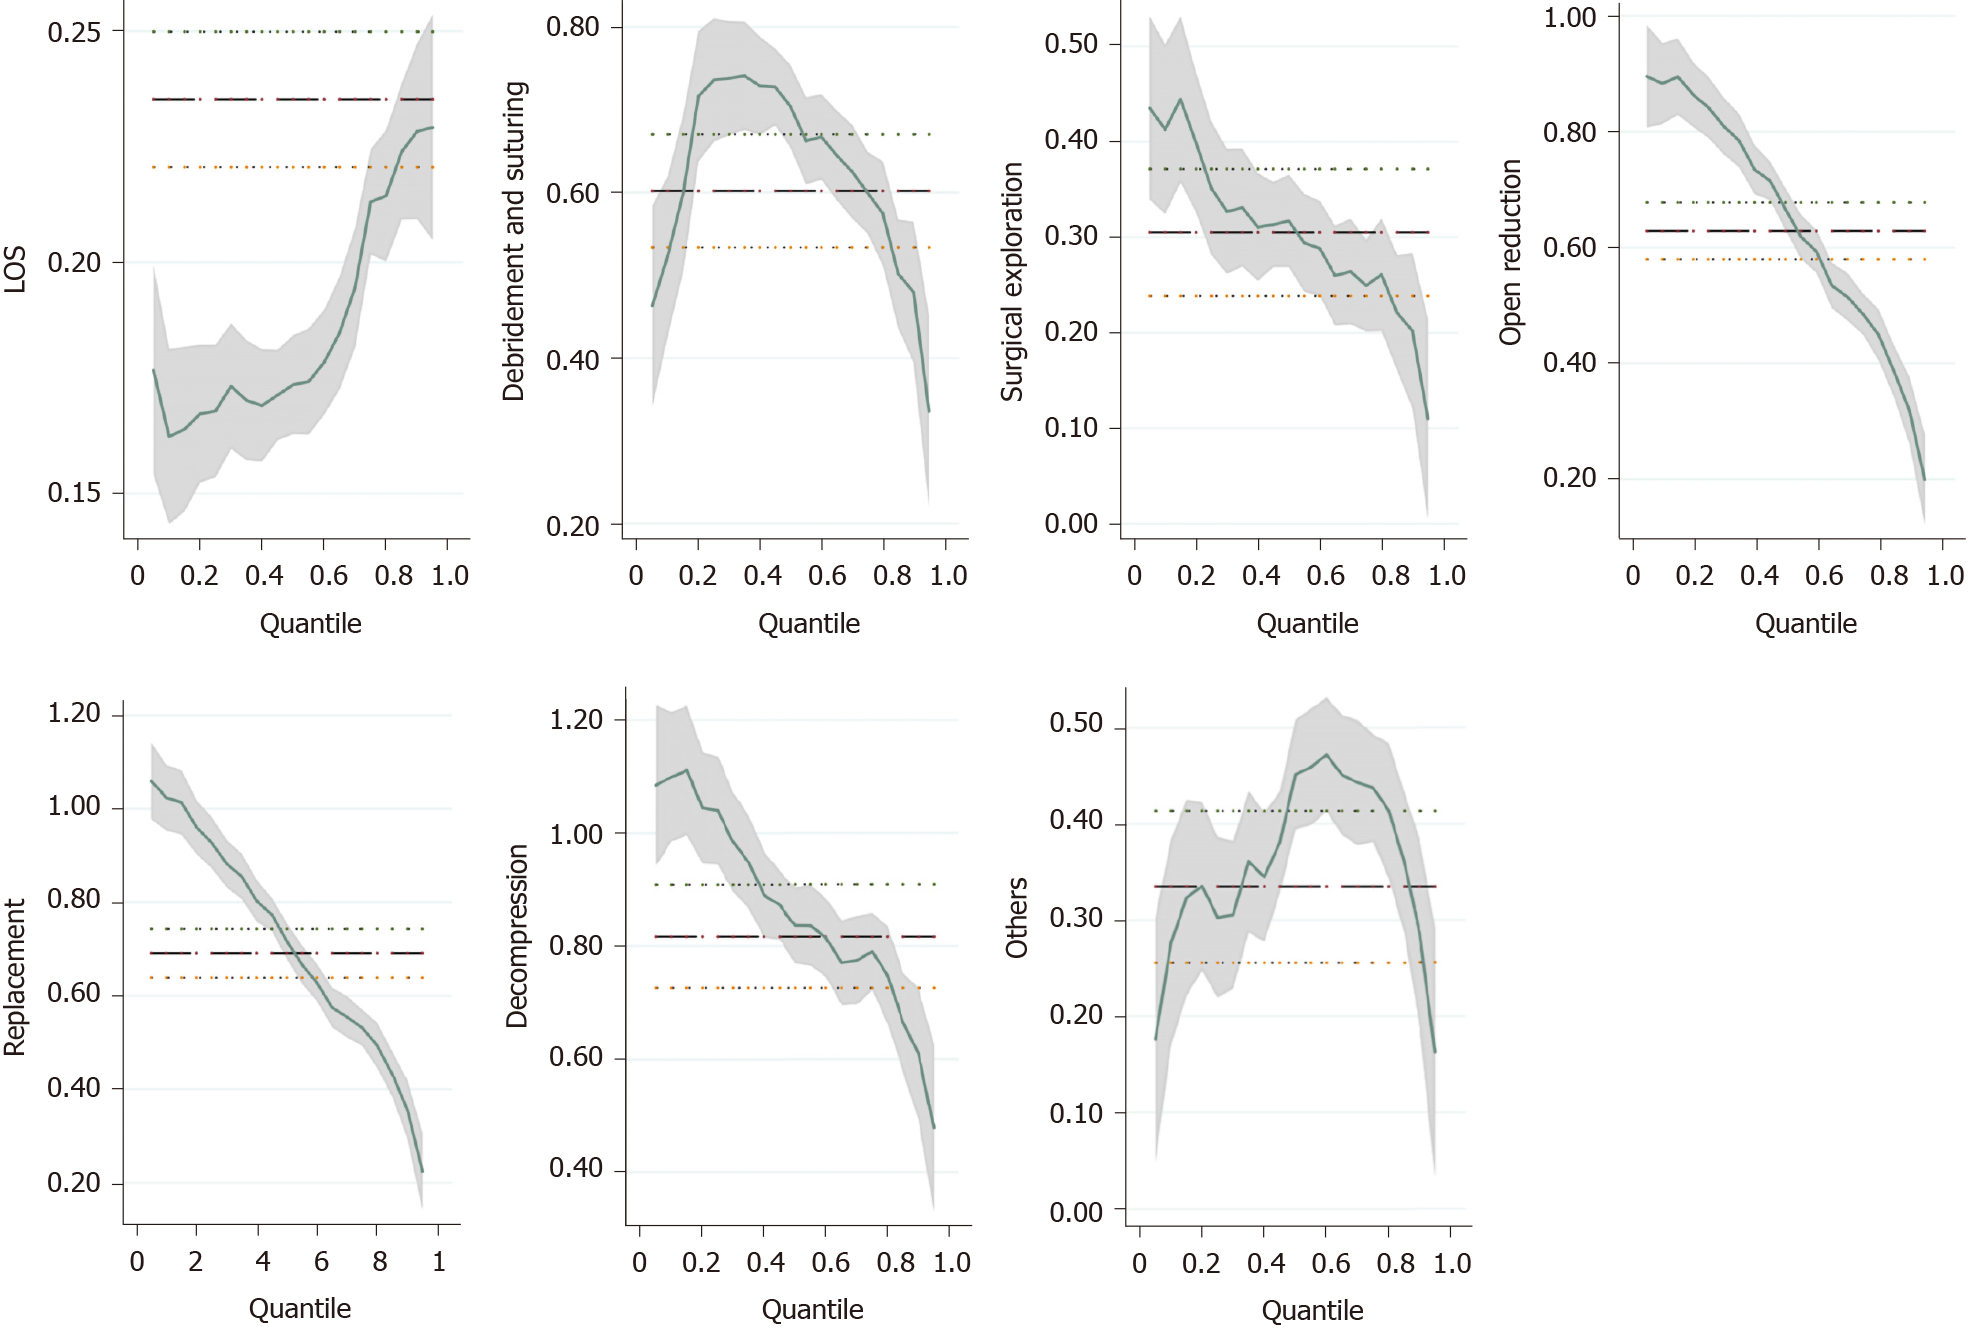
Figure 2 Coefficient curves in the quantile regression analysis.
The factors with significant influence at 10%, 50% and 90% quantiles of hospitalization expenses were selected for plotting. LOS: Length of stay.
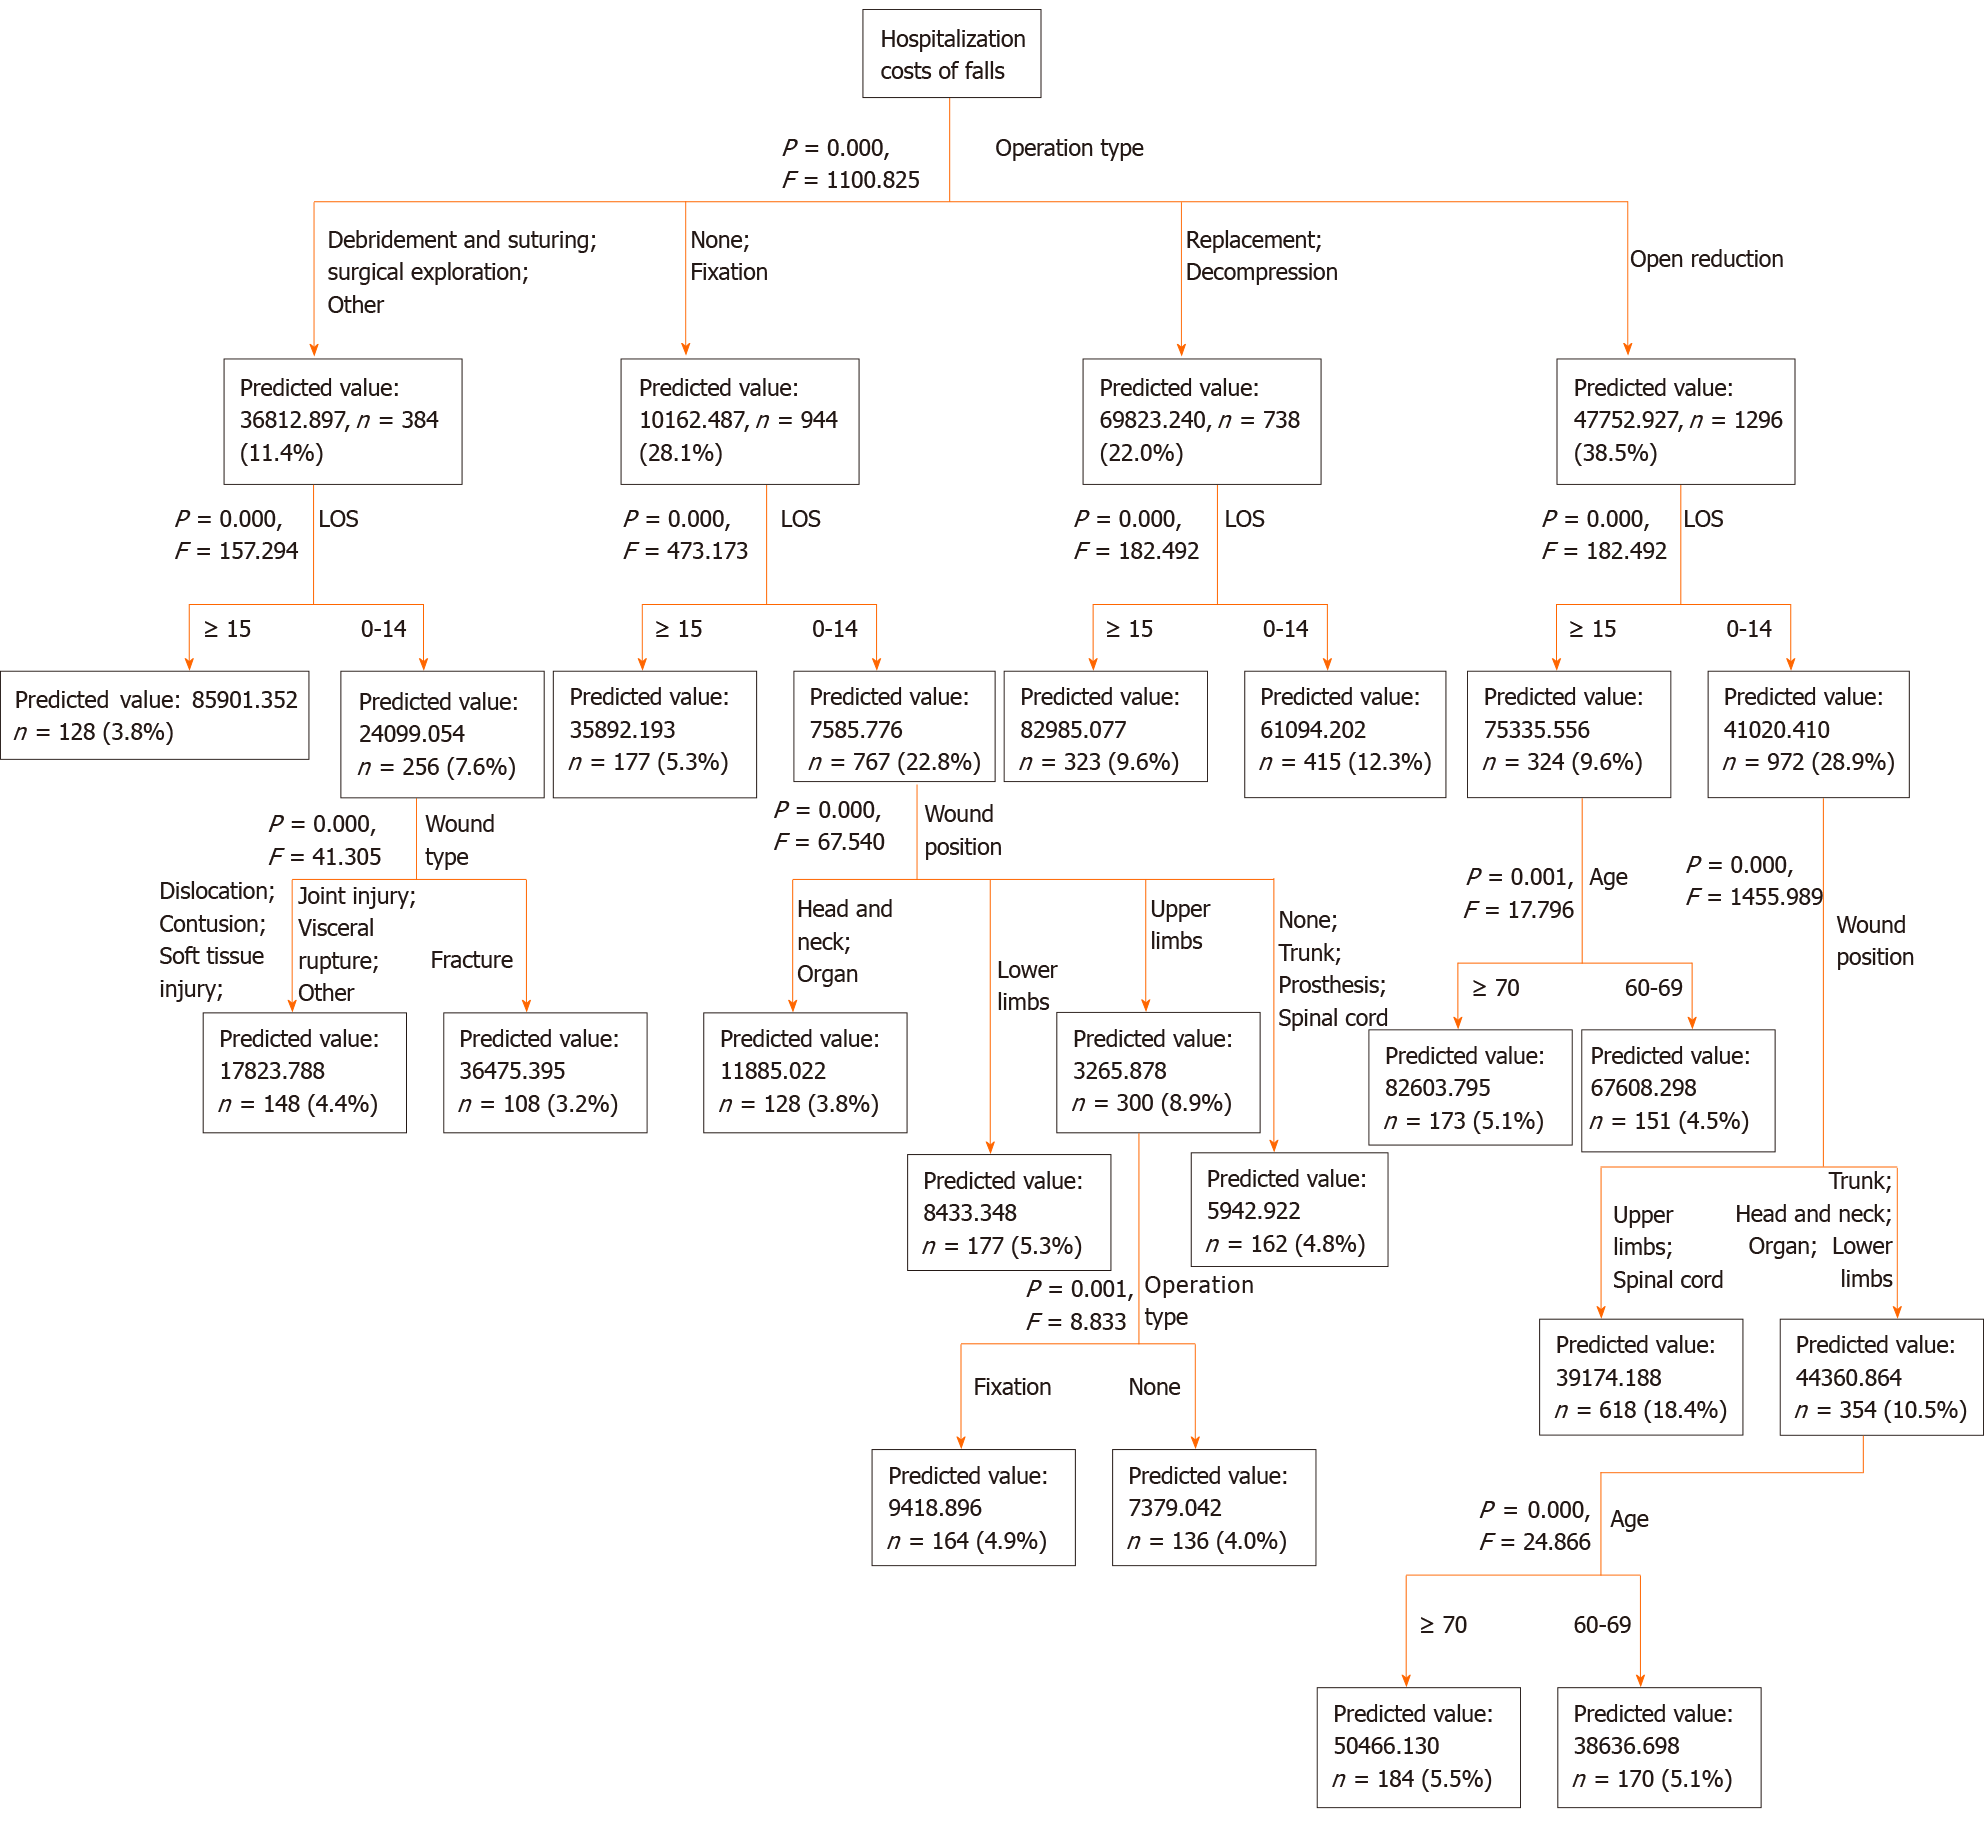
Figure 3 Grouping results based on the decision tree model.
LOS: Length of stay.
- Citation: Su FY, Fu ML, Zhao QH, Huang HH, Luo D, Xiao MZ. Analysis of hospitalization costs related to fall injuries in elderly patients. World J Clin Cases 2021; 9(6): 1271-1283
- URL: https://www.wjgnet.com/2307-8960/full/v9/i6/1271.htm
- DOI: https://dx.doi.org/10.12998/wjcc.v9.i6.1271


