Copyright
©The Author(s) 2021.
World J Clin Cases. Feb 16, 2021; 9(5): 1087-1095
Published online Feb 16, 2021. doi: 10.12998/wjcc.v9.i5.1087
Published online Feb 16, 2021. doi: 10.12998/wjcc.v9.i5.1087
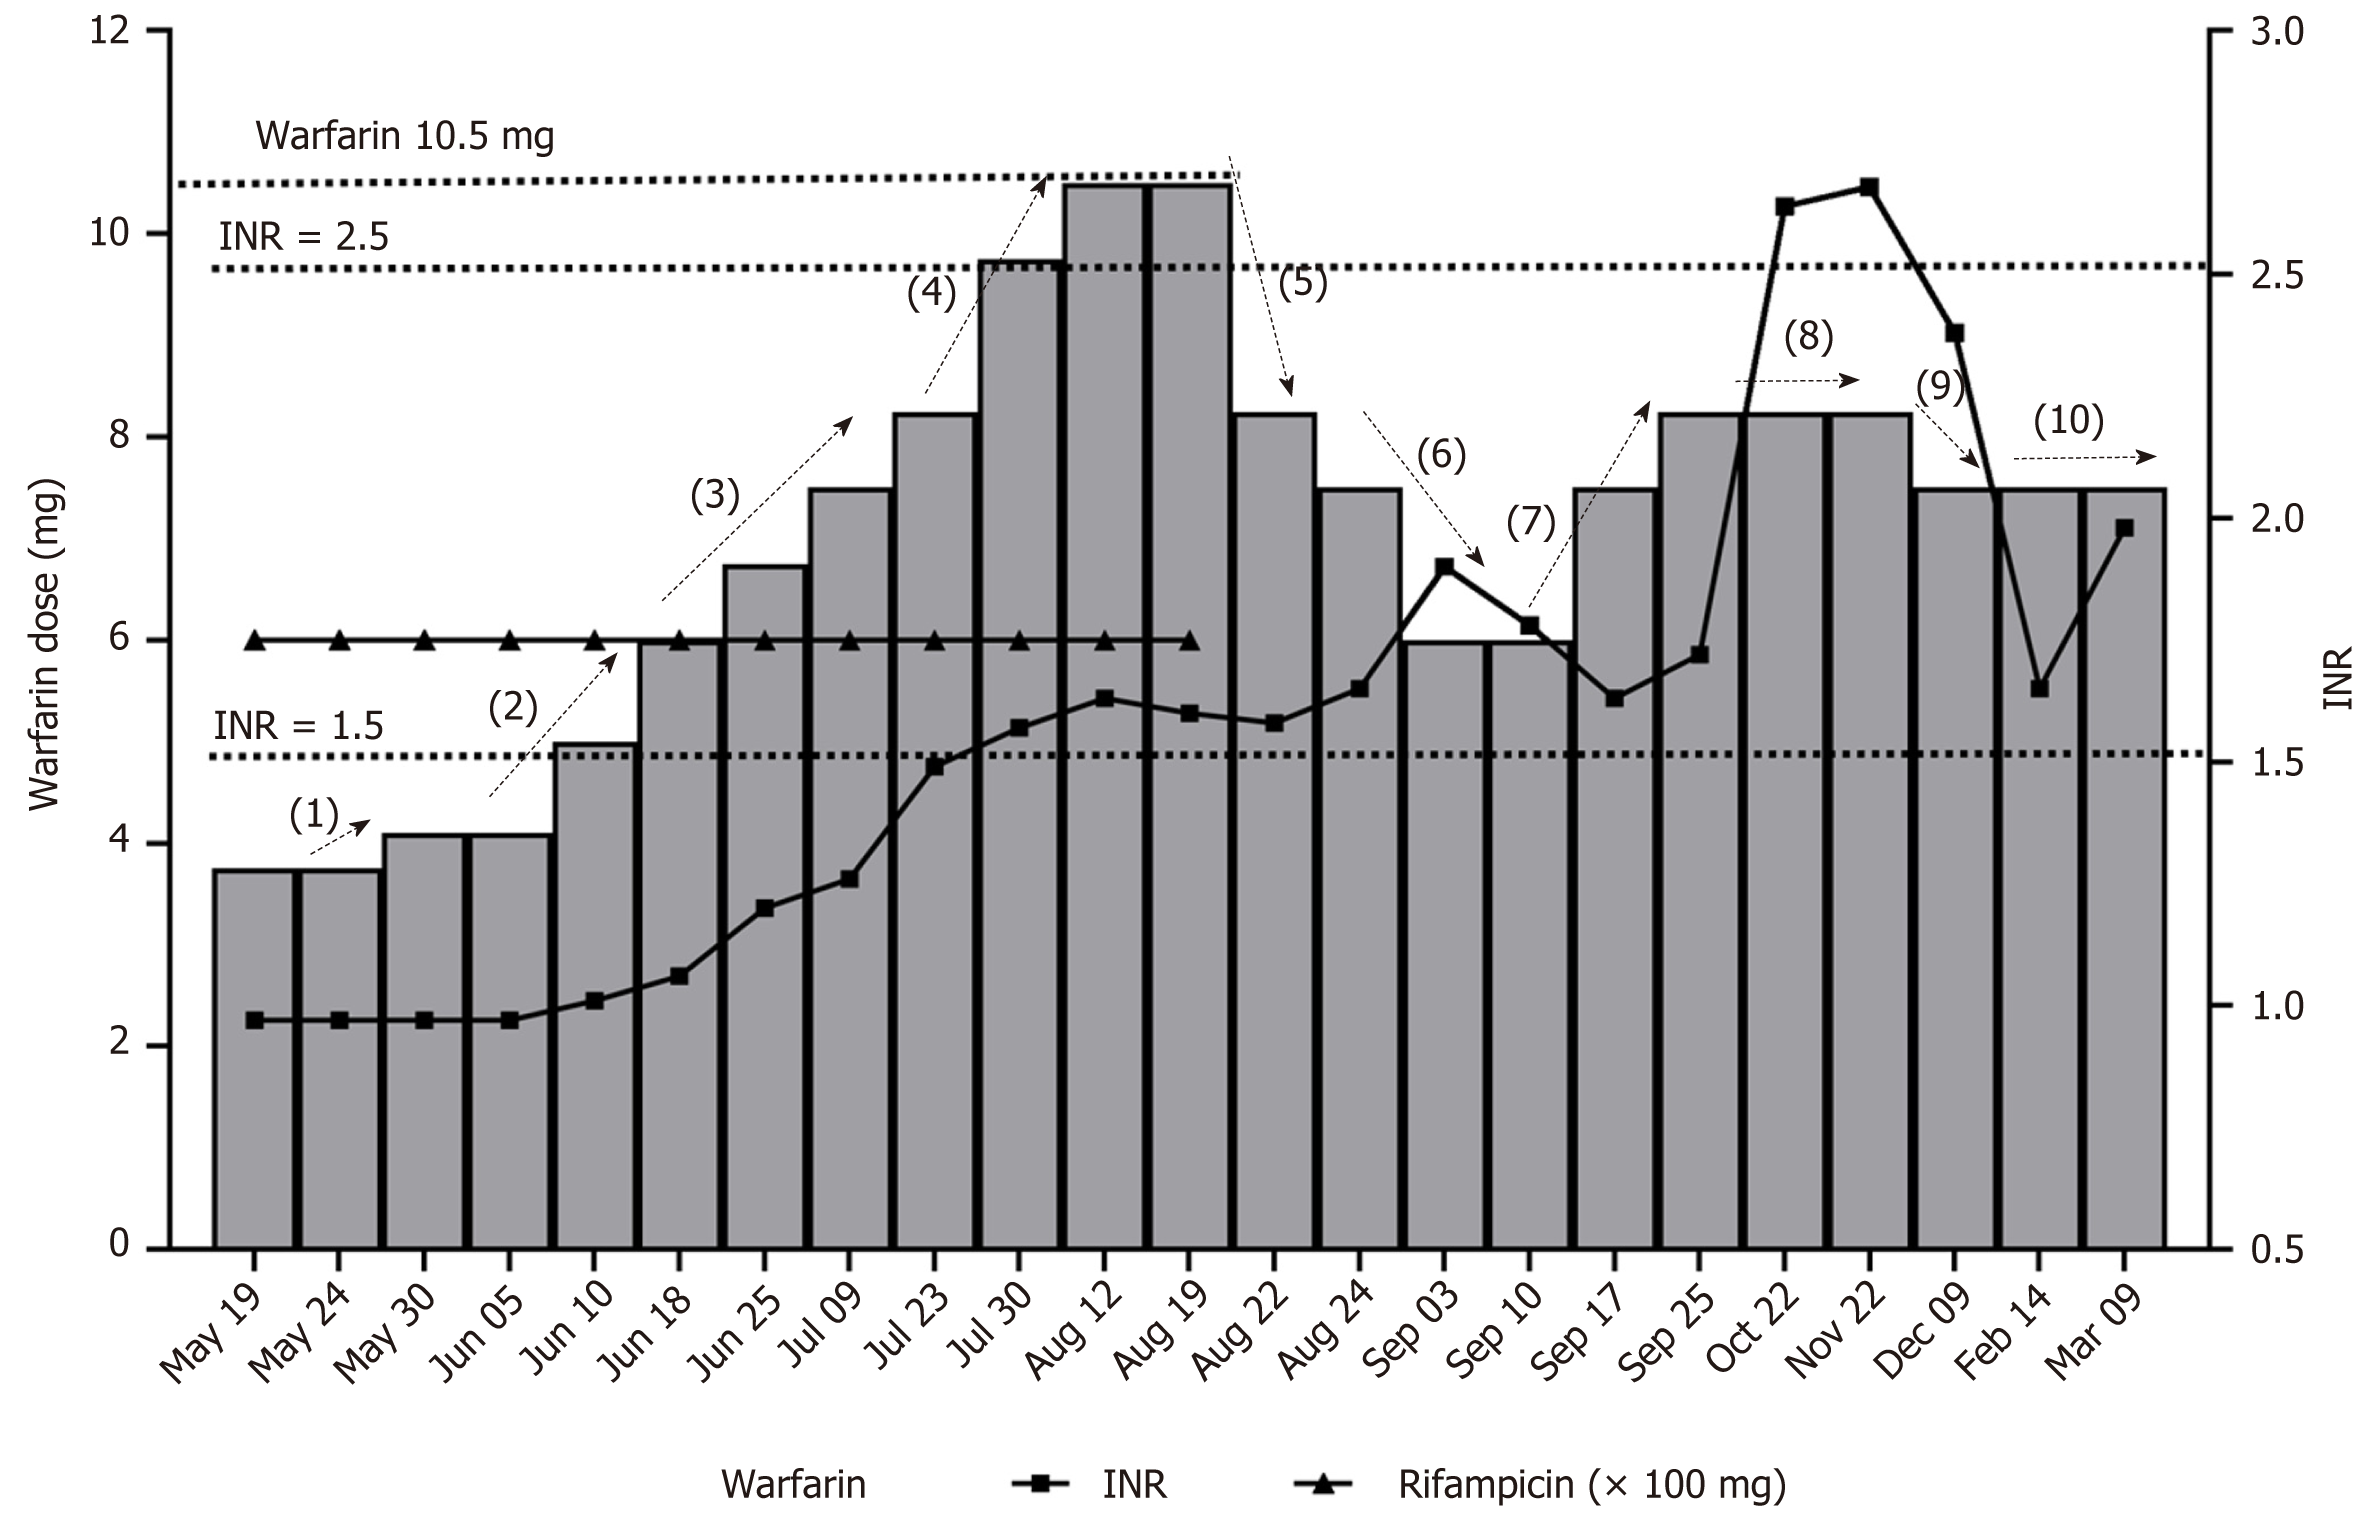
Figure 1 Warfarin dose, rifampin dose and international normalized ratio therapy over time.
The x-axis represents outpatient visit time. The left y-axis represents warfarin dose administered in mg shown by original shape points and rifampin dose administered in 100 mg shown by triangle points. The right y-axis represents international normalized ratio units and is shown by square points. (1)-(10): Pharmacist intervention notes. INR: International normalized ratio.
- Citation: Hu YN, Zhou BT, Yang HR, Peng QL, Gu XR, Sun SS. Effect of rifampicin on anticoagulation of warfarin: A case report. World J Clin Cases 2021; 9(5): 1087-1095
- URL: https://www.wjgnet.com/2307-8960/full/v9/i5/1087.htm
- DOI: https://dx.doi.org/10.12998/wjcc.v9.i5.1087


