Copyright
©The Author(s) 2021.
World J Clin Cases. Feb 16, 2021; 9(5): 1037-1047
Published online Feb 16, 2021. doi: 10.12998/wjcc.v9.i5.1037
Published online Feb 16, 2021. doi: 10.12998/wjcc.v9.i5.1037
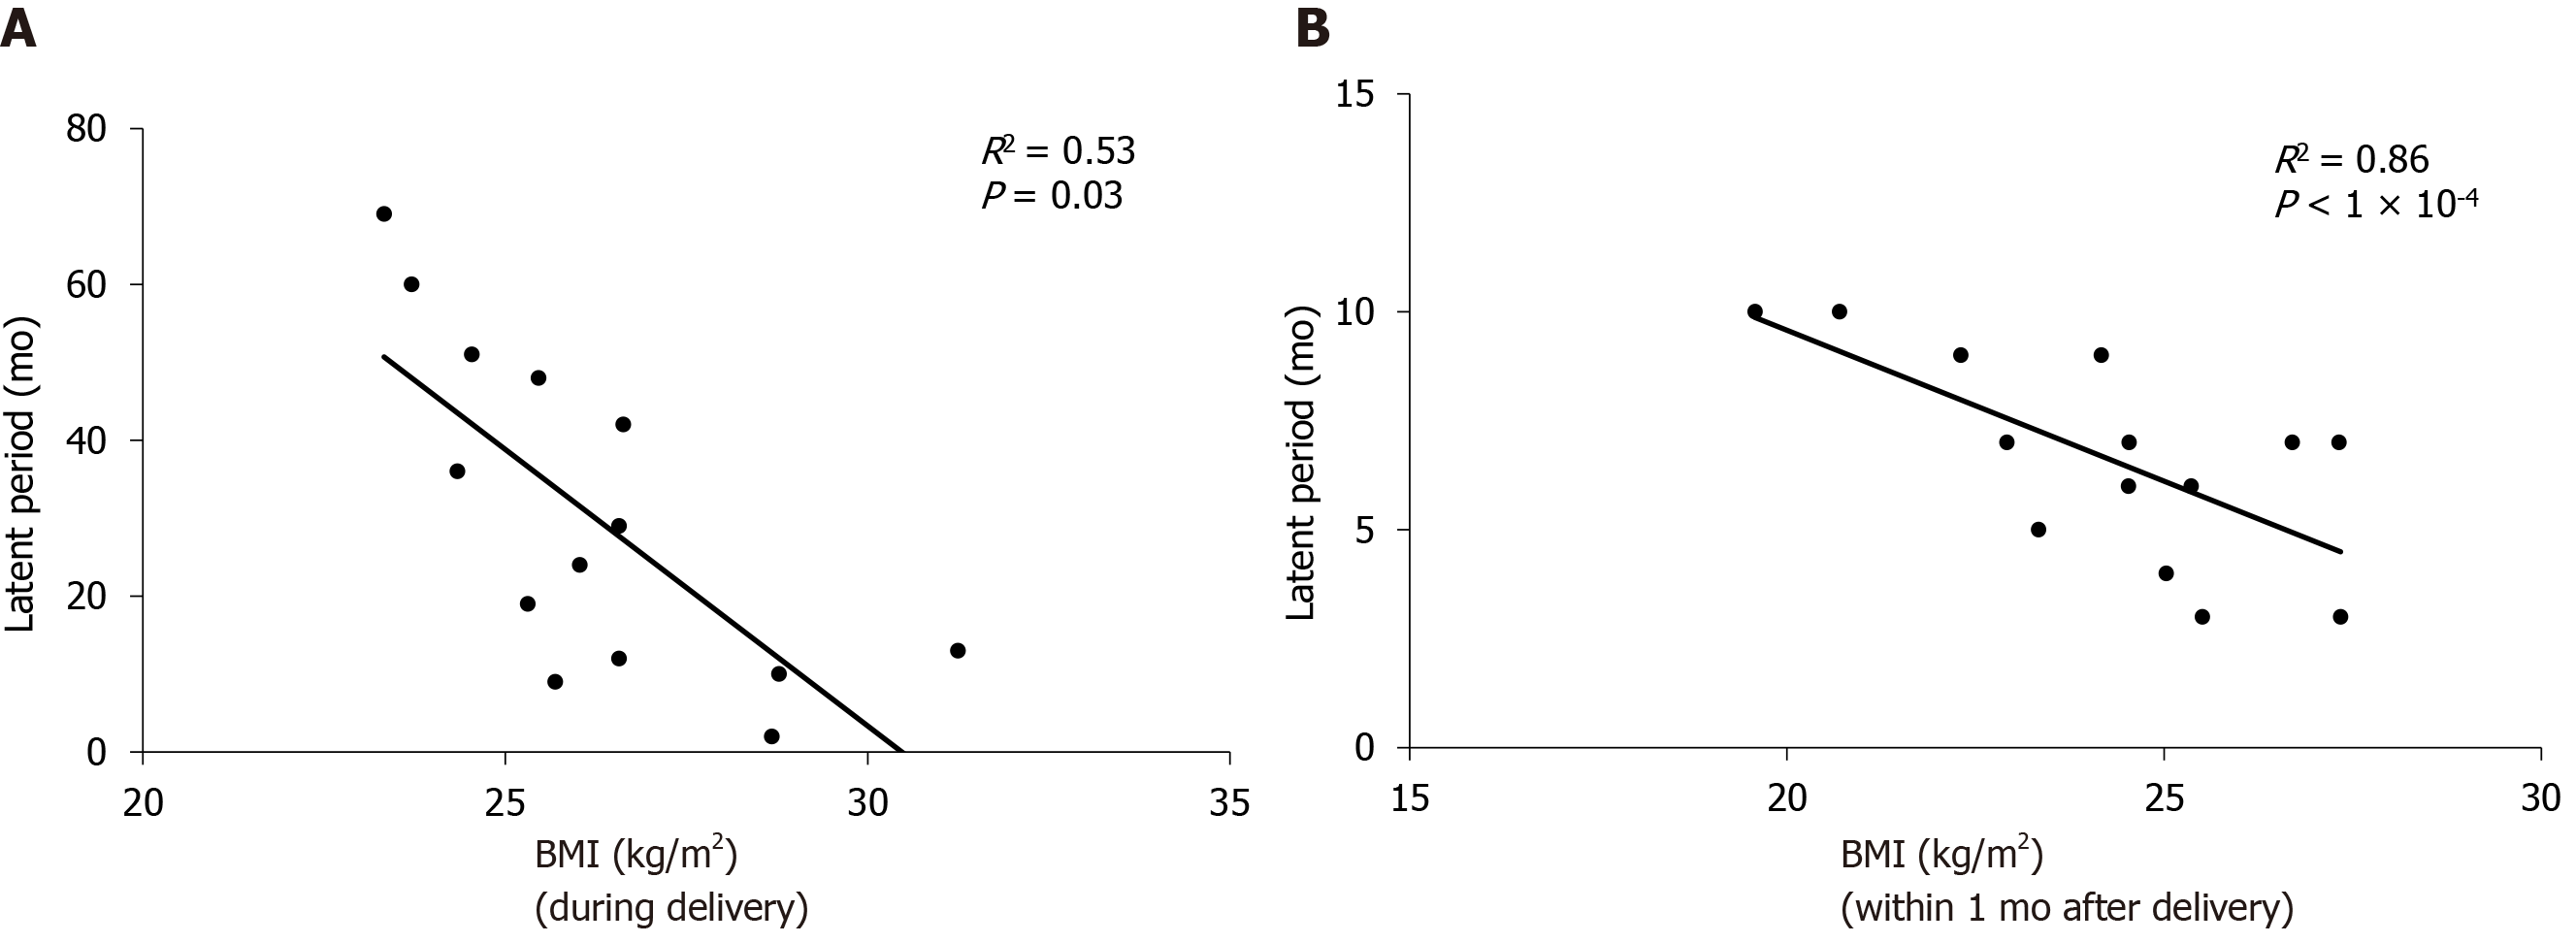
Figure 1 Correlation between incubation period and body mass index at delivery and body mass index within one month after delivery, respectively.
A: Body mass index (BMI) at delivery is negatively correlated with incubation period (R2 = 0.53, P < 0.05); B: BMI within 1 mo after delivery is negatively correlated with incubation period (R2 = 0.86, P < 0.05). BMI: Body mass index.
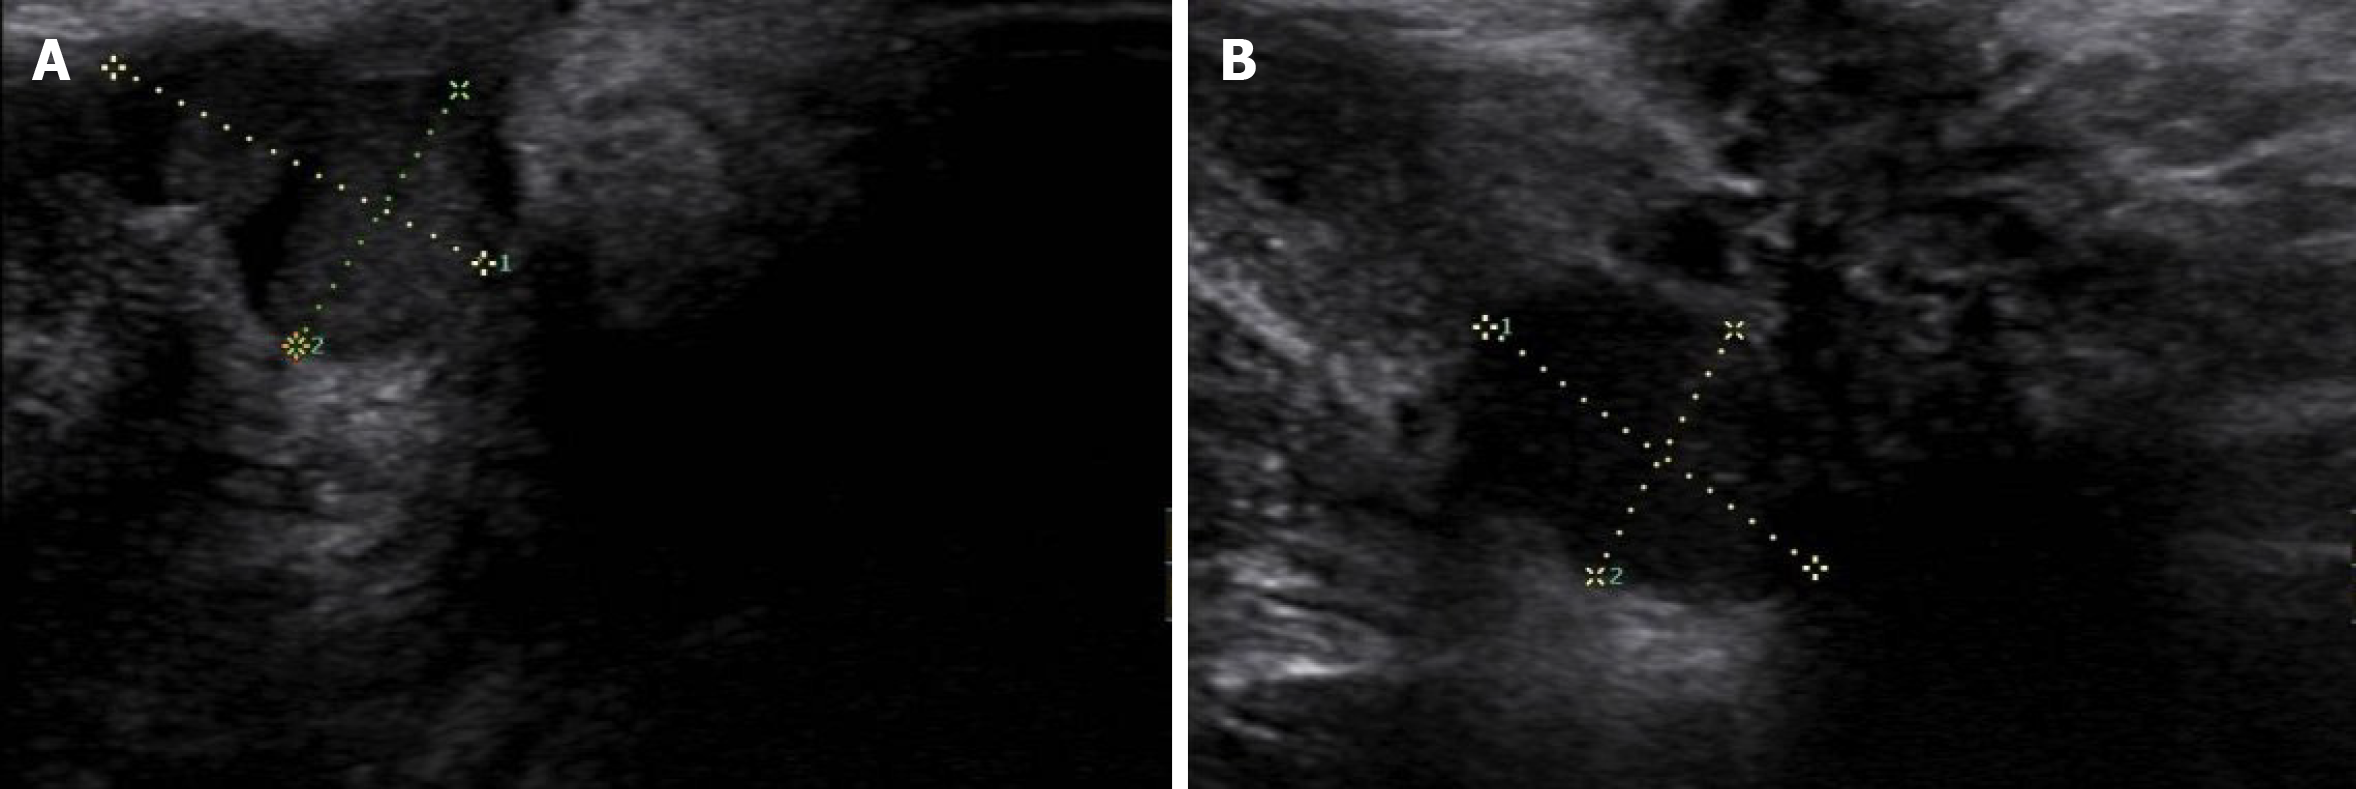
Figure 2 Ultrasound images of perineal endometriosis.
A: A 16 mm × 16 mm × 12 mm low-echo mass located under the perineal incision; B: Another heterogeneous-echo mass with an obscure boundary and regular shape is located beneath the lesion shown in Figure A.
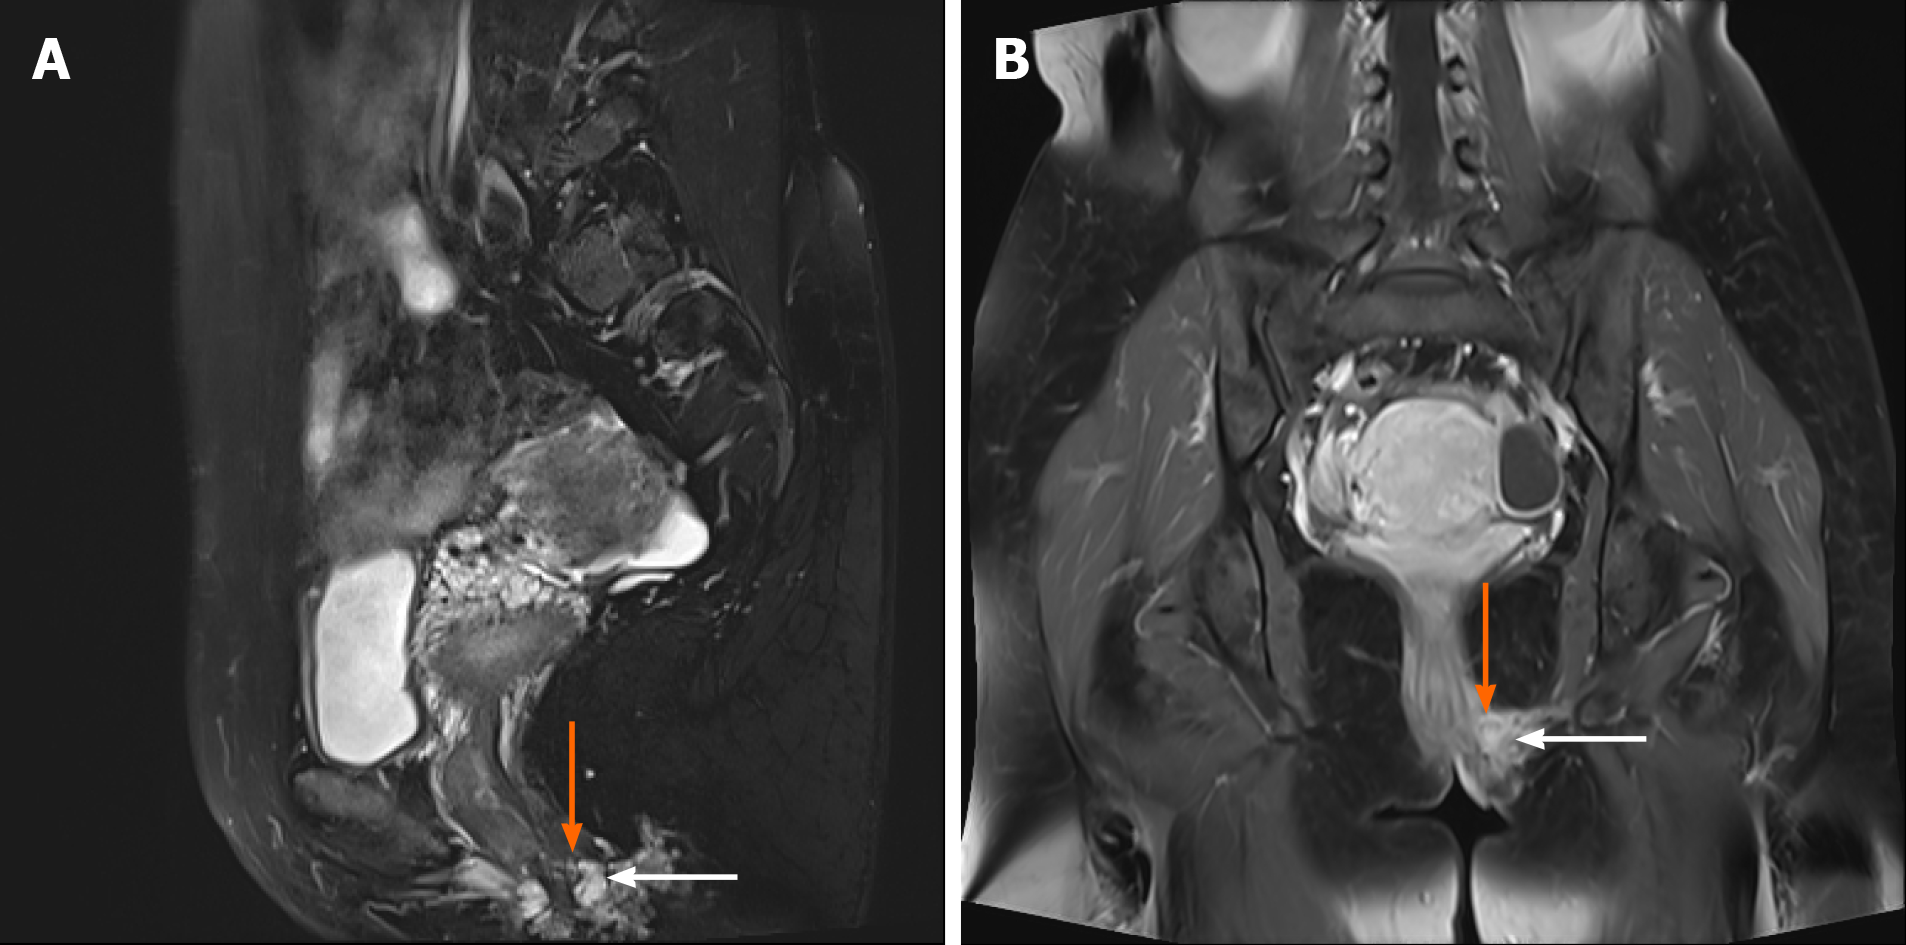
Figure 3 Magnetic resonance imaging shows perineal endometriosis lesions invading the external anal sphincter (A and B, the perineal endometriosis lesion is indicated by the orange arrow and the external anal sphincter is indicated by the white arrow).
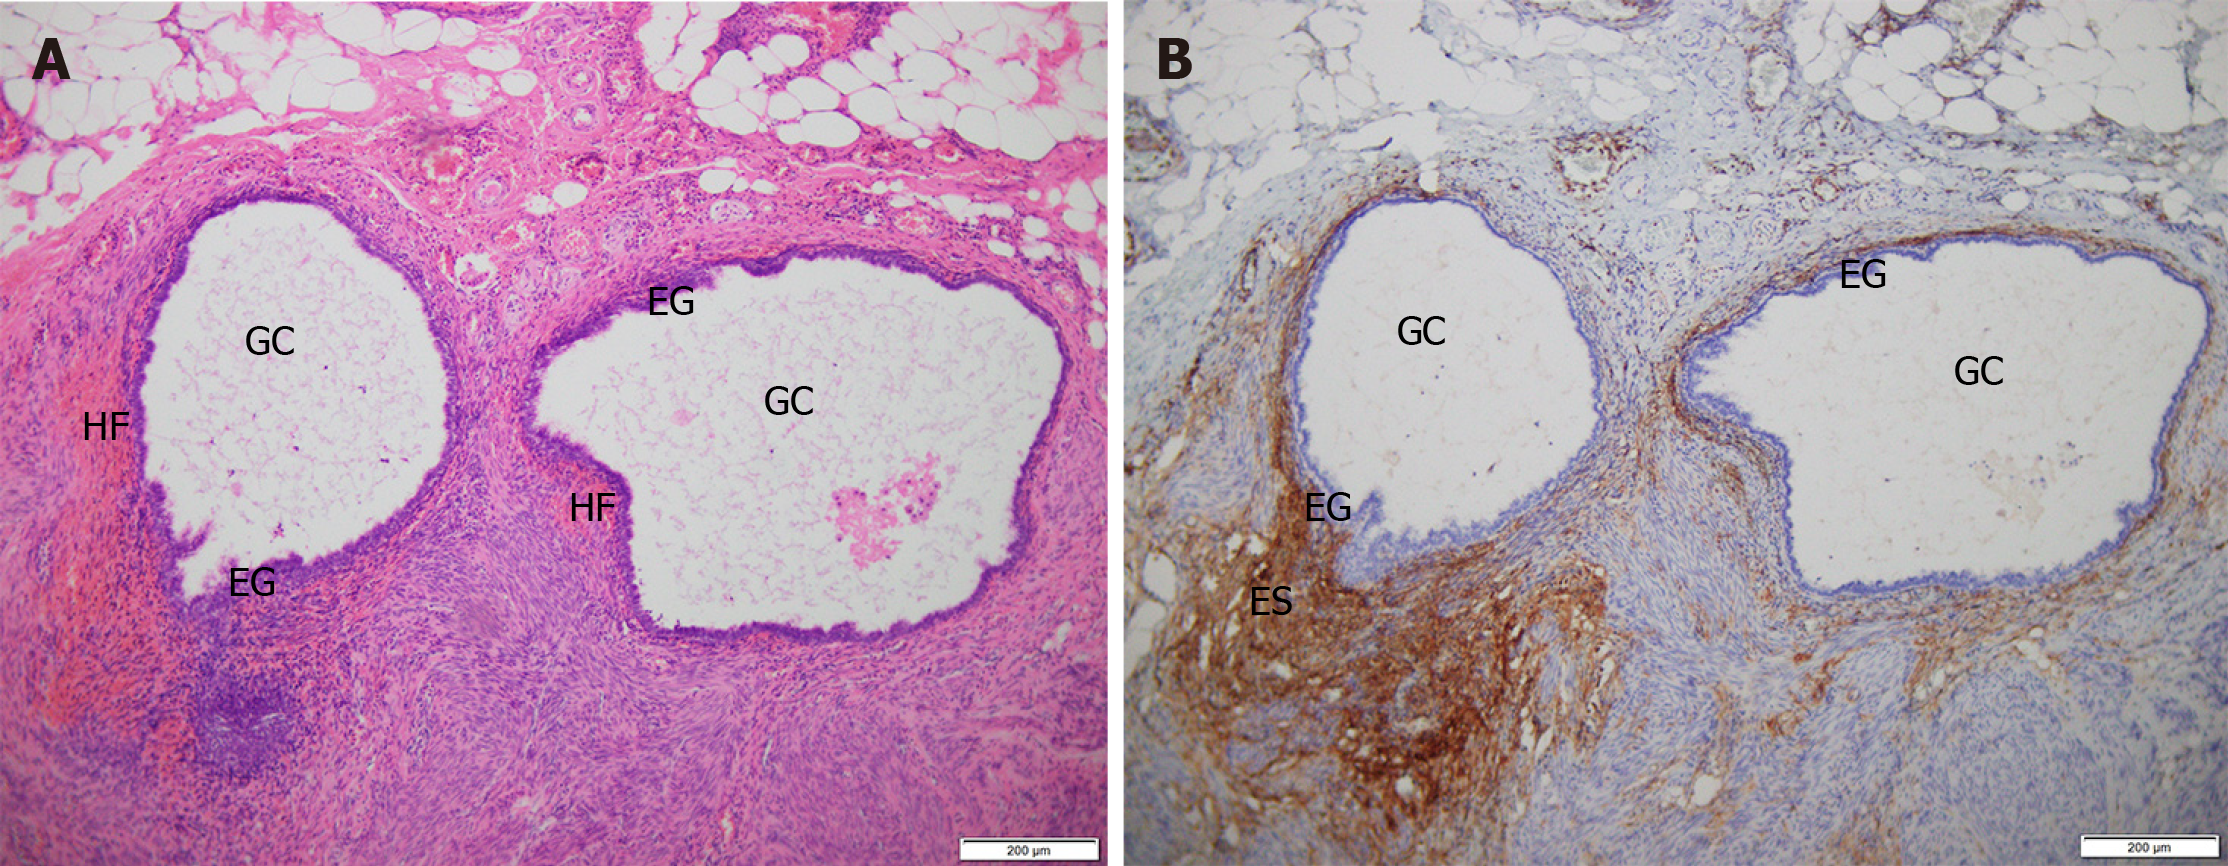
Figure 4 Hematoxylin-eosin staining and immunohistochemistry staining of perineal endometriosis lesions.
A: Hematoxylin-eosin (HE) staining shows endometriotic lesions are located in fat, smooth muscle and fibrous connective tissue. The lesion is composed of endometrial glands and surrounding stroma with local hemorrhage (HE, × 100); B: Immunohistochemistry staining shows that endometrial stromal cells are CD10 positive (× 100). GC: Glandular cavity; EG: Endometrial glands; ES: Endometrial stroma; HF: Hemorrhagic foci.
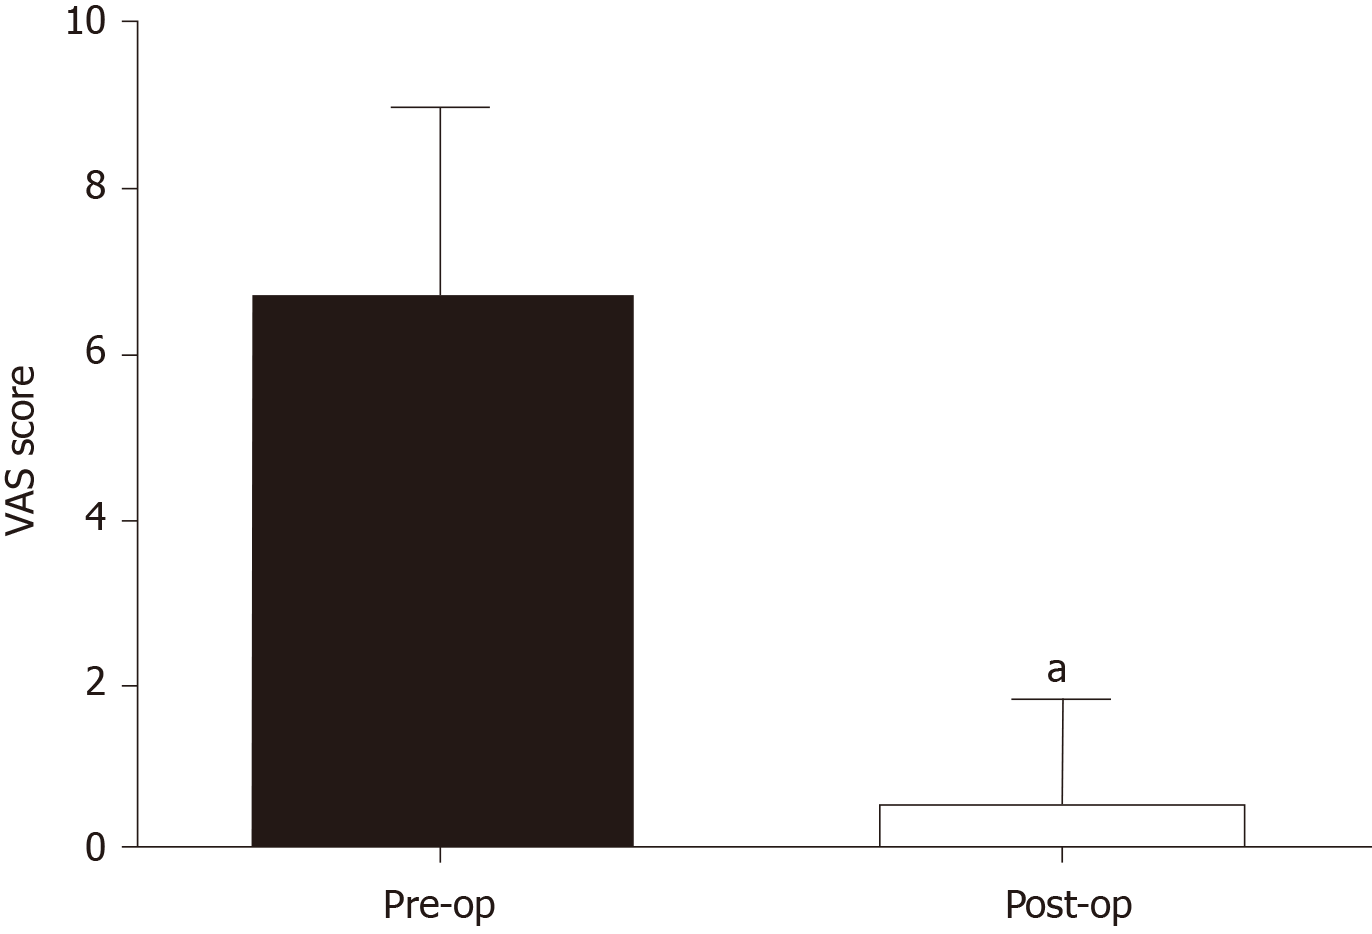
Figure 5 Comparison between preoperative visual analog scale scores of 14 perineal endometriosis cases and the scores 3 mo after operation (P < 0.
05). VAS: Visual analogue scale; Pre-op: Pre-operation; Post-op: Post-operation.
- Citation: Liang Y, Zhang D, Jiang L, Liu Y, Zhang J. Clinical characteristics of perineal endometriosis: A case series. World J Clin Cases 2021; 9(5): 1037-1047
- URL: https://www.wjgnet.com/2307-8960/full/v9/i5/1037.htm
- DOI: https://dx.doi.org/10.12998/wjcc.v9.i5.1037


