Copyright
©The Author(s) 2021.
World J Clin Cases. Feb 6, 2021; 9(4): 864-870
Published online Feb 6, 2021. doi: 10.12998/wjcc.v9.i4.864
Published online Feb 6, 2021. doi: 10.12998/wjcc.v9.i4.864
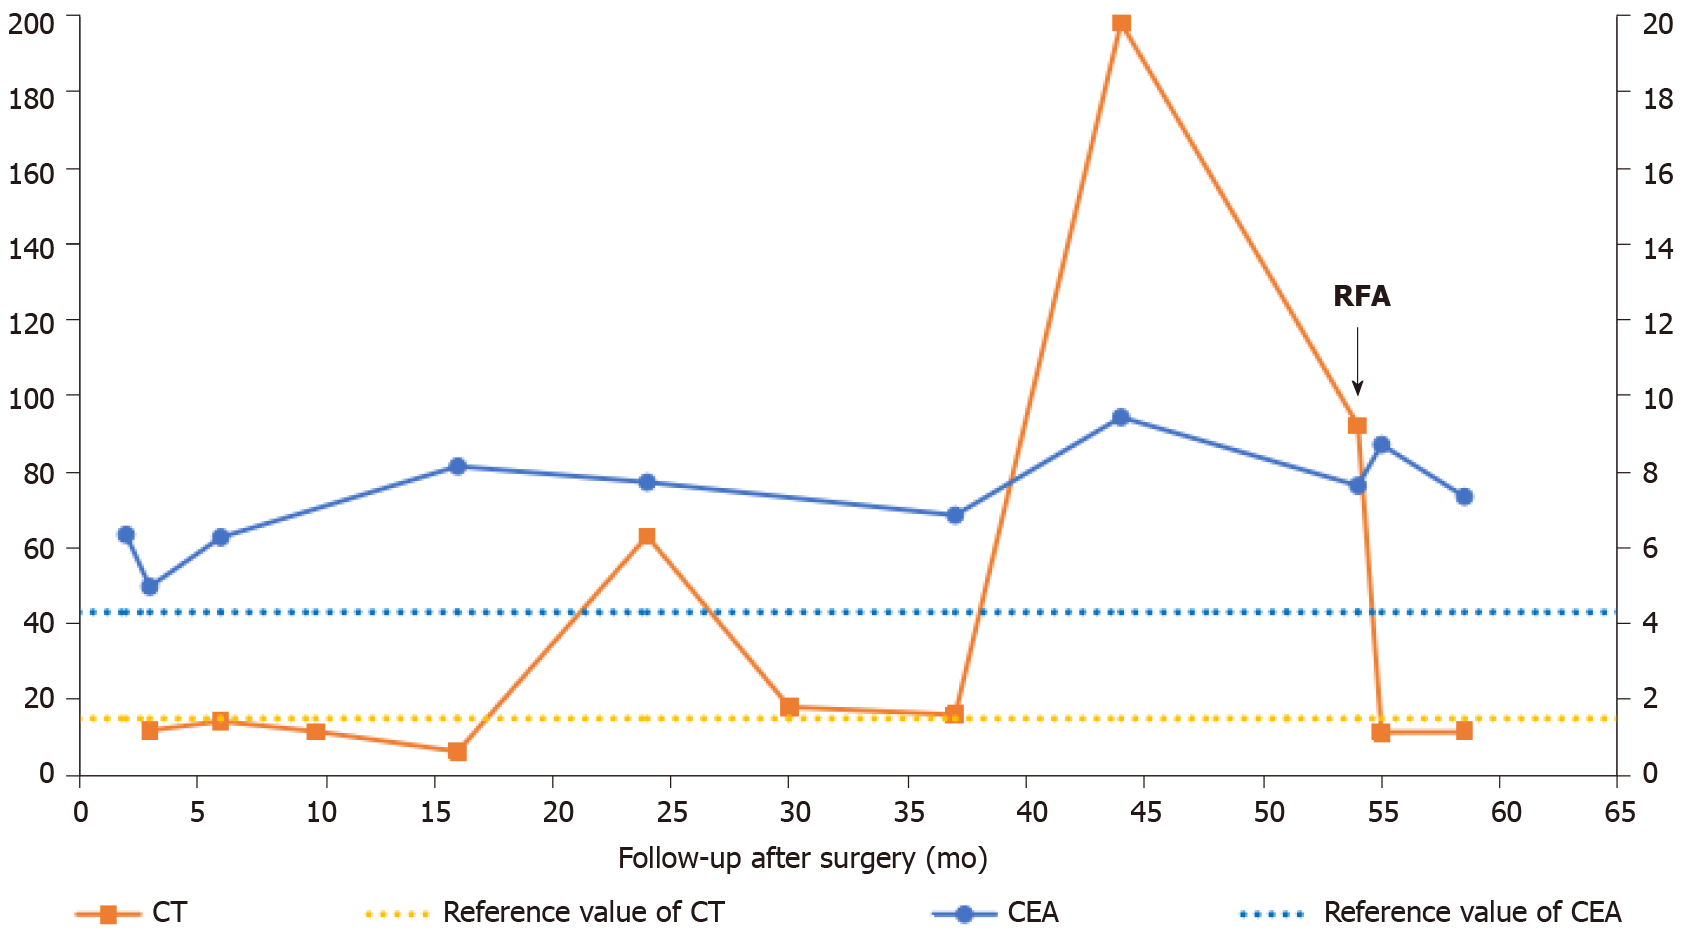
Figure 1 Changes of serum calcitonin and carcinoembryonic antigen levels at each follow-up visit after the initial surgery.
The dashed lines indicate reference values. CEA: Carcinoembryonic antigen; CT: Calcitonin; RFA: Radiofrequency ablation.
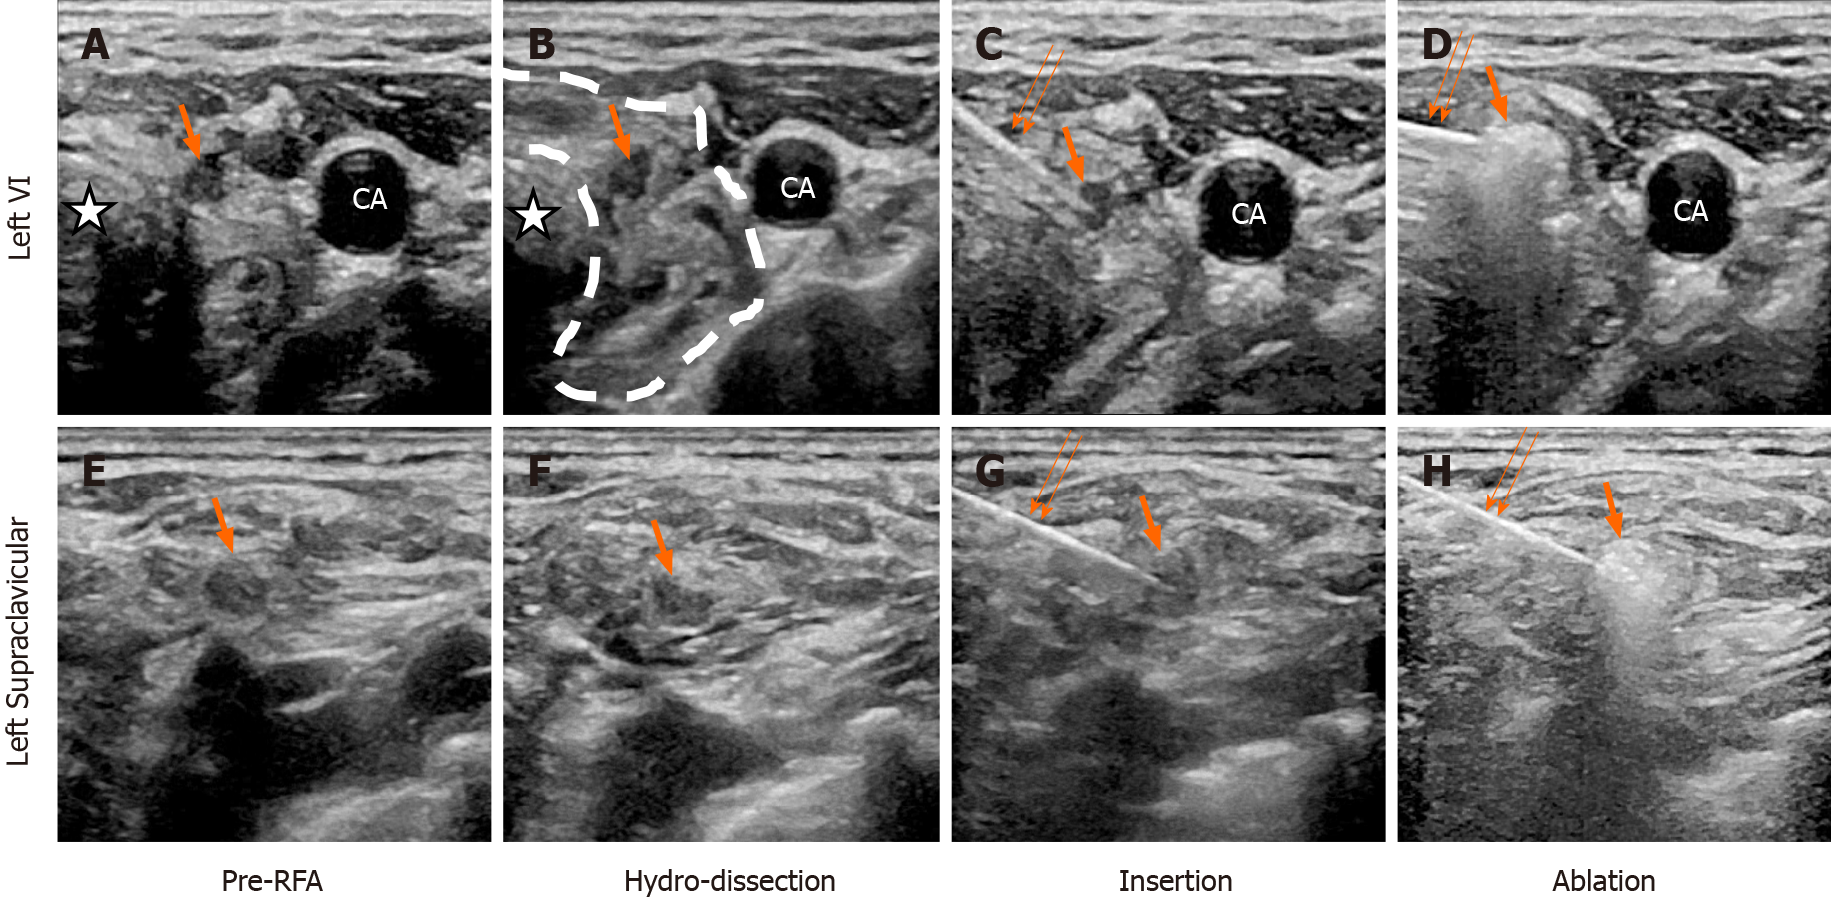
Figure 2 Ultrasound-guided radiofrequency ablation process.
A-D: Lymph nodes at left level VI; E-H: Lymph nodes at left supraclavicular fossa; A and E: Ultrasound (US) images of pre-radiofrequency ablation (RFA); B and F: US images of the hydrodissection process. Saline was injected to form an edema zone (circled by the dashed line), isolating the target ablated zones with nerves, trachea (marked with star) and skin; C and G: US images of insertion with the electrode tip; D and H: US images of the radiofrequency ablation procedure. The single arrows point to the lymph nodes of the target. The double arrows point to the RF electrode. CA: Carotid artery.
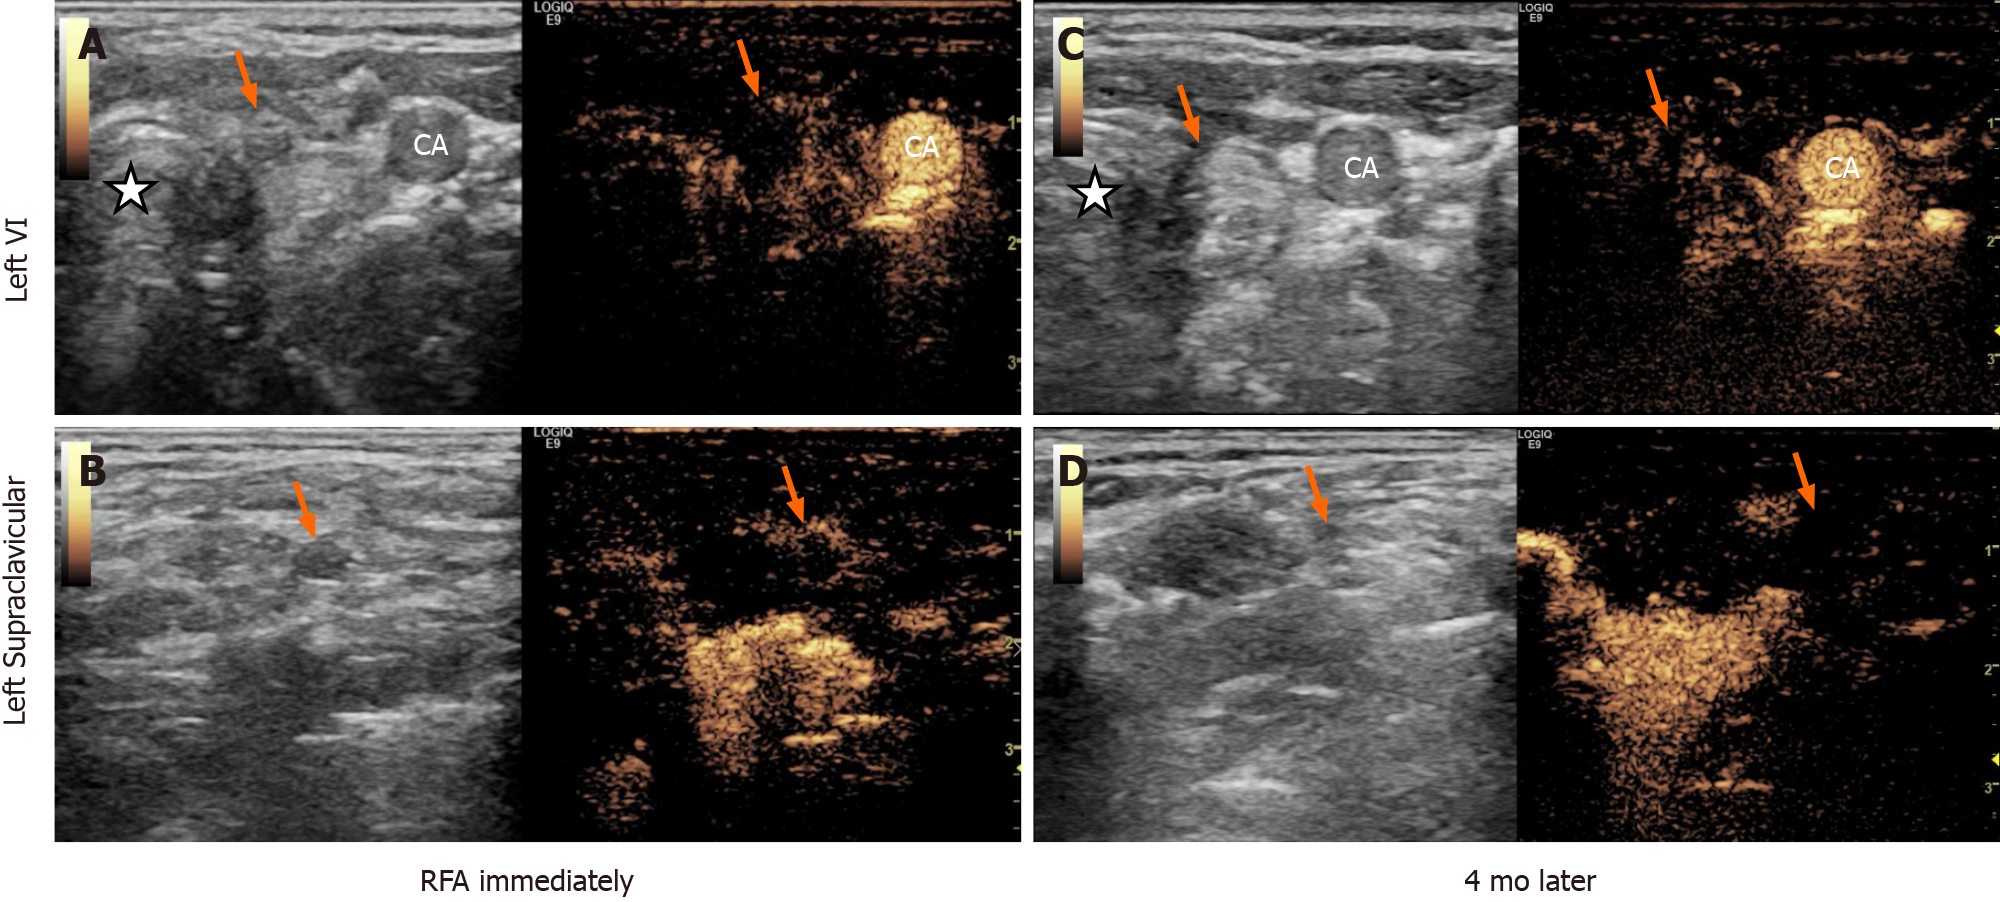
Figure 3 Images of ultrasound and contrast-enhanced ultrasound after the radiofrequency ablation.
A and B: Images captured immediately after radiofrequency ablation (RFA); C and D: Images 4 mo after RFA. The arrows point to ablated lymph nodes. Pentagram (marked with star): Trachea. CA: Carotid artery.
- Citation: Tong MY, Li HS, Che Y. Recurrent medullary thyroid carcinoma treated with percutaneous ultrasound-guided radiofrequency ablation: A case report. World J Clin Cases 2021; 9(4): 864-870
- URL: https://www.wjgnet.com/2307-8960/full/v9/i4/864.htm
- DOI: https://dx.doi.org/10.12998/wjcc.v9.i4.864


