Copyright
©The Author(s) 2021.
World J Clin Cases. Dec 26, 2021; 9(36): 11285-11299
Published online Dec 26, 2021. doi: 10.12998/wjcc.v9.i36.11285
Published online Dec 26, 2021. doi: 10.12998/wjcc.v9.i36.11285
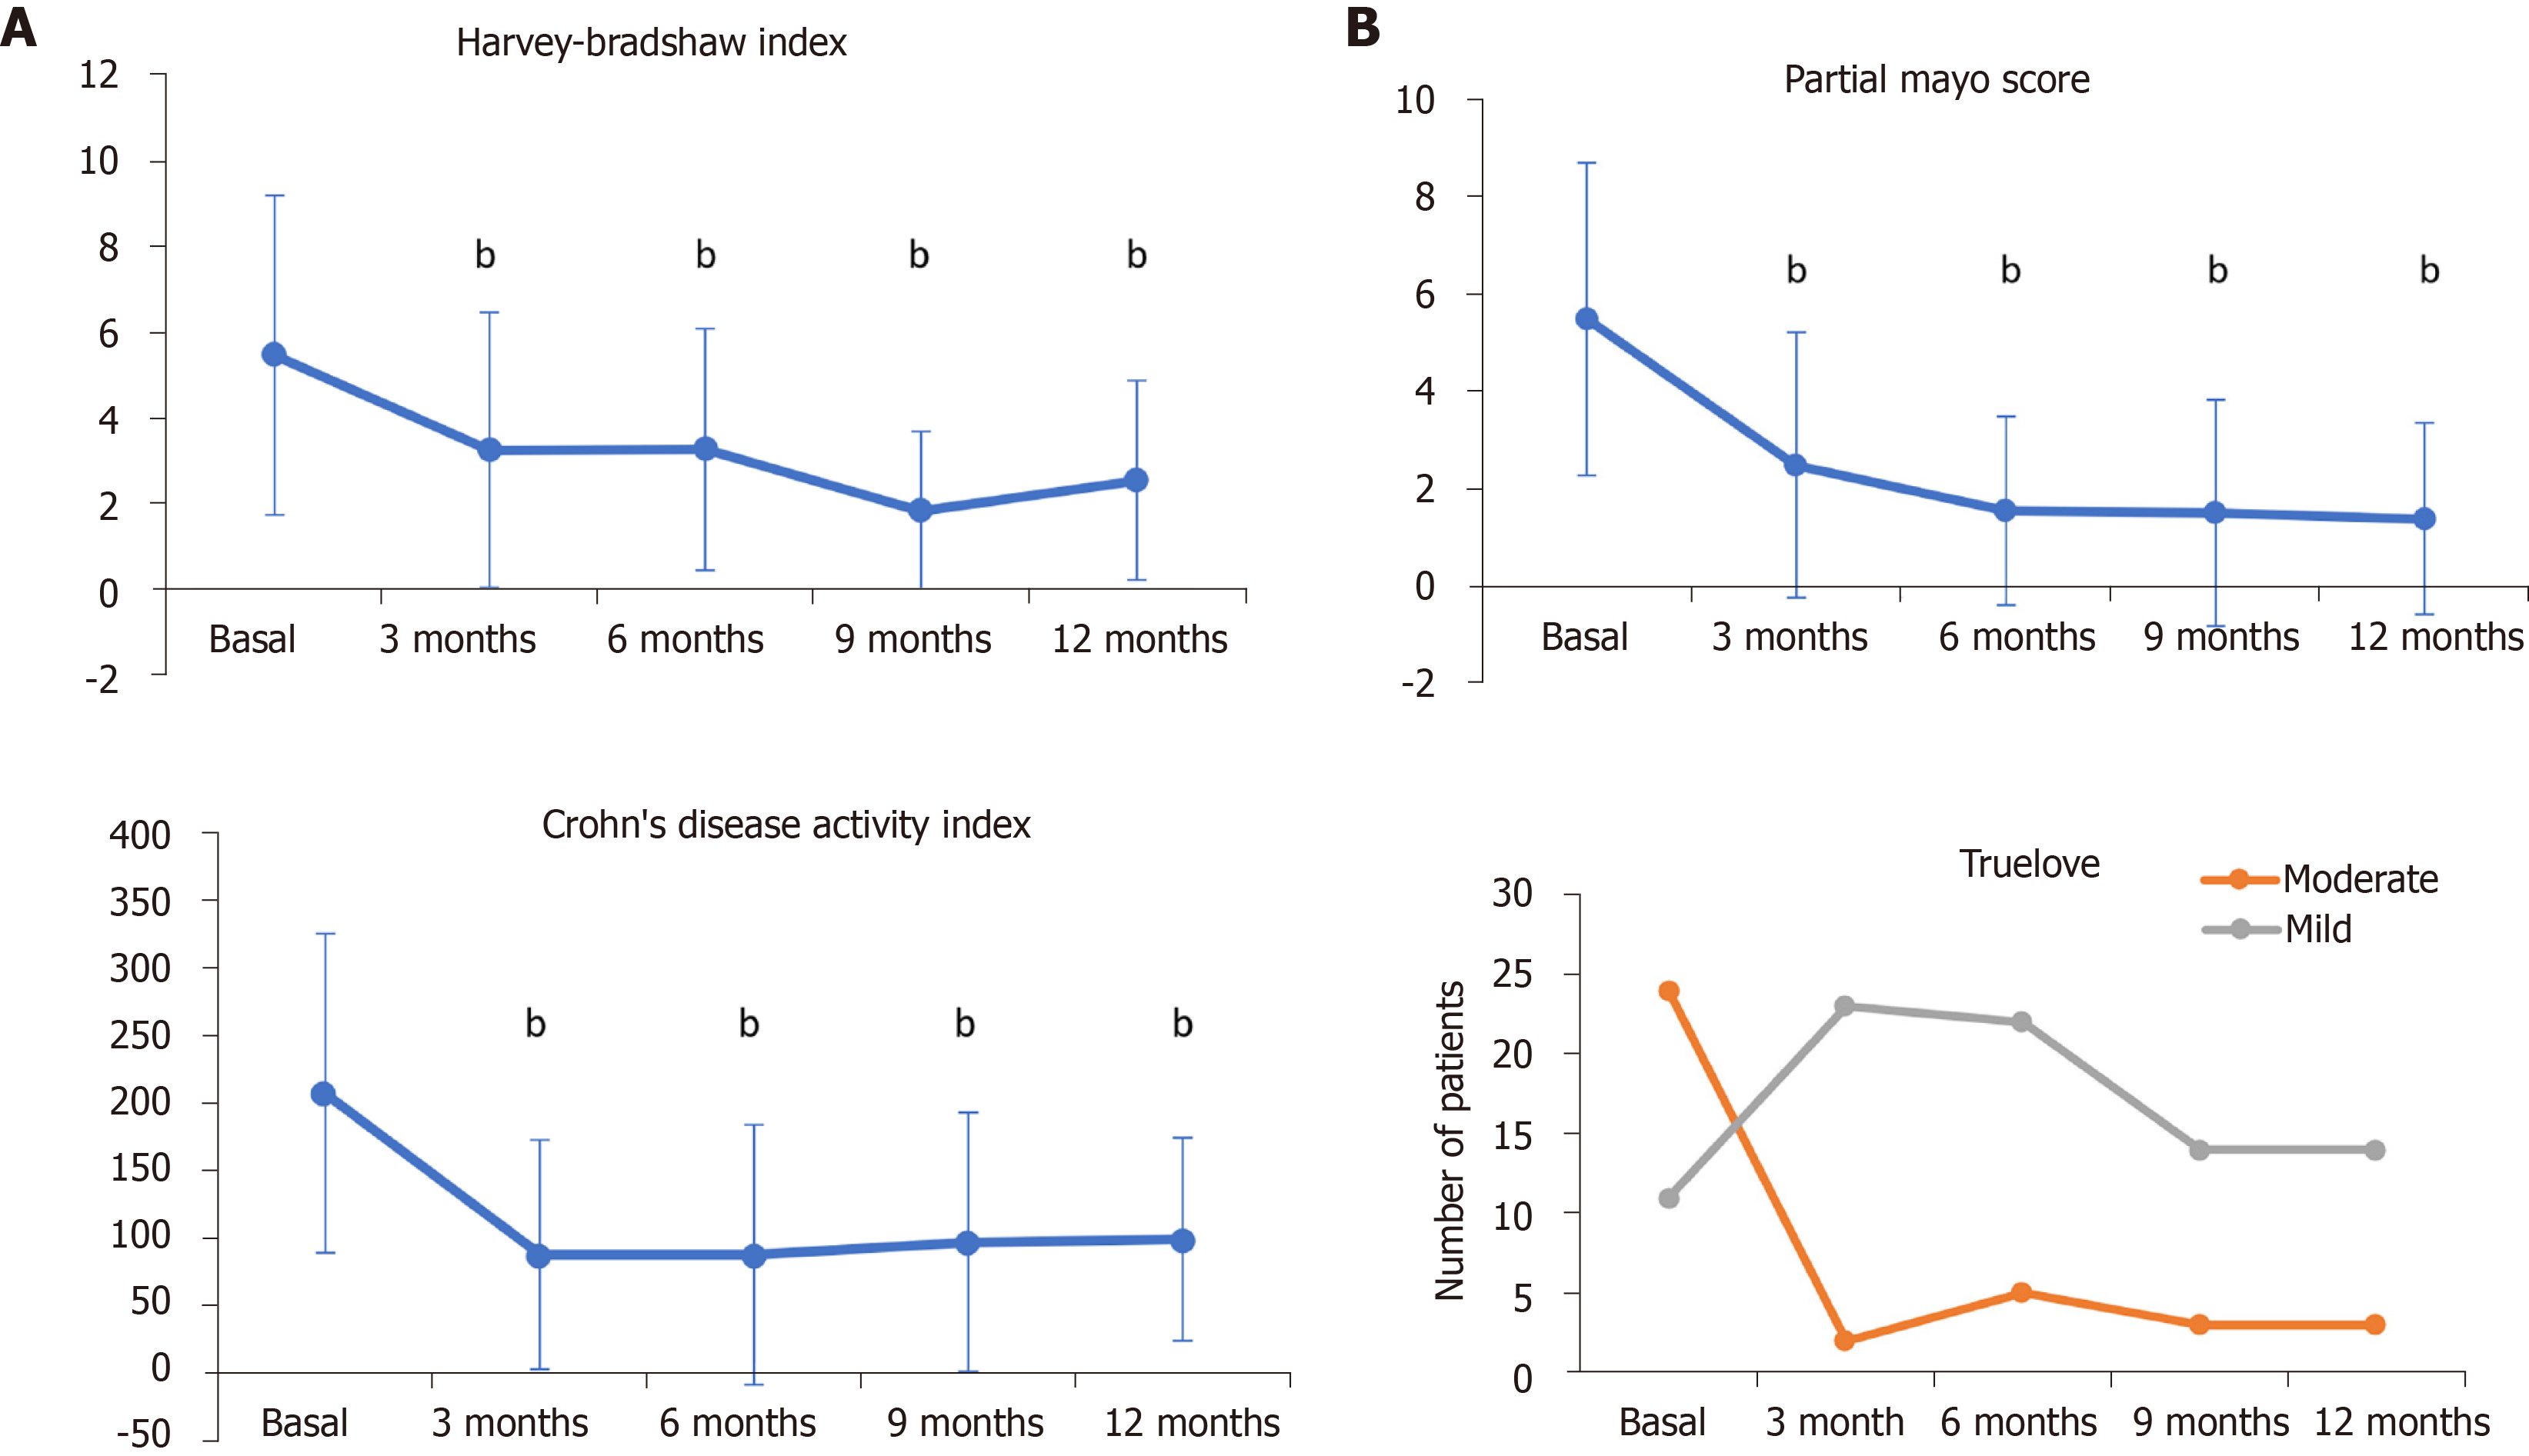
Figure 1 Crohn’s disease (A) and ulcerative colitis (B) indices after 3, 6, 9, and 12 mo of CT-P13 treatment.
Error bars indicate SD. bP < 0.001 vs baseline conditions.
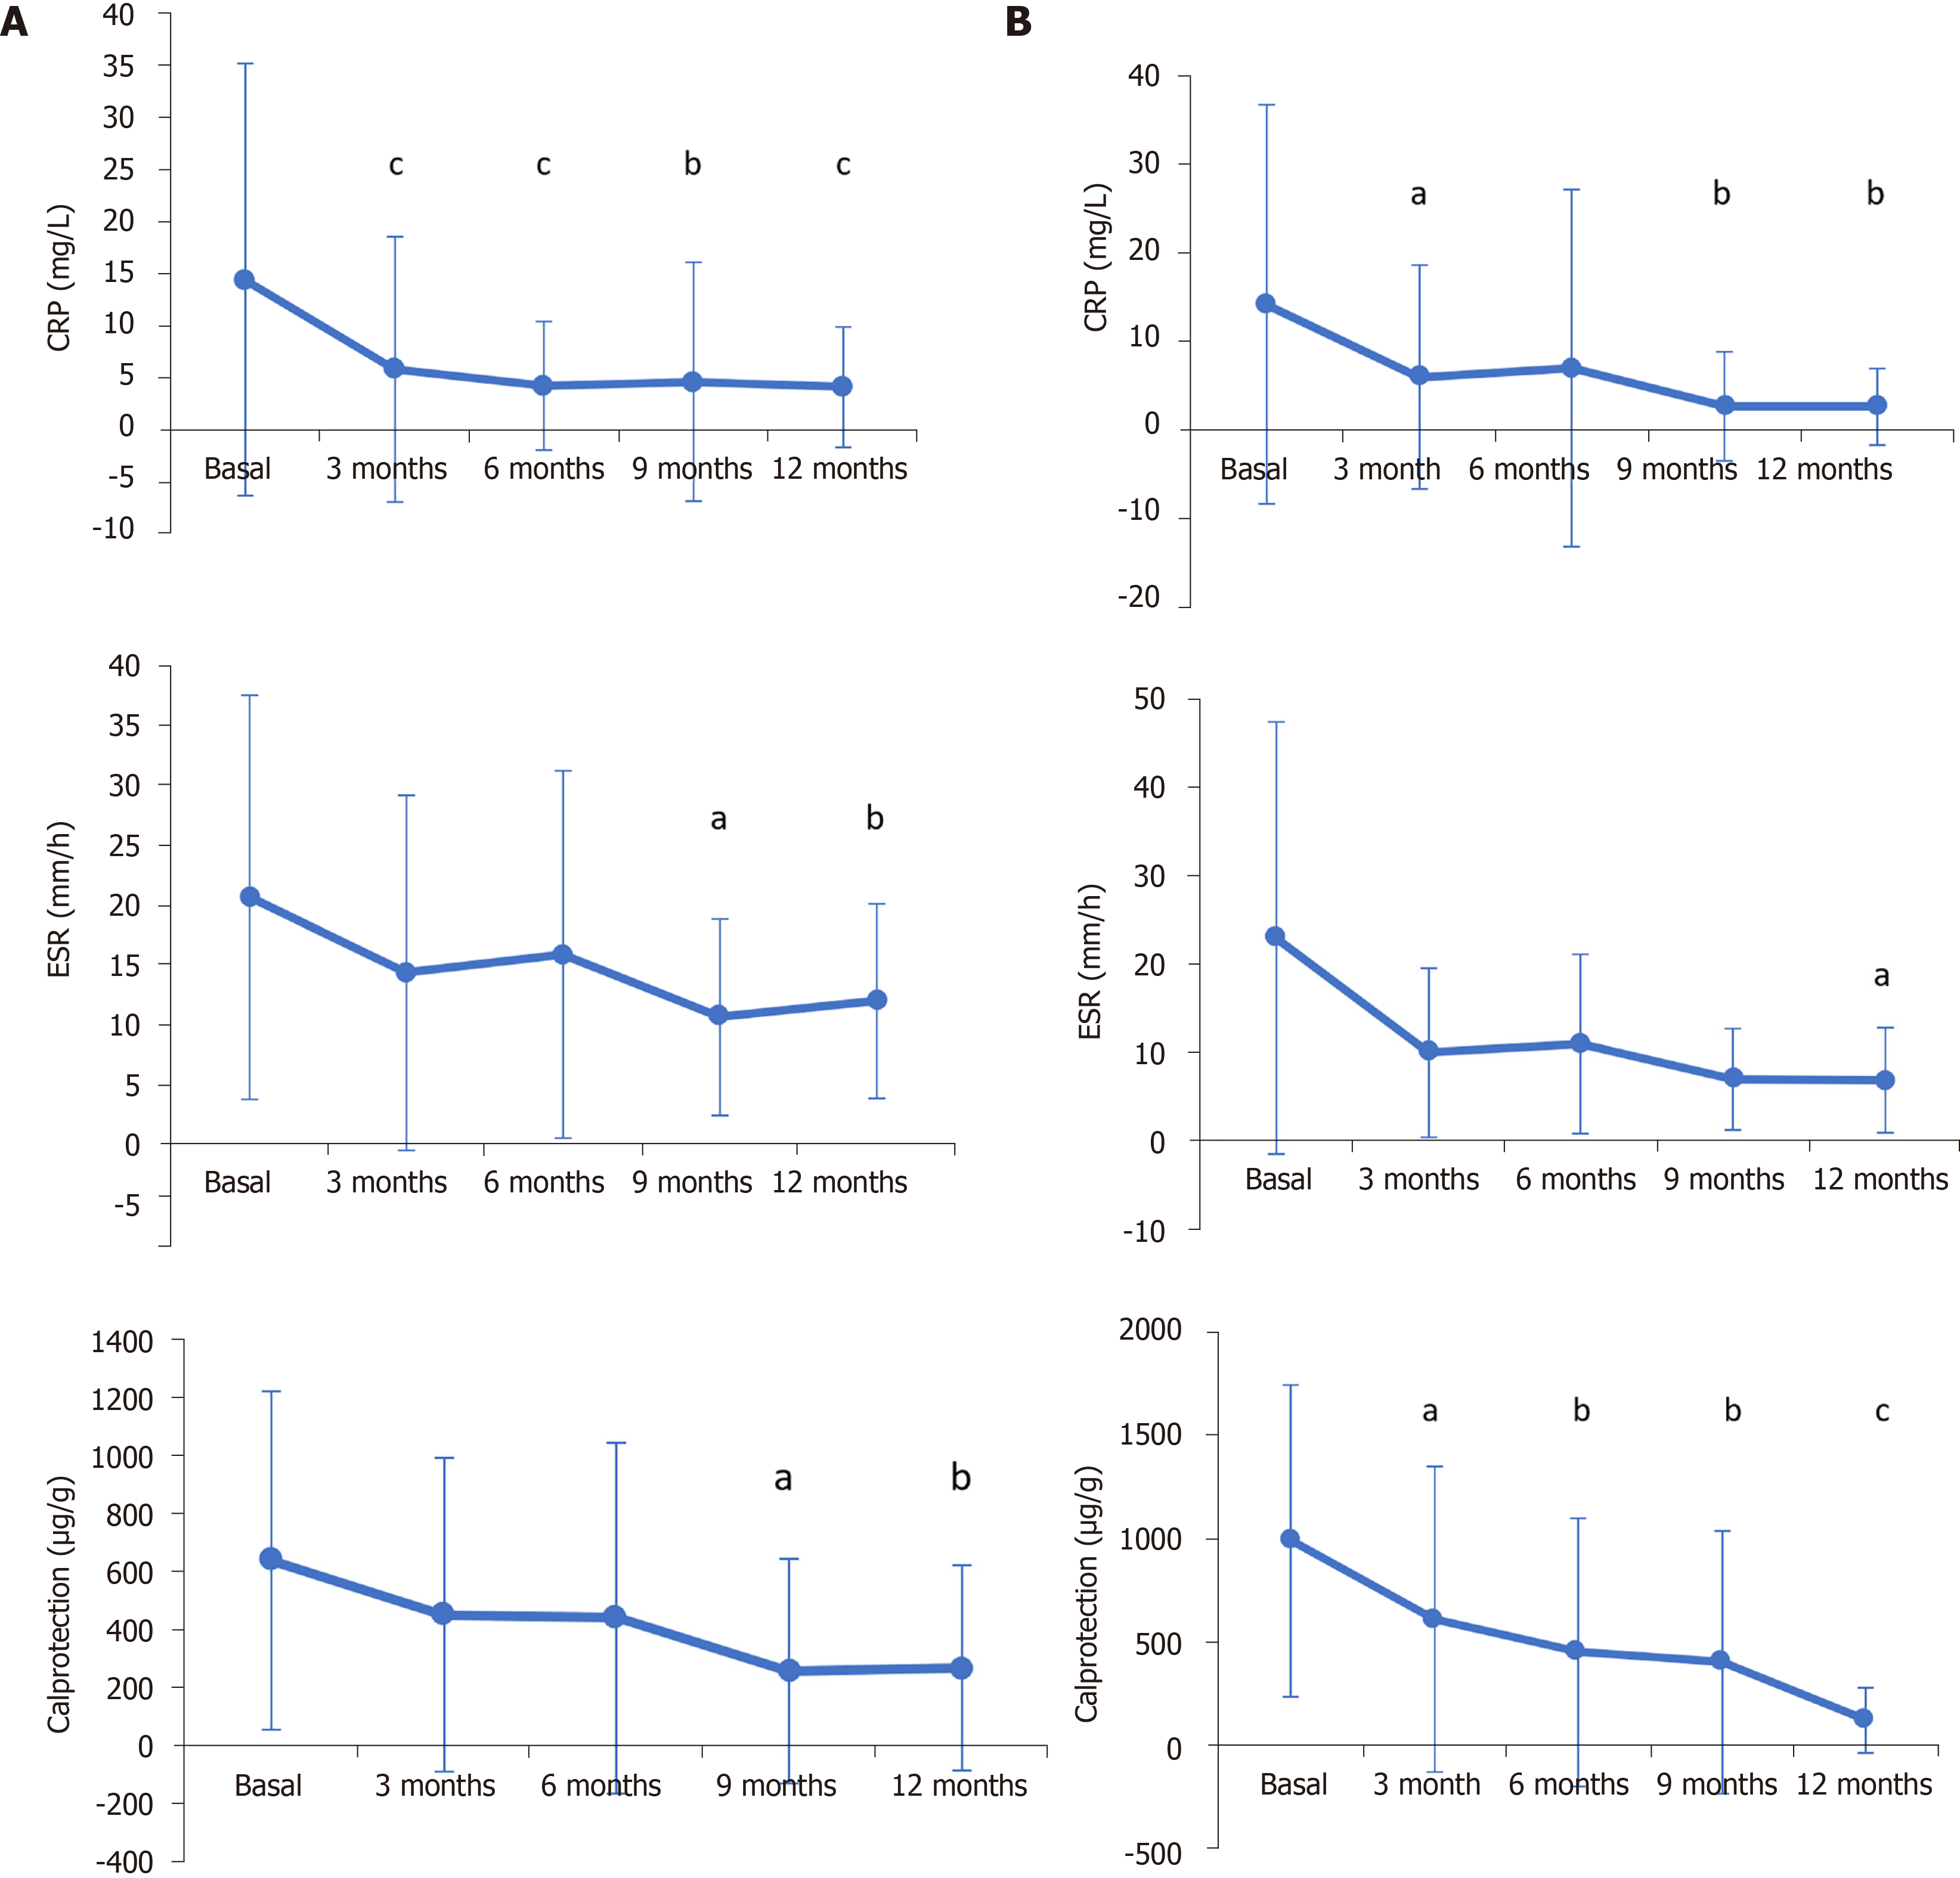
Figure 2 General inflammatory blood biomarkers.
C-reactive protein levels, erythrocyte sedimentation rate, and fecal calprotectin levels were measured at baseline and after 3, 6, 9, and 12 mo of CT-P13 treatment in patients with Crohn’s disease (A) and ulcerative colitis (B). Error bars indicate SD. aP < 0.05 vs baseline conditions; bP < 0.01 vs baseline conditions; cP < 0.001 vs baseline conditions.
- Citation: Huguet JM, Cortés X, Bosca-Watts MM, Aguas M, Maroto N, Martí L, Amorós C, Paredes JM. Real-world data on the infliximab biosimilar CT-P13 (Remsima®) in inflammatory bowel disease. World J Clin Cases 2021; 9(36): 11285-11299
- URL: https://www.wjgnet.com/2307-8960/full/v9/i36/11285.htm
- DOI: https://dx.doi.org/10.12998/wjcc.v9.i36.11285


