Copyright
©The Author(s) 2021.
World J Clin Cases. Dec 26, 2021; 9(36): 11193-11207
Published online Dec 26, 2021. doi: 10.12998/wjcc.v9.i36.11193
Published online Dec 26, 2021. doi: 10.12998/wjcc.v9.i36.11193
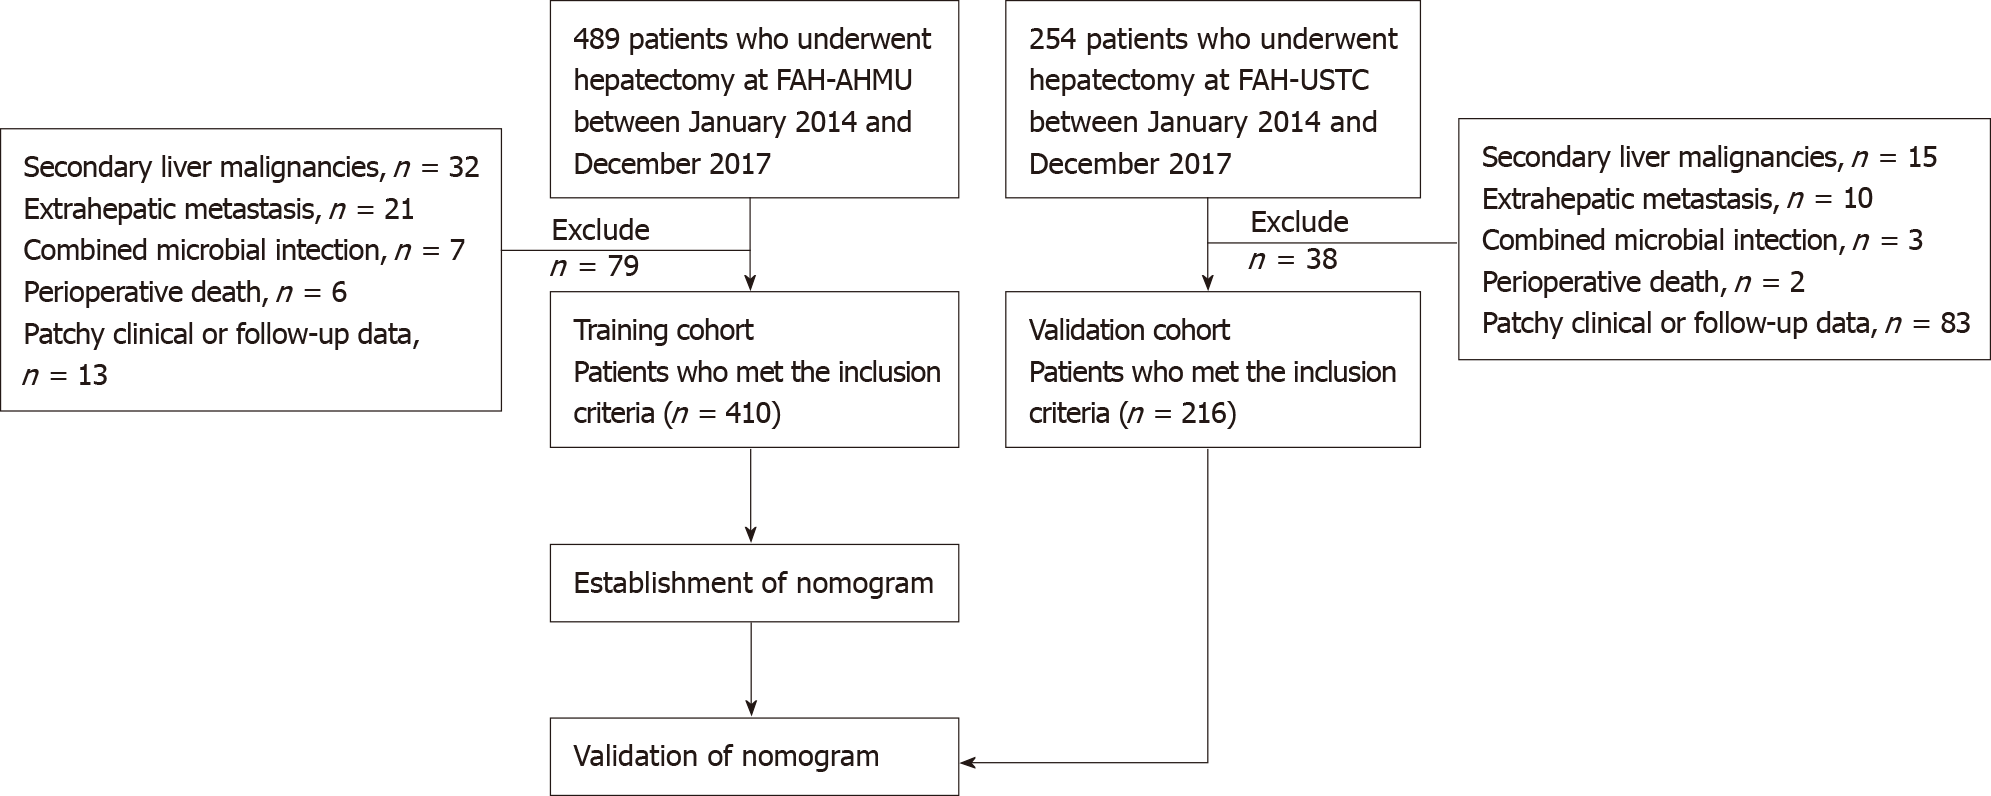
Figure 1
The flowchart of the study cohort.
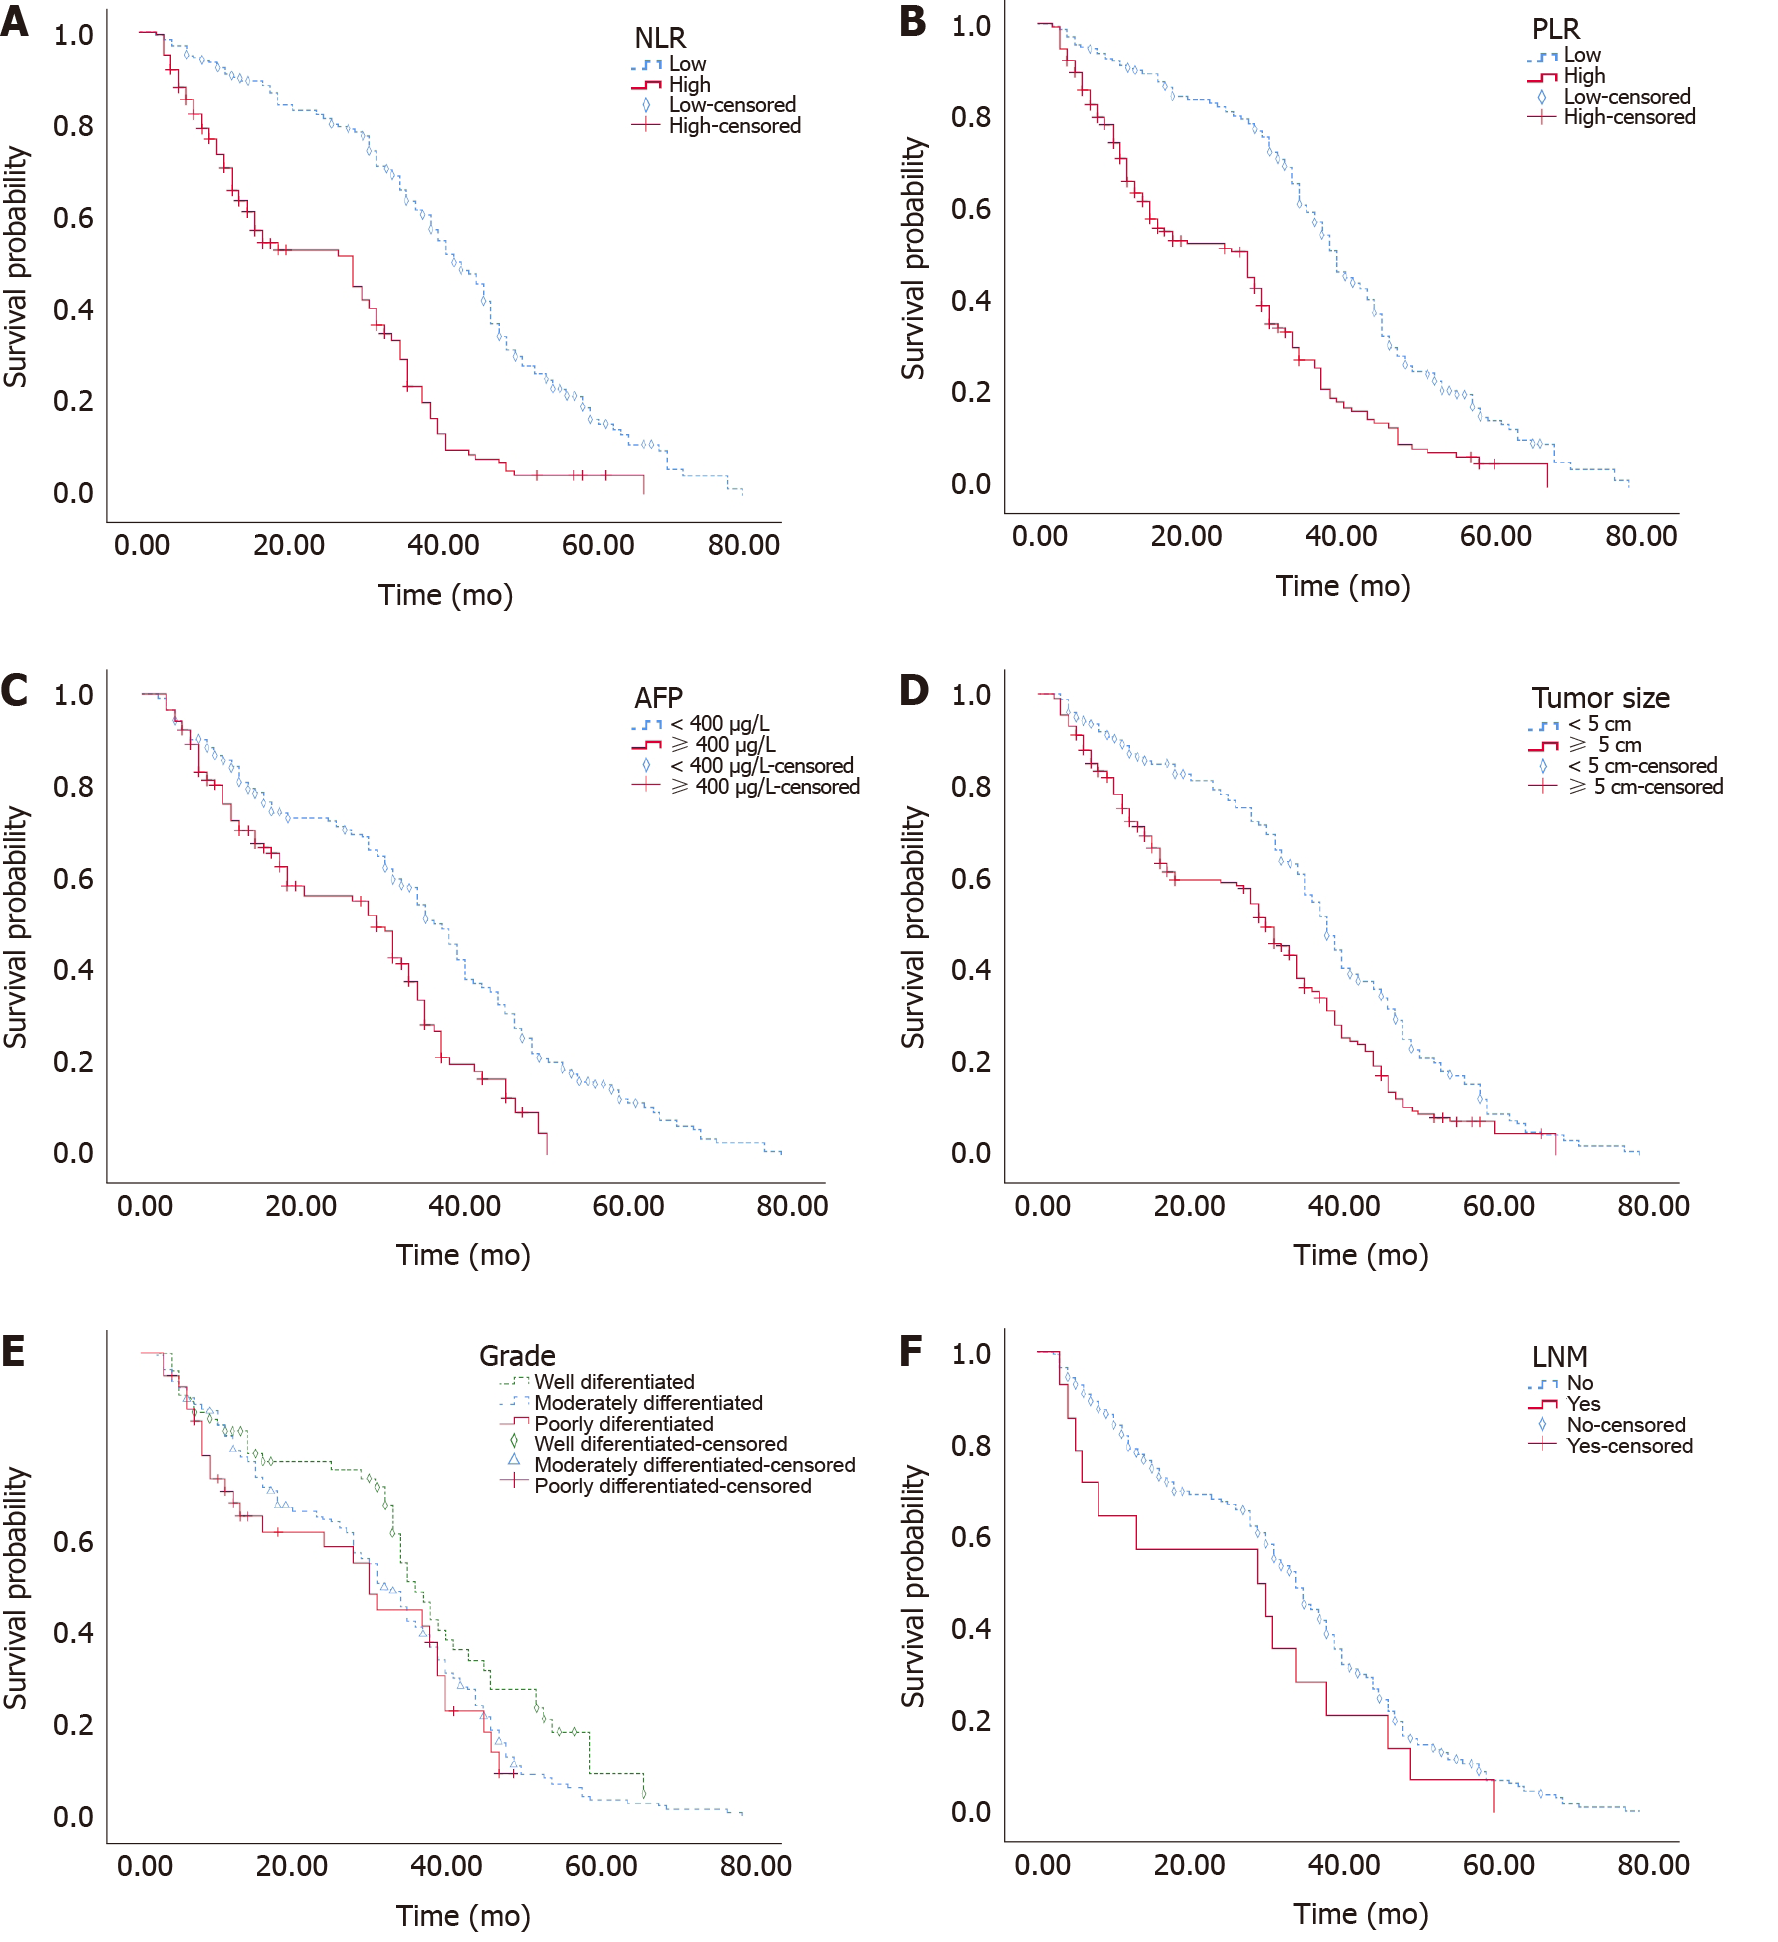
Figure 2 Kaplan–Meier survival curves of predictor stratification for overall survival in the training cohort.
Median overall survival (stratification, months): neutrophil-to-lymphocyte ratio (low, 42; high, 28), platelet-to-lymphocyte ratio (low, 40; high, 28), α-fetoprotein (< 400 μg/L, 37; ≥ 400 μg/L, 29), tumour size (< 5 cm, 38; ≥ 5 cm, 30), grade (well, 36; moderate, 32; poor, 30), and lymph node metastasis (no, 34; yes, 29). NLR: Neutrophil-to-lymphocyte ratio; PLR: Platelet-to-lymphocyte ratio; AFP: Alpha-fetoprotein; LNM: Lymph node metastasis.
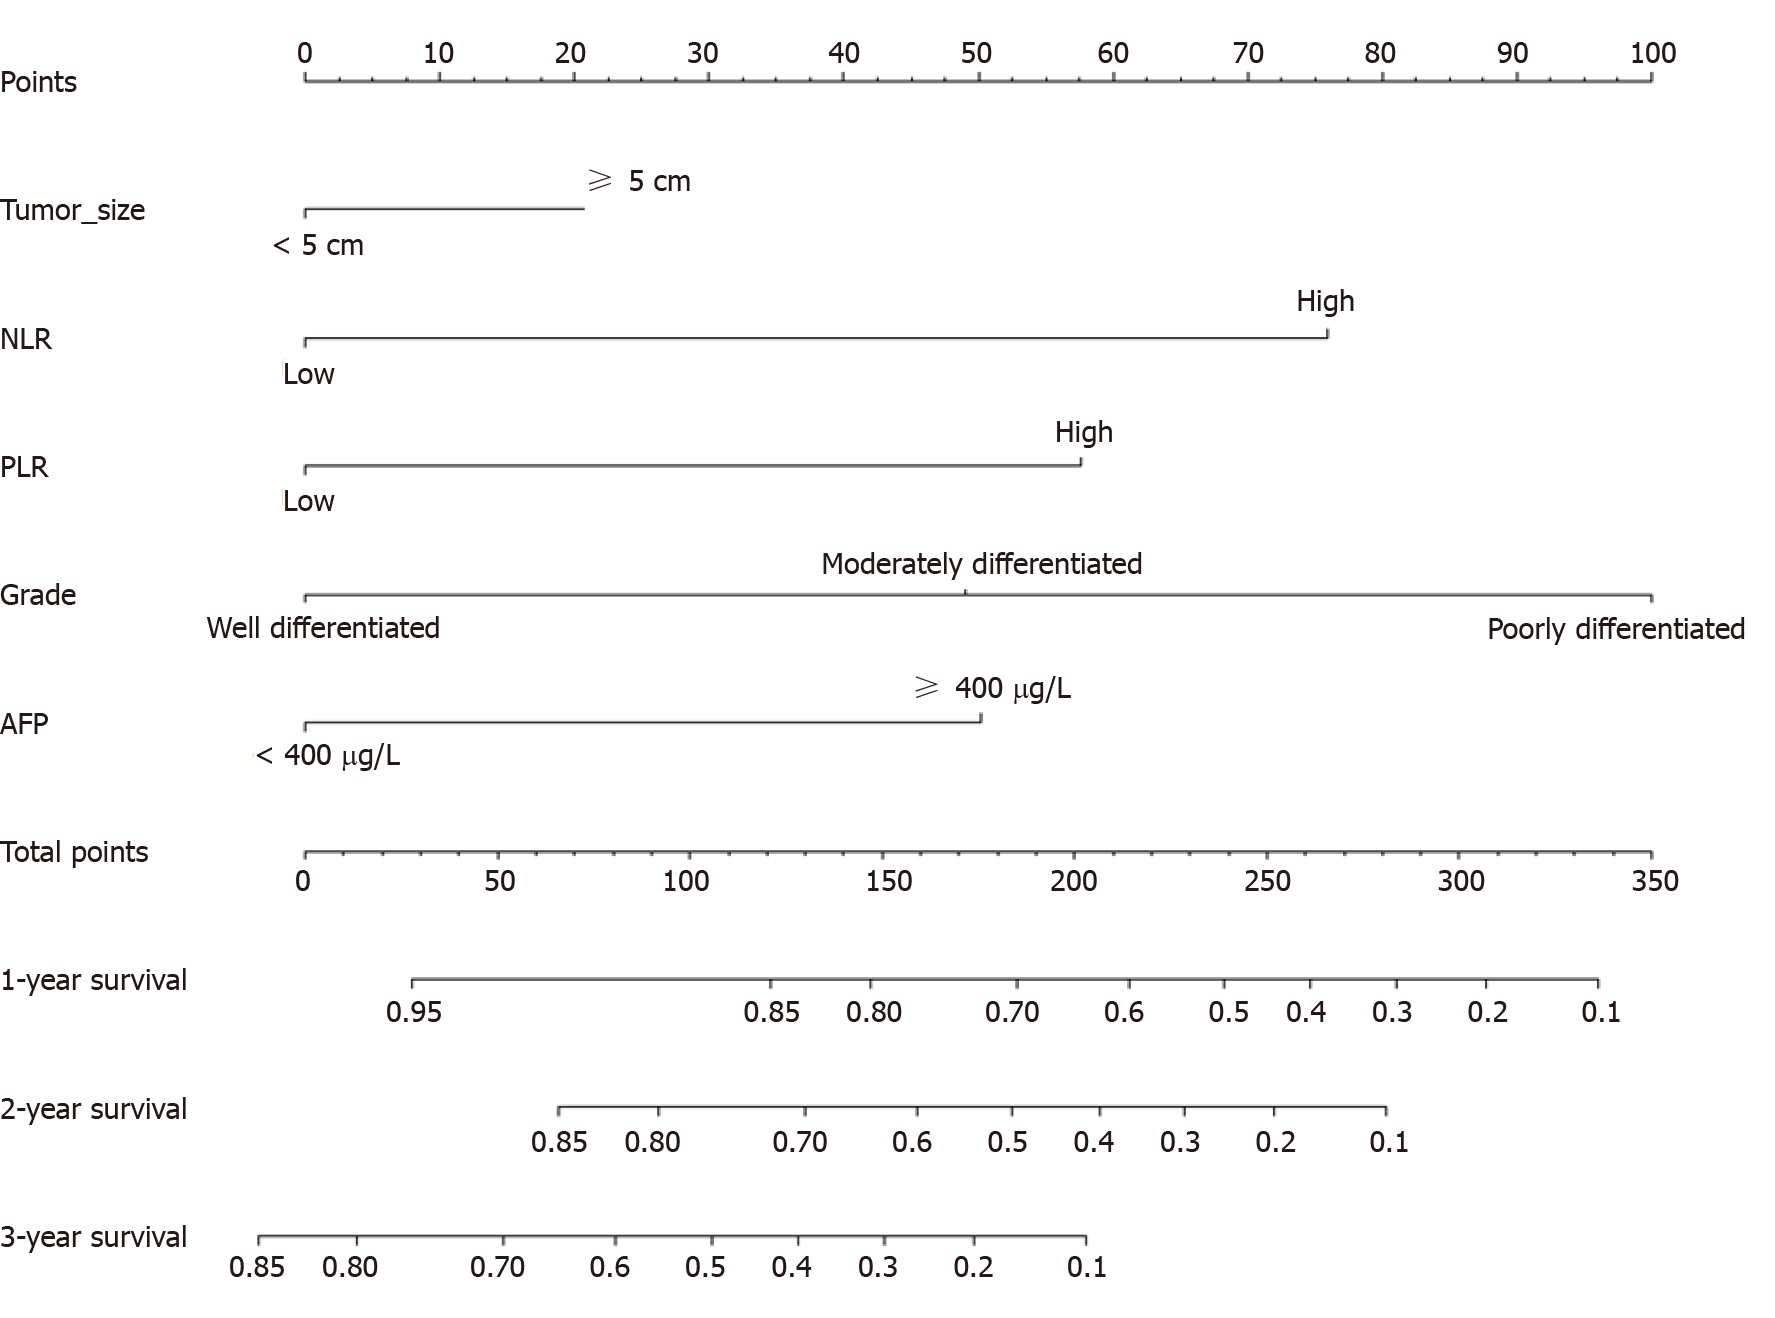
Figure 3 Nomogram for predicting OS in the training cohort.
NLR: Neutrophil-to-lymphocyte ratio; PLR: Platelet-to-lymphocyte ratio; AFP: Alpha-fetoprotein; OS: Overall survival.
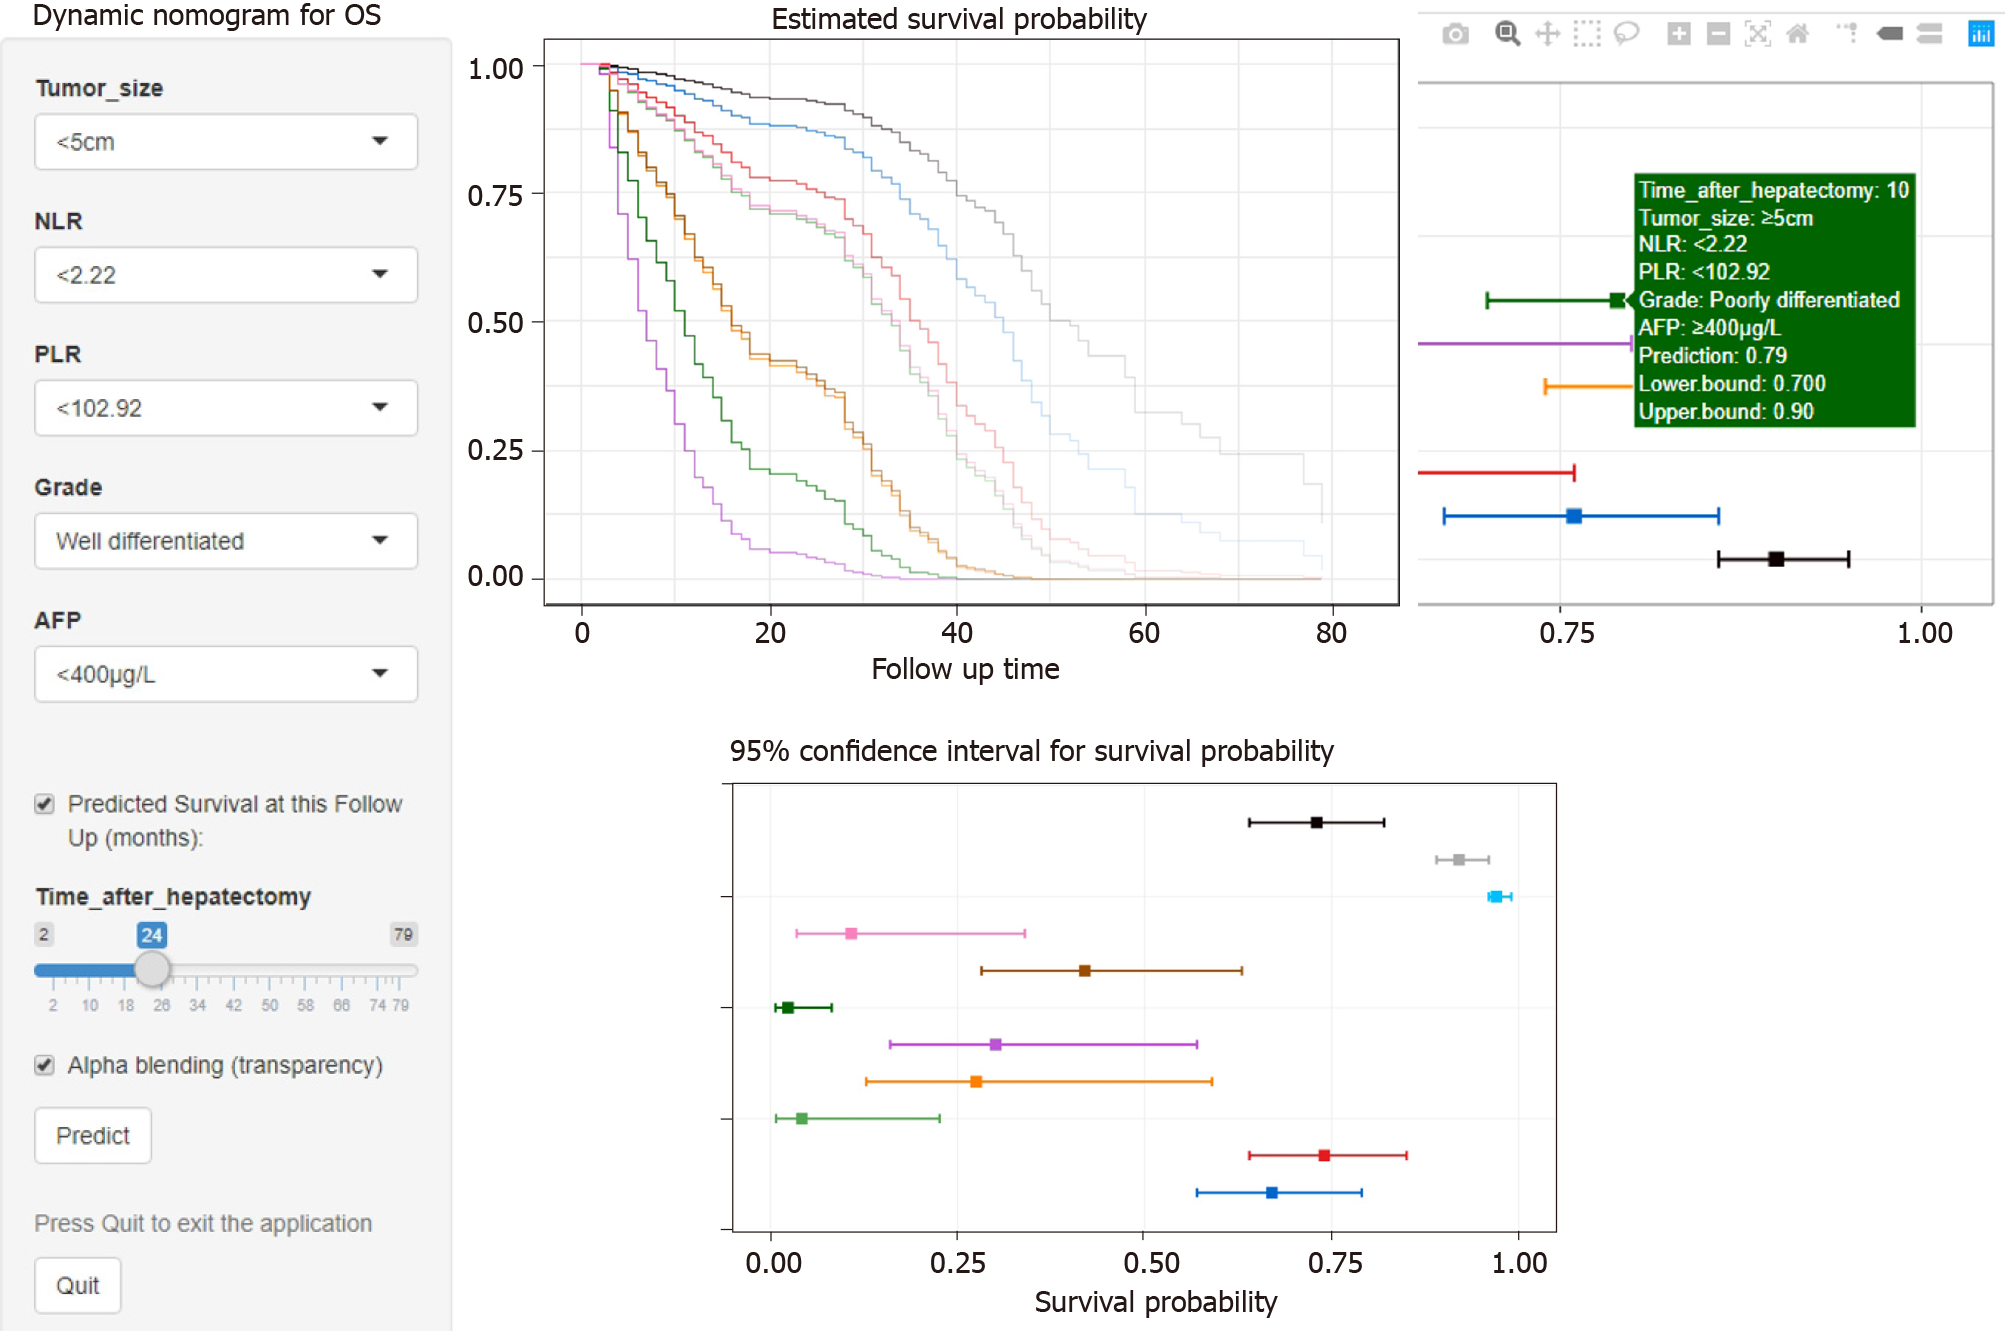
Figure 4 Screenshot of the online dynamic calculator to predict OS of hepatocellular carcinoma patients after hepatectomy.
NLR: Neutrophil-to-lymphocyte ratio; PLR: Platelet-to-lymphocyte ratio; AFP: Alpha-fetoprotein; OS: Overall survival.
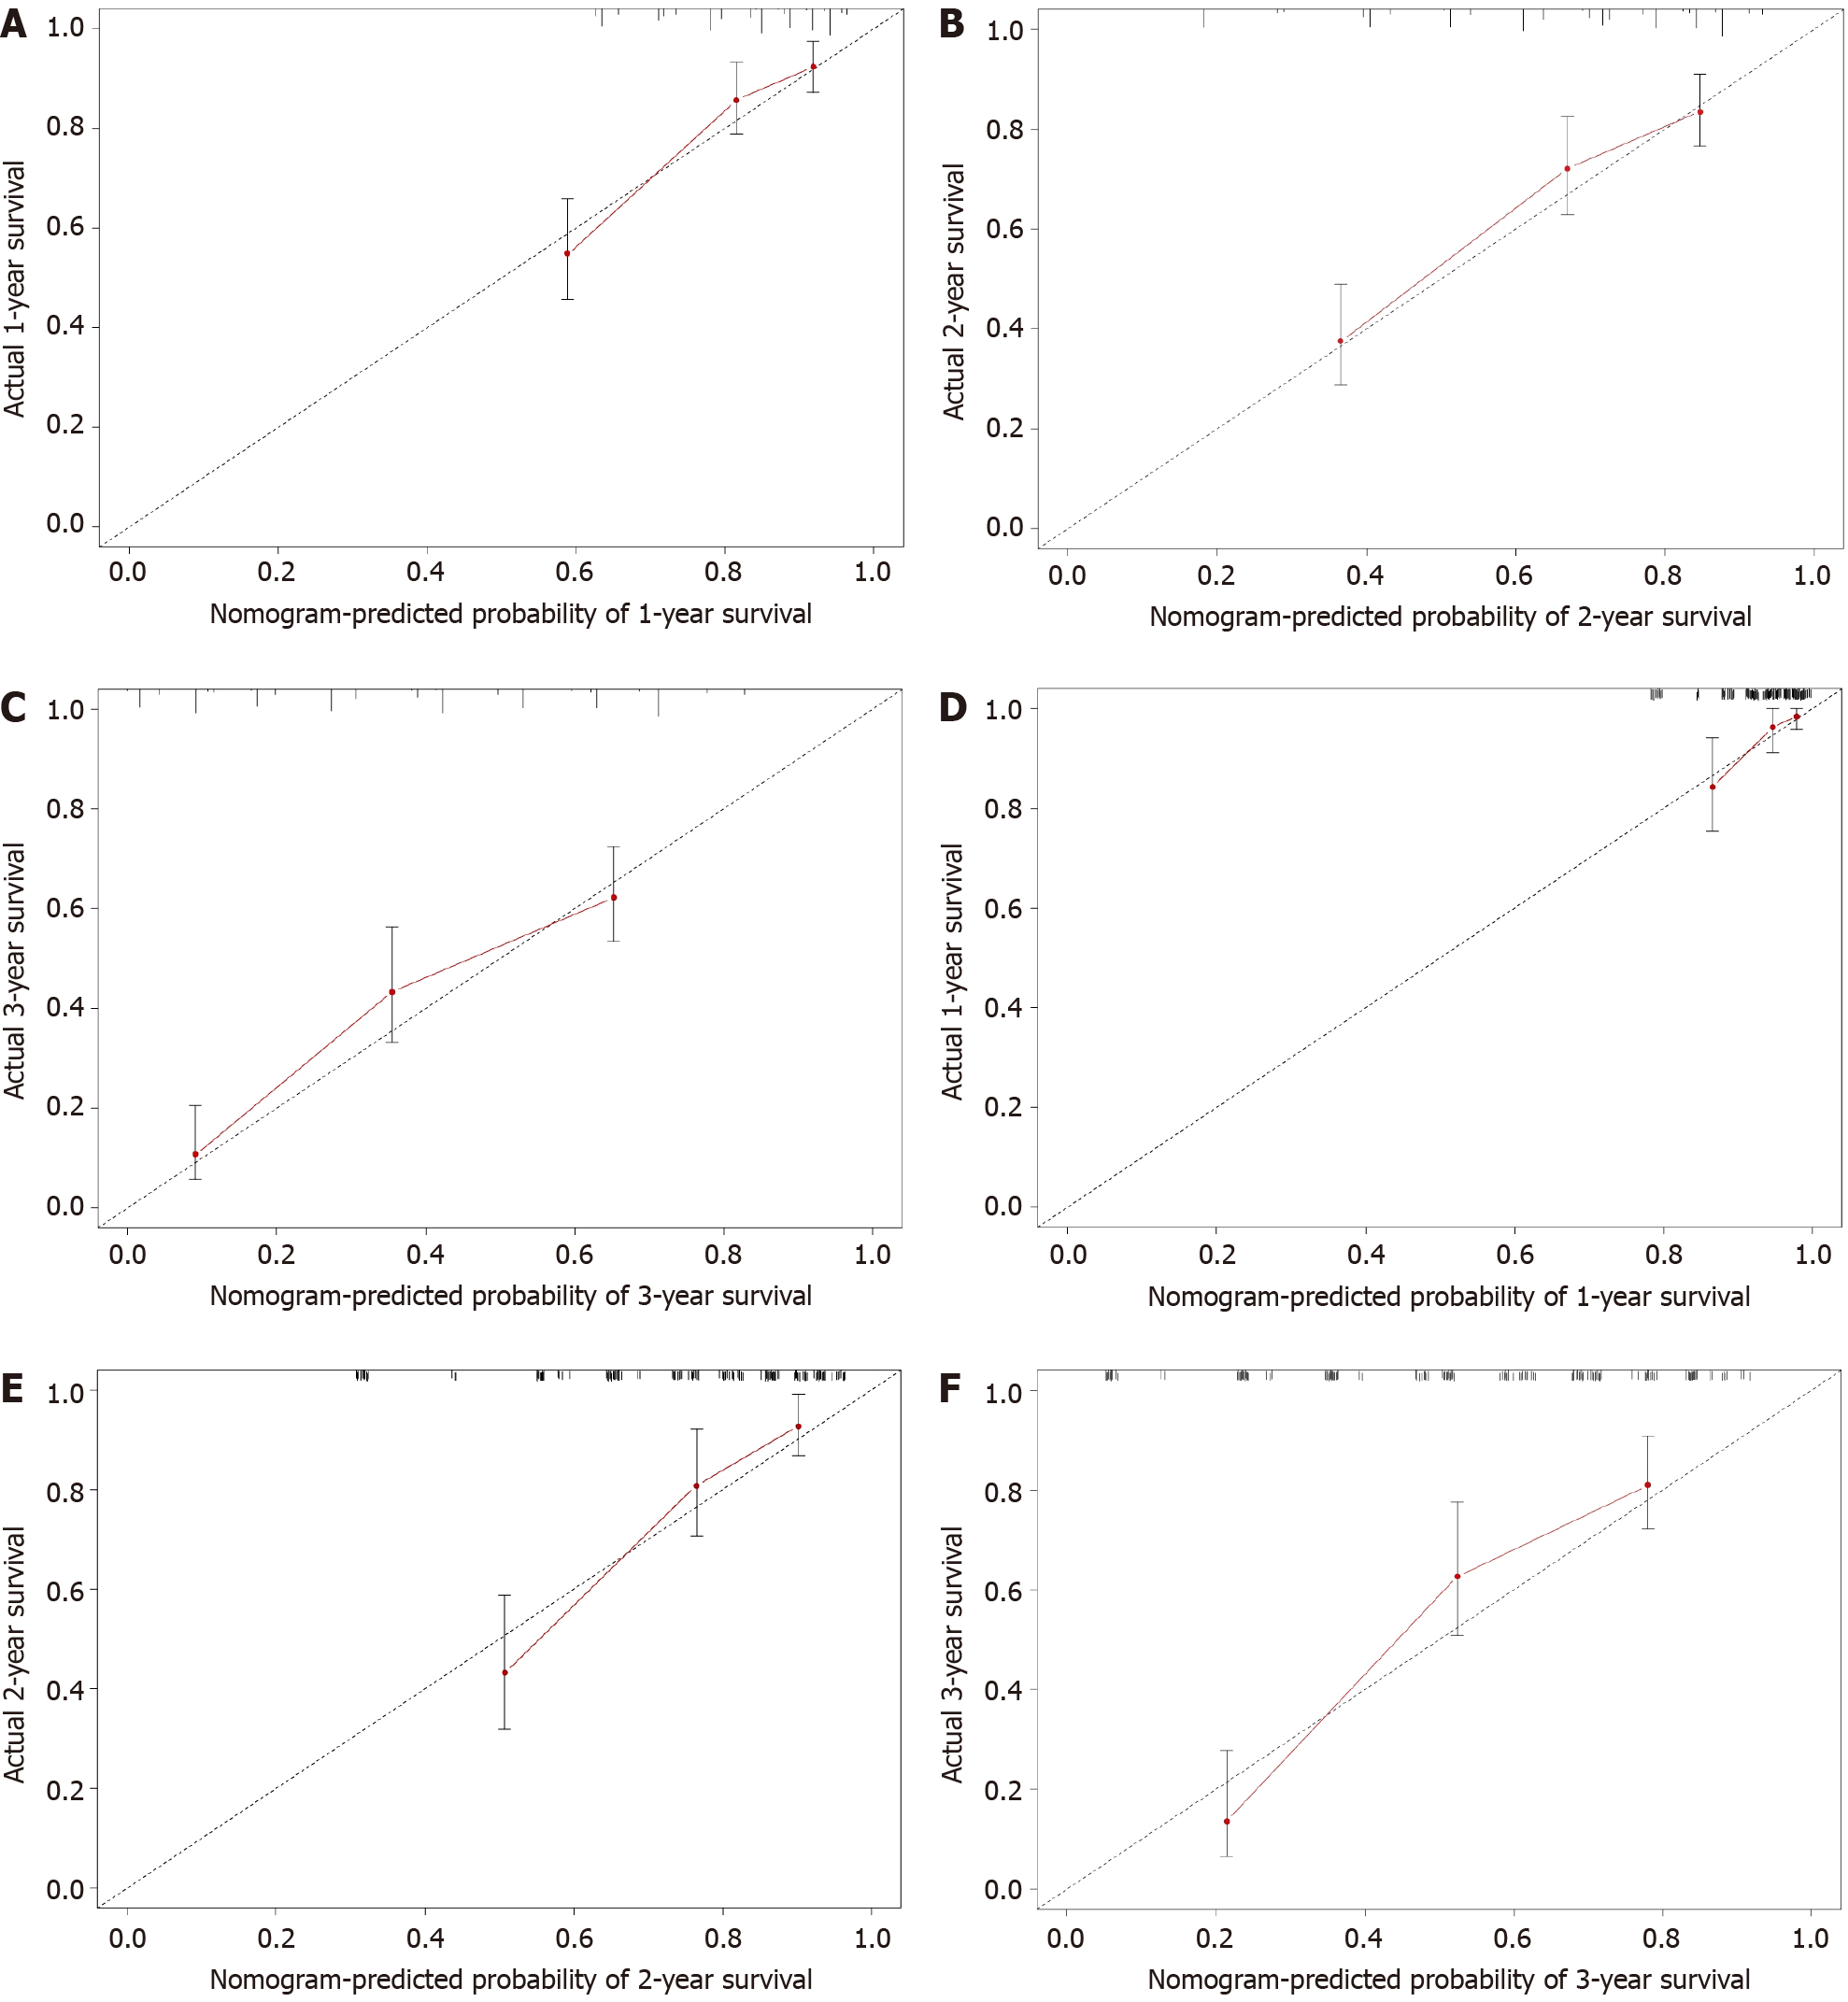
Figure 5
Calibration curves for predicting 1-, 2- and 3-year overall survival in the training cohort (A–C) and validation cohort (D–F).
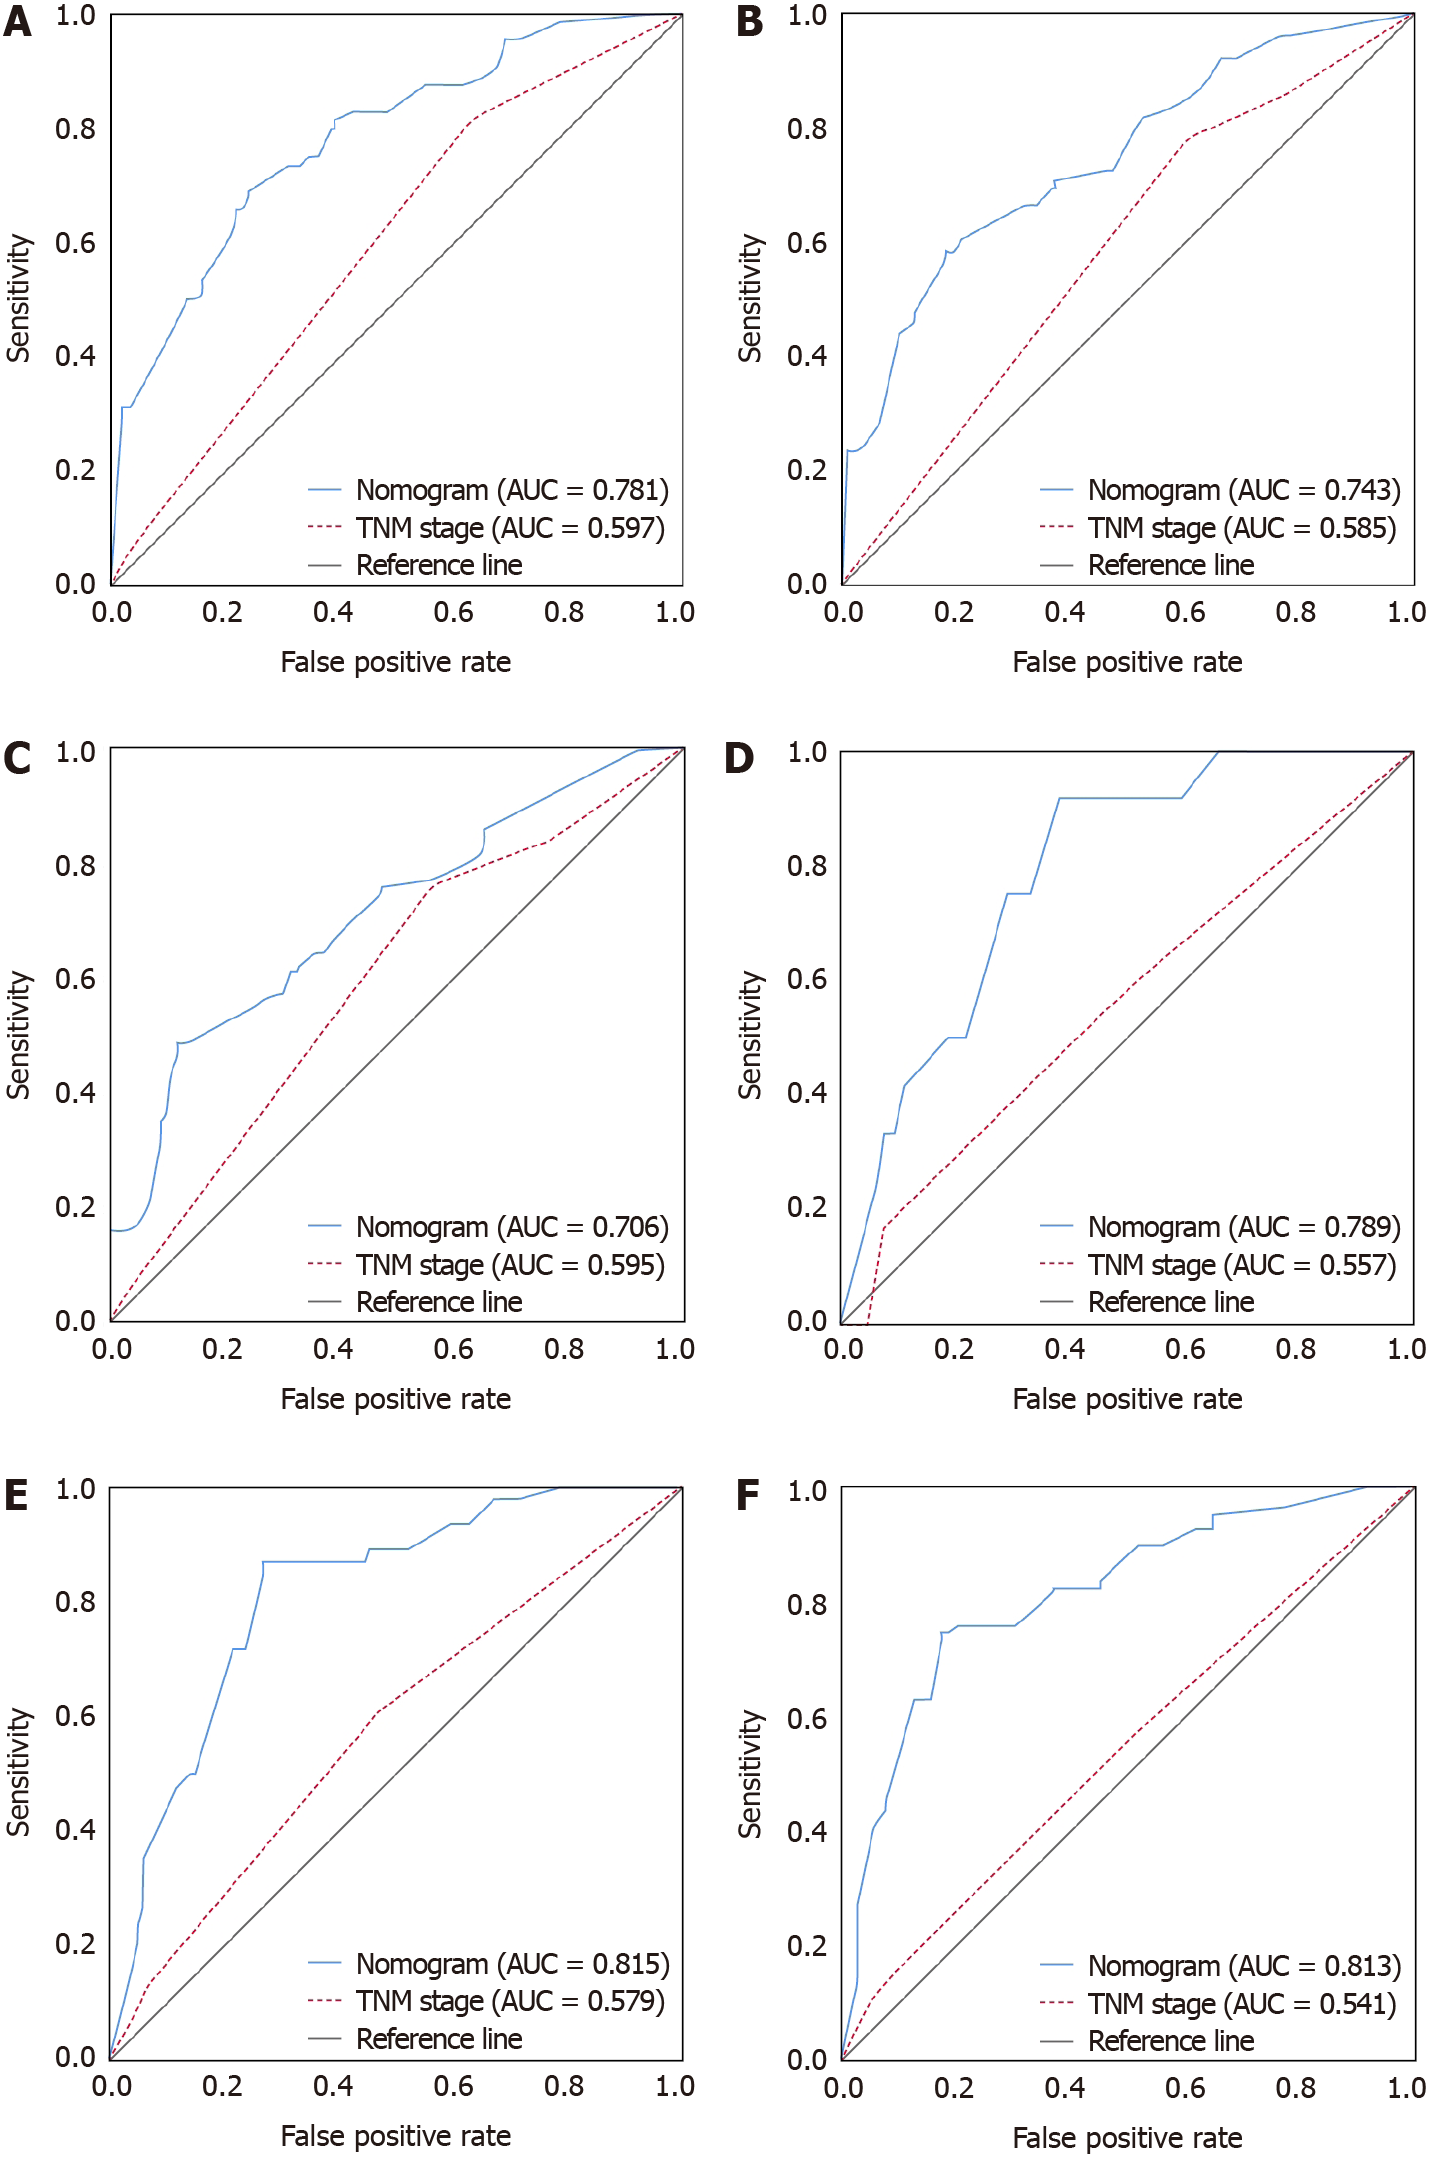
Figure 6
Receiver operating characteristic curves for predicting 1-, 2- and 3-year overall survival in the training cohort (A–C) and validation cohort (D–F).
- Citation: Pu T, Li ZH, Jiang D, Chen JM, Guo Q, Cai M, Chen ZX, Xie K, Zhao YJ, Liu FB. Nomogram based on inflammation-related markers for predicting survival of patients undergoing hepatectomy for hepatocellular carcinoma. World J Clin Cases 2021; 9(36): 11193-11207
- URL: https://www.wjgnet.com/2307-8960/full/v9/i36/11193.htm
- DOI: https://dx.doi.org/10.12998/wjcc.v9.i36.11193


