Copyright
©The Author(s) 2021.
World J Clin Cases. Dec 16, 2021; 9(35): 10871-10883
Published online Dec 16, 2021. doi: 10.12998/wjcc.v9.i35.10871
Published online Dec 16, 2021. doi: 10.12998/wjcc.v9.i35.10871
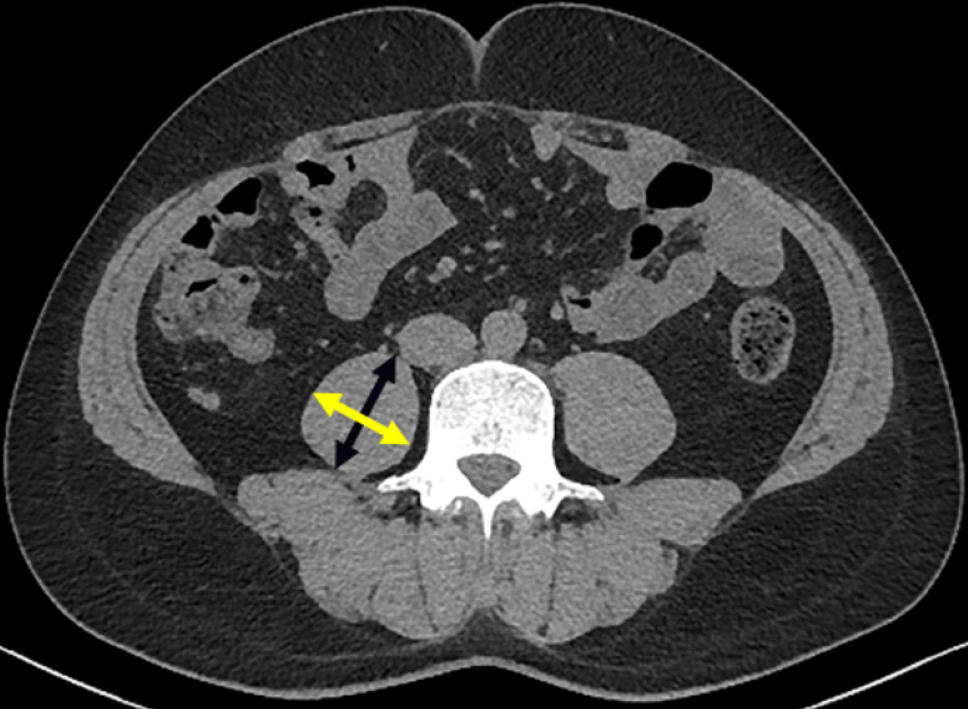
Figure 1 Measurement of psoas muscle thickness/height at the level of the umbilicus on a computed tomography scan image.
Psoas muscle thickness corresponds to the diameter of transversal psoas muscle (yellow arrow) perpendicular to the axial diameter (black arrow).
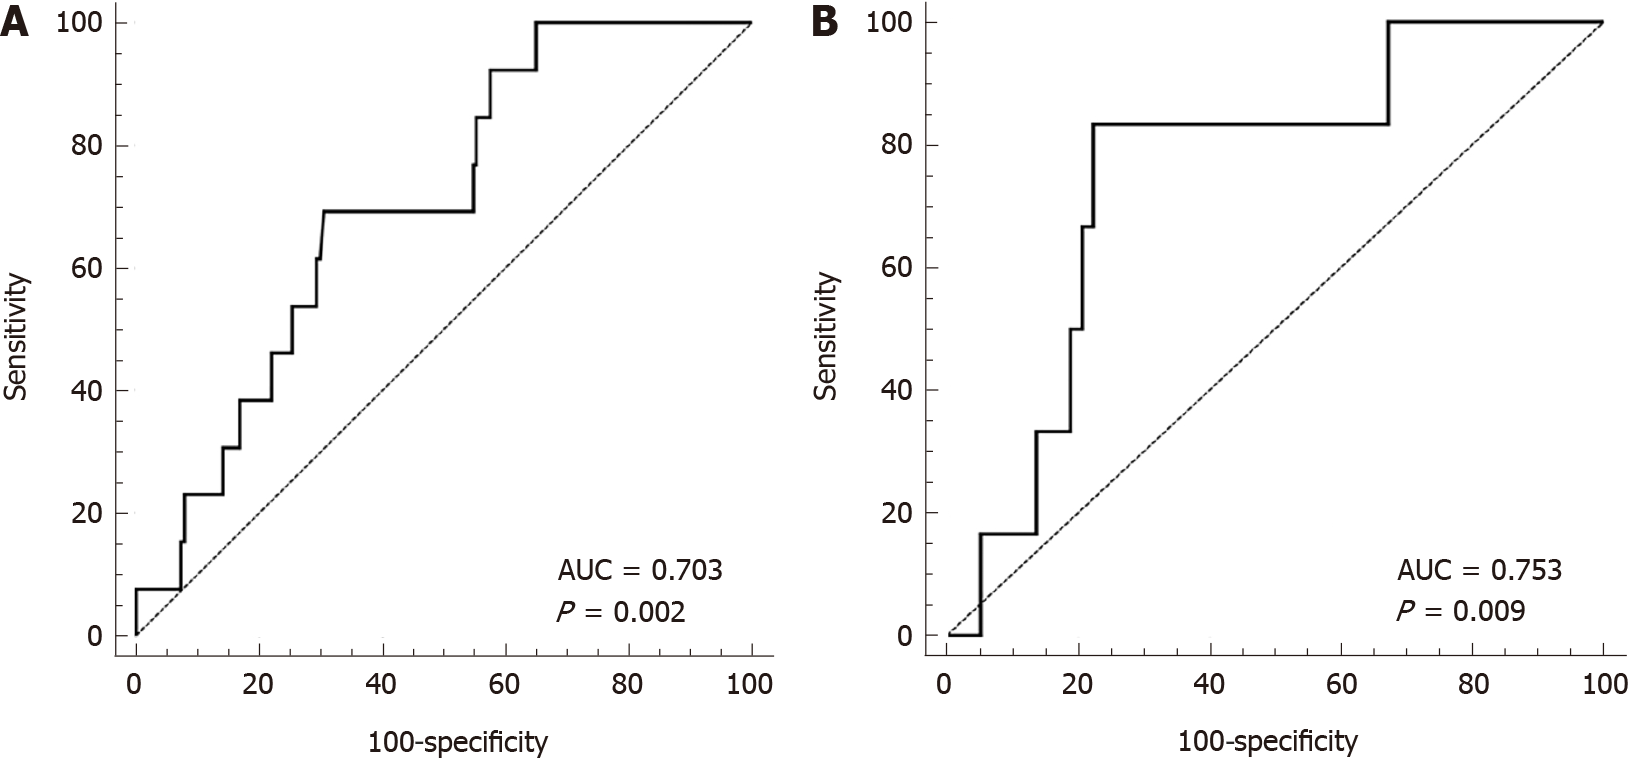
Figure 2 Receiver operating characteristic curves.
A: Male death-risk prediction model; B: Female death-risk prediction model. AUC: Area under the curve.
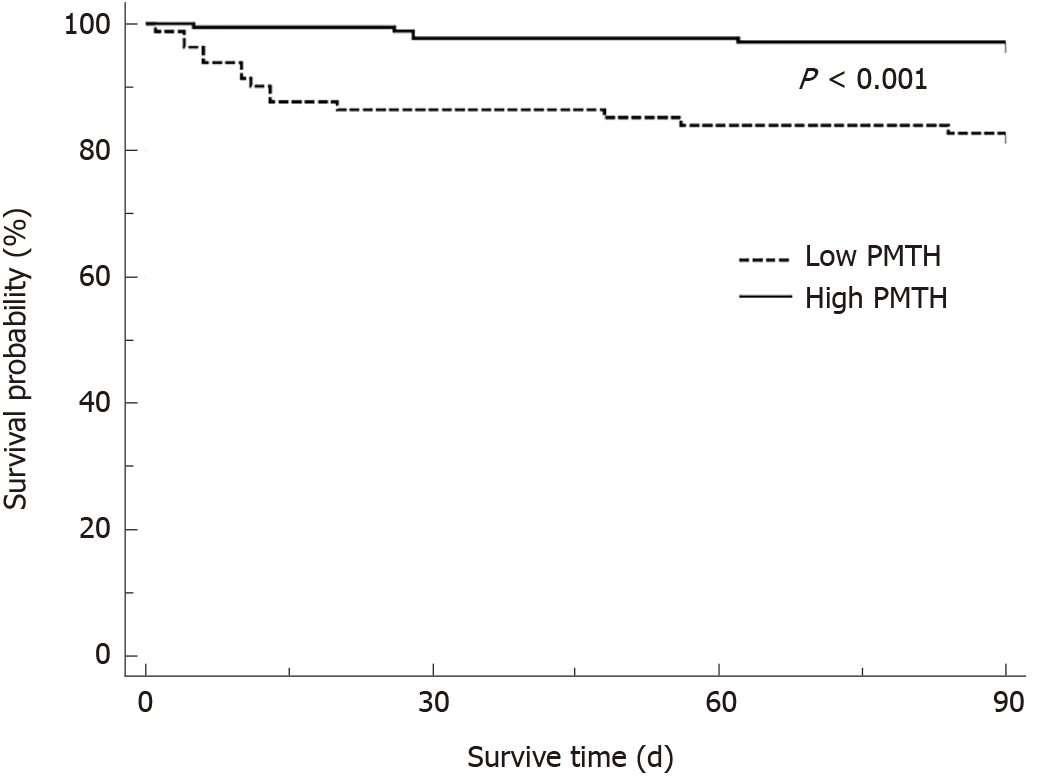
Figure 3 Kaplan-Meier curve of 3-mo postoperative survival.
PMTH: Psoas muscle thickness per height.
- Citation: Dai X, Gao B, Zhang XX, Li J, Jiang WT. Value of the controlling nutritional status score and psoas muscle thickness per height in predicting prognosis in liver transplantation. World J Clin Cases 2021; 9(35): 10871-10883
- URL: https://www.wjgnet.com/2307-8960/full/v9/i35/10871.htm
- DOI: https://dx.doi.org/10.12998/wjcc.v9.i35.10871


