Copyright
©The Author(s) 2021.
World J Clin Cases. Dec 6, 2021; 9(34): 10659-10665
Published online Dec 6, 2021. doi: 10.12998/wjcc.v9.i34.10659
Published online Dec 6, 2021. doi: 10.12998/wjcc.v9.i34.10659
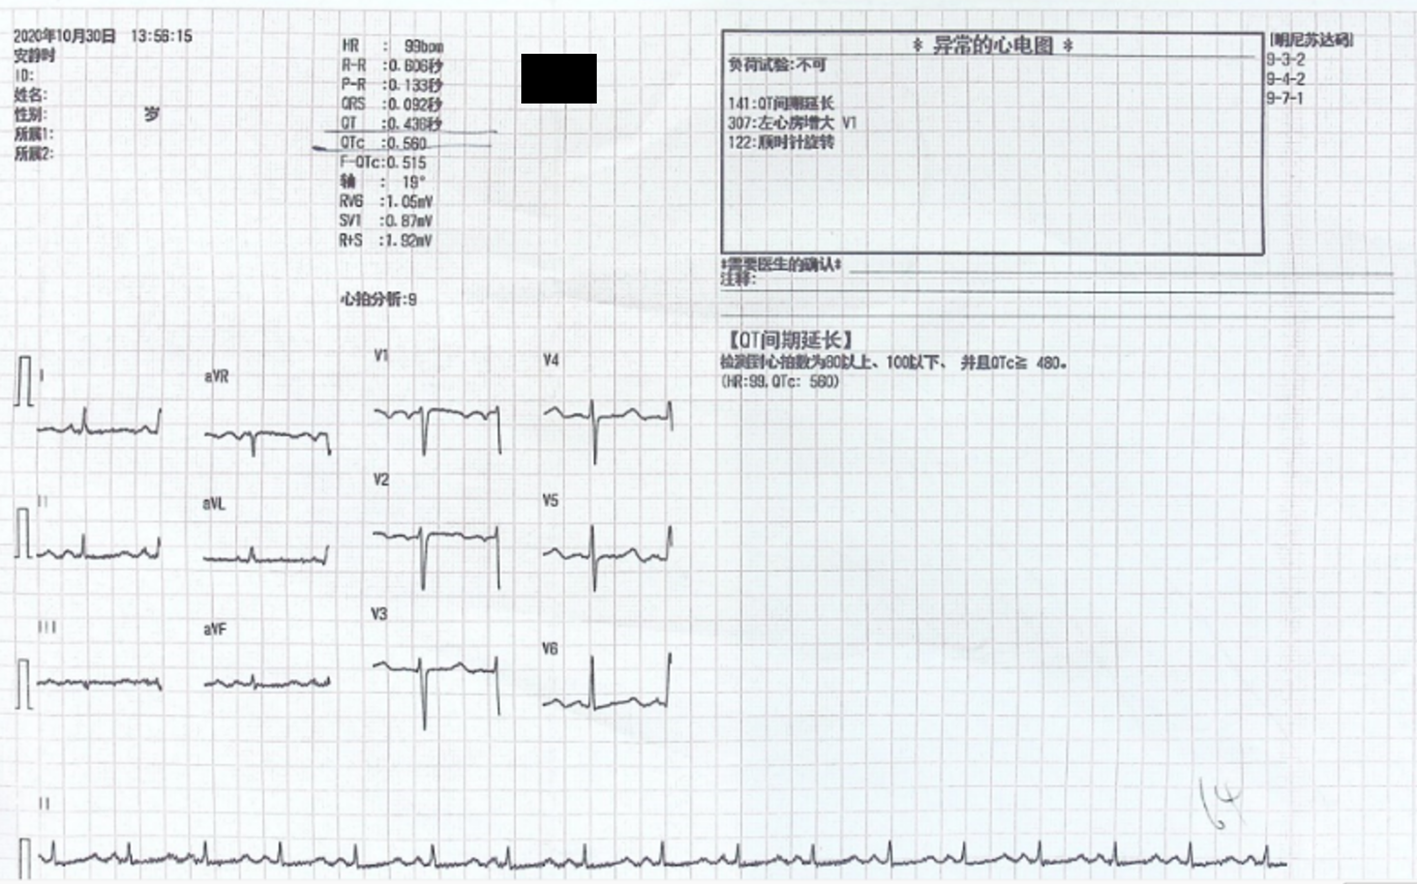
Figure 1 Electrocardiography on admission showed a prolonged QT interval corrected for heart rate.
The QT interval corrected for heart rate equaled 0.560 s.
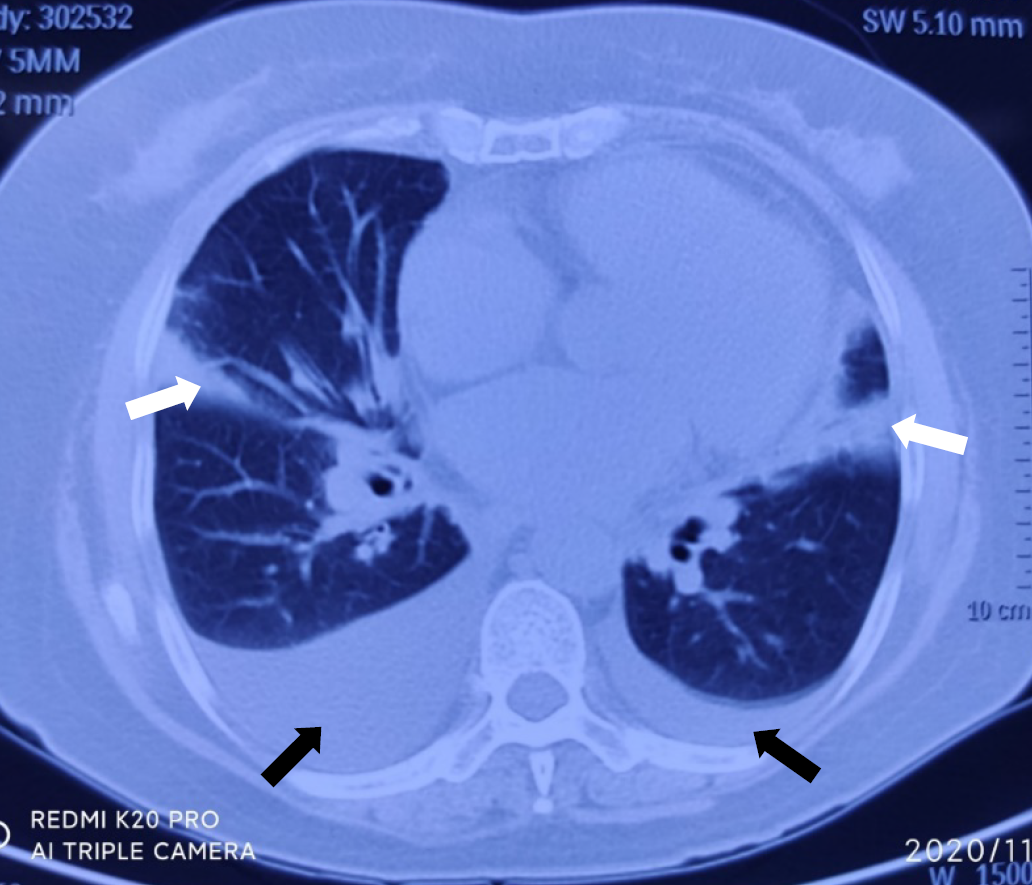
Figure 2 Chest computed tomography on admission showed bilateral lung infection and bilateral pleural effusions.
Black arrows showed bilateral pleural effusion; White arrows showed bilateral lung infection.
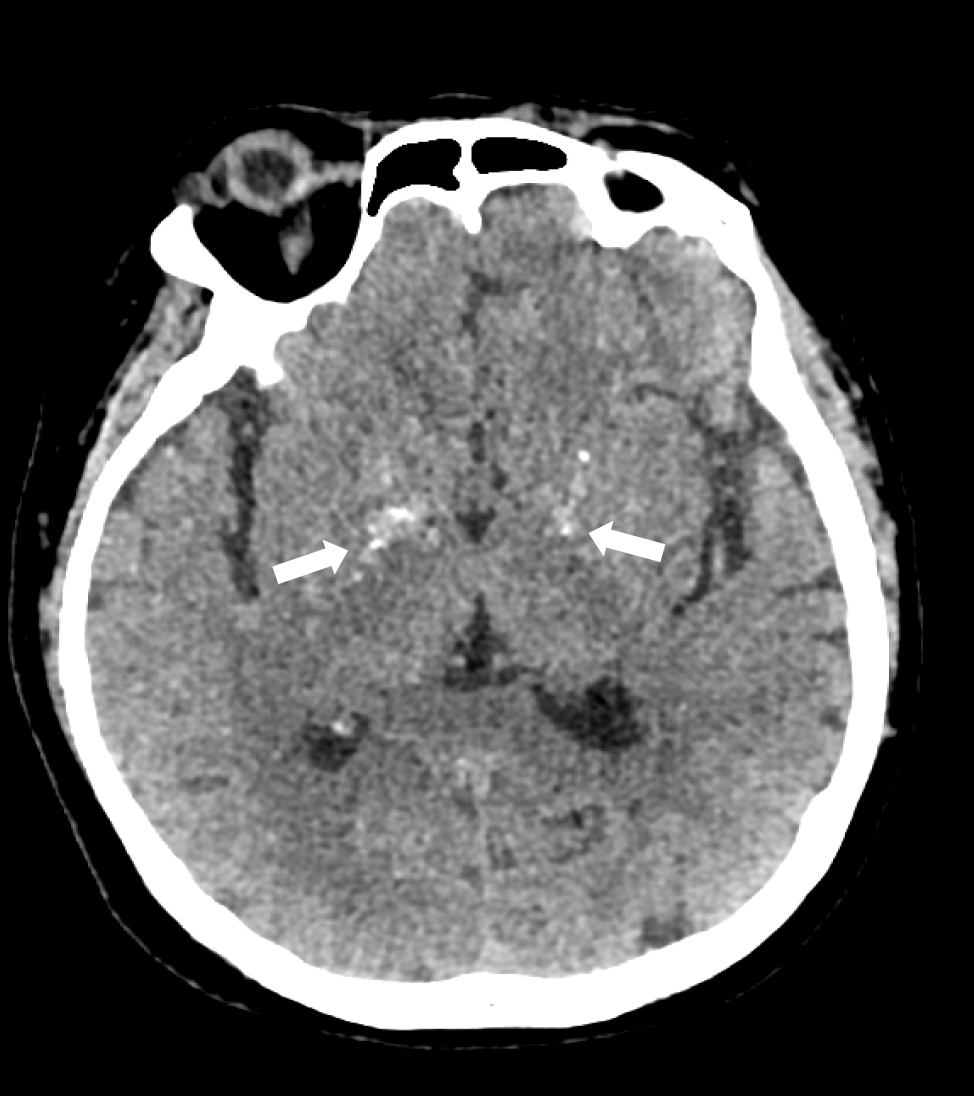
Figure 3 Head computed tomography on admission showed symmetric calcification in basal ganglia.
No sign of infraction or hemorrhage was observed; White arrows: Calcification.
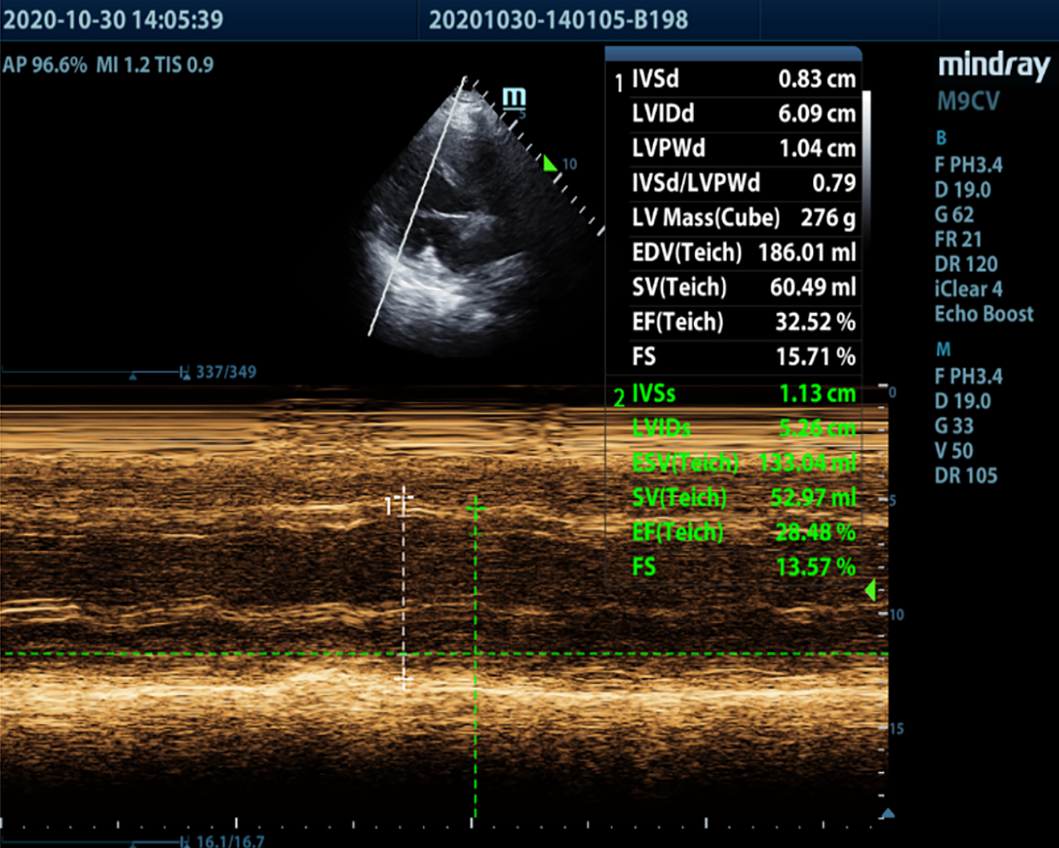
Figure 4 Echocardiography on admission.
Left ventricular enlargement and left ventricular systolic function was significantly reduced. The ejection fraction was 28.48%.
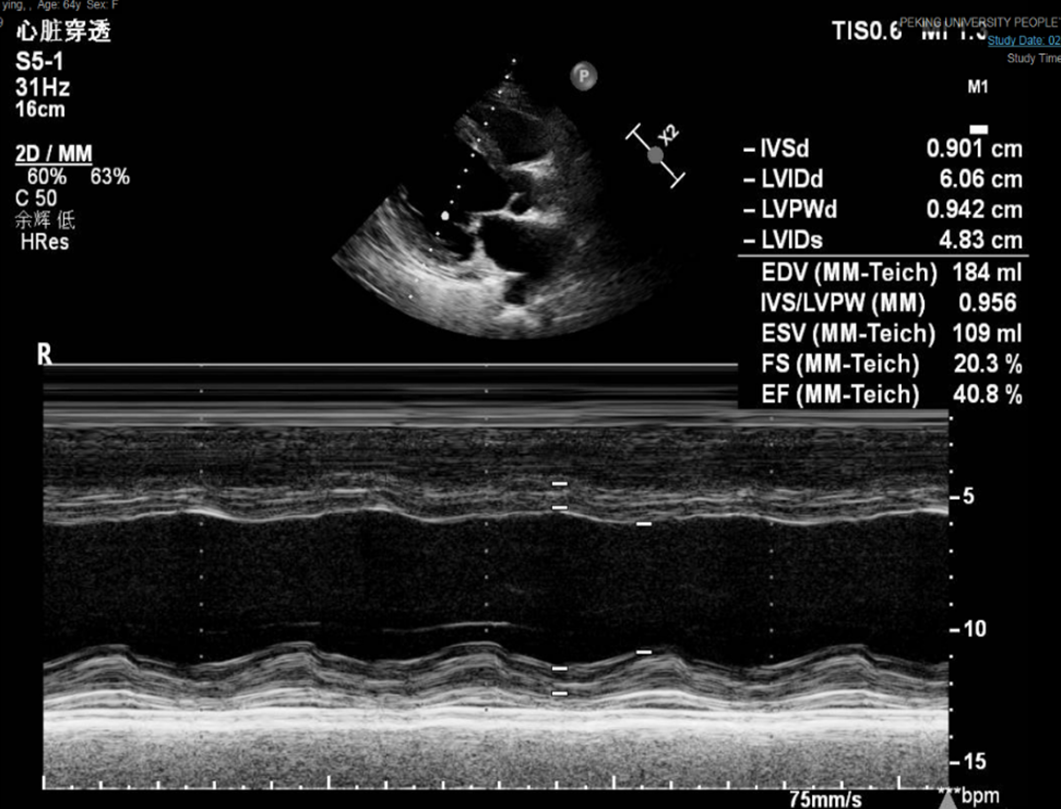
Figure 5 Echocardiography 2 d after admission.
Left ventricular systolic function improved after calcium supplementation. The ejection fraction was 40.80%.
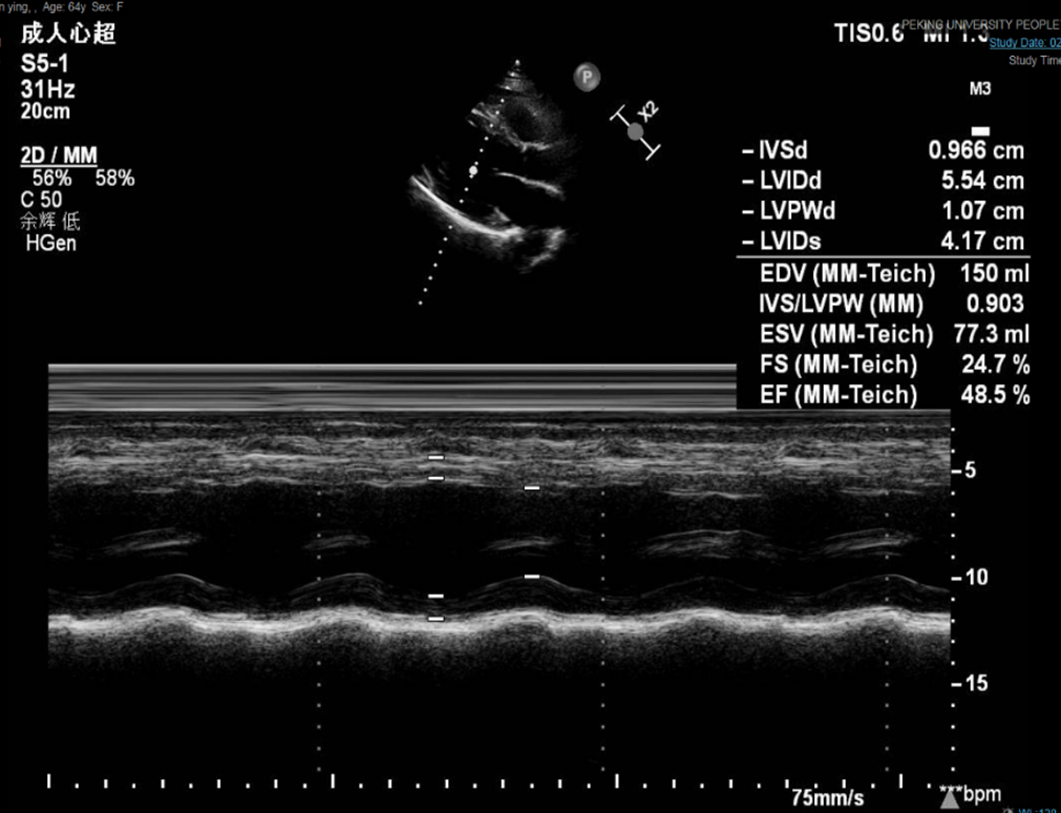
Figure 6 Echocardiography at the 1-mo follow-up.
The size and systolic function of the left ventricle continued to recover. The ejection fraction was 48.50%.
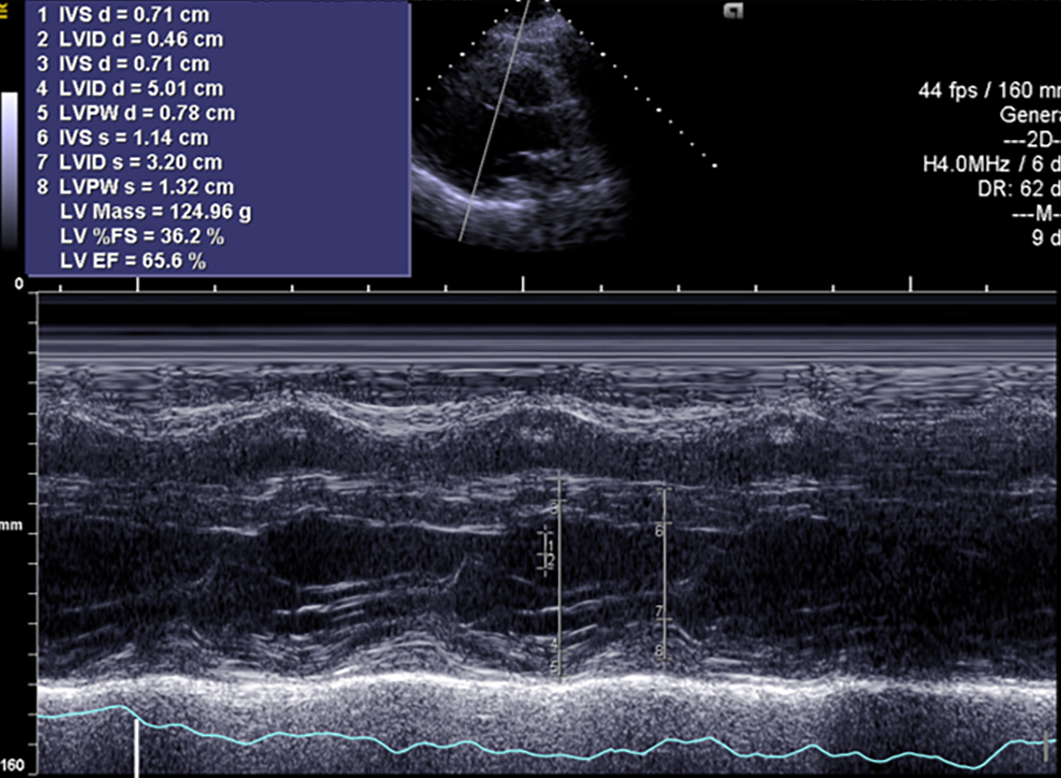
Figure 7 Echocardiography at the 4-mo follow-up.
Left ventricular size and left ventricular systolic function returned to normal. The ejection fraction was 65.60%.
- Citation: Wang C, Dou LW, Wang TB, Guo Y. Reversible congestive heart failure associated with hypocalcemia: A case report. World J Clin Cases 2021; 9(34): 10659-10665
- URL: https://www.wjgnet.com/2307-8960/full/v9/i34/10659.htm
- DOI: https://dx.doi.org/10.12998/wjcc.v9.i34.10659


