Copyright
©The Author(s) 2021.
World J Clin Cases. Dec 6, 2021; 9(34): 10566-10575
Published online Dec 6, 2021. doi: 10.12998/wjcc.v9.i34.10566
Published online Dec 6, 2021. doi: 10.12998/wjcc.v9.i34.10566
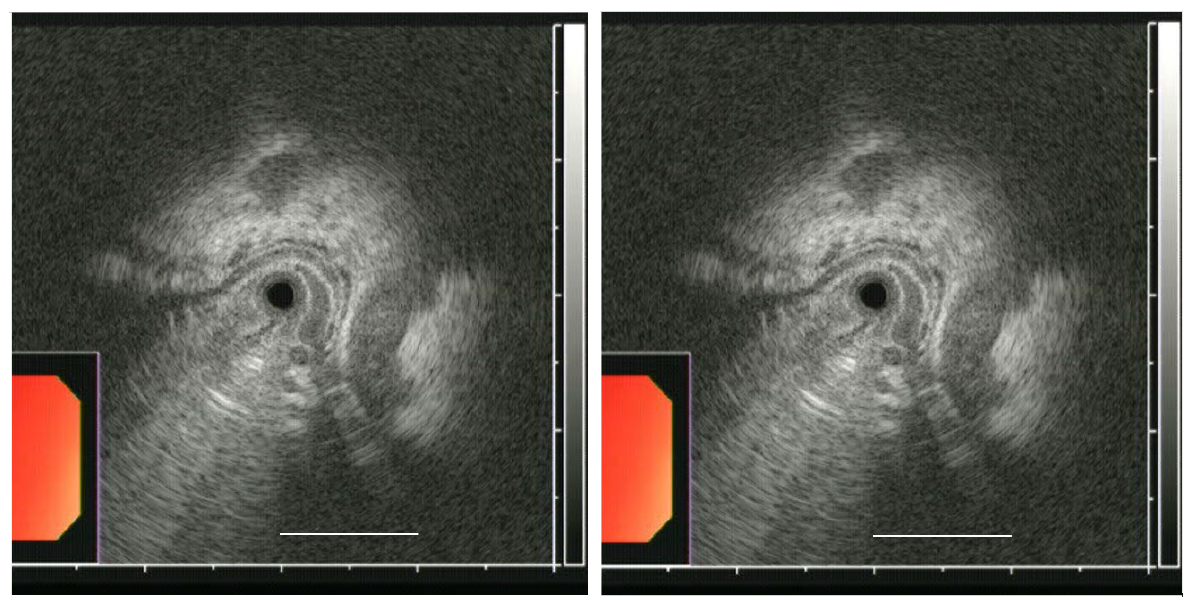
Figure 1 High-frequency intraluminal ultrasound images of post-endoscopic variceal ligation of type 1 gastric varices.
The post-endoscopic variceal ligation sizes of varices were assessed according to the largest cross-sectional area (CSA). CSA was measured between the hypoechoic blood-filled lumen and the hyperechoic submucosa or mucosa. The dotted line indicates the largest CSA of the varix. The scale bar represents 10 mm.
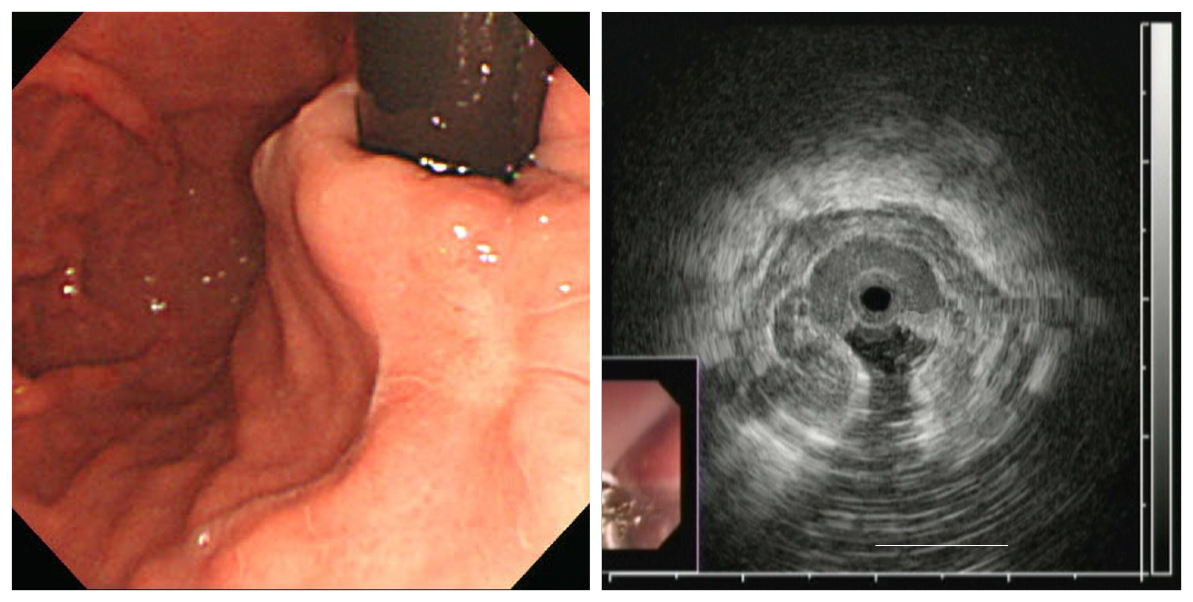
Figure 2 Representative esophagogastroduodenoscopy and high-frequency intraluminal ultrasound images of type 1 gastric varices.
The type 1 gastric varices was grade 0 according to esophagogastroduodenoscopy, but the largest variceal cross-sectional area was 31.4 mm2 according to high-frequency intraluminal ultrasound.
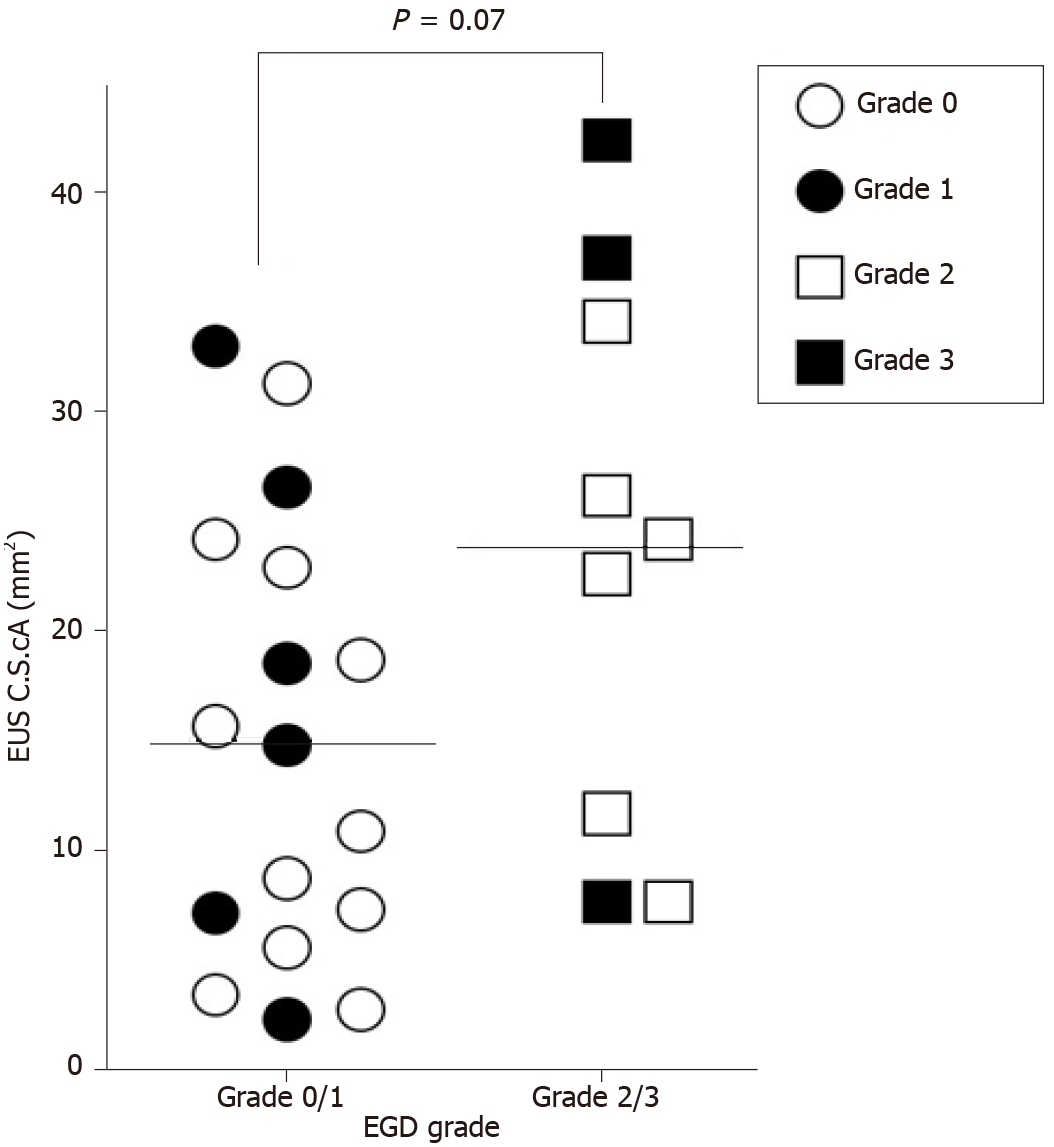
Figure 3 Post-endoscopic variceal ligation esophagogastroduodenoscopy grades and cross-sectional areas.
The mean largest variceal cross-sectional area (CSA) for grade 0/1 type 1 gastric varices (GOV1) did not differ from that for grade 2/3 GOV1 (15.1 ± 10.0 mm2 vs 23.7 ± 12.7 mm2, respectively; P = 0.07). EUS: Endoscopic ultrasound; EGD: Esophagogastroduodenoscopy.
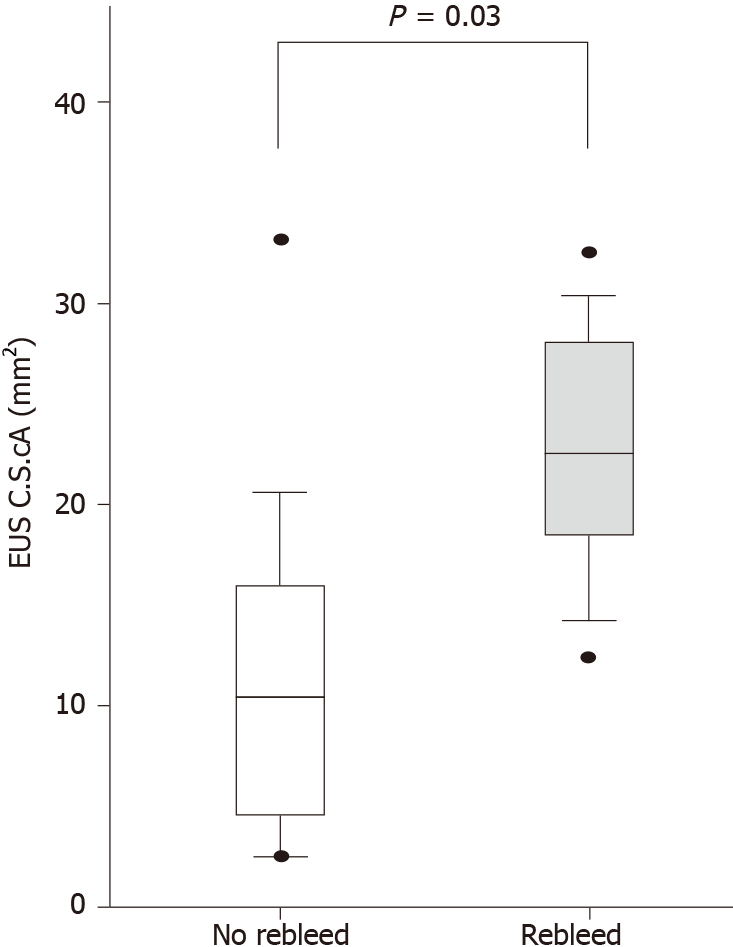
Figure 4 Comparison of high-frequency intraluminal ultrasound estimates of largest variceal cross-sectional area between patients with or without post-endoscopic variceal ligation variceal bleeding.
The mean largest variceal cross-sectional area (CSA) of type 1 gastric varices patients who experienced post-endoscopic variceal ligation (EVL) bleeding was significantly greater than that of patients who did not experience post-EVL bleeding (22.2 ± 7.7 mm2 vs 11.2 ± 9.2 mm2, respectively; P = 0.03). Horizontal bars represent median values, and the upper and lower ends of the bars represent quartile values. EUS: Endoscopic ultrasound.
- Citation: Kim JH, Choe WH, Lee SY, Kwon SY, Sung IK, Park HS. Comparative study for predictability of type 1 gastric variceal rebleeding after endoscopic variceal ligation: High-frequency intraluminal ultrasound study. World J Clin Cases 2021; 9(34): 10566-10575
- URL: https://www.wjgnet.com/2307-8960/full/v9/i34/10566.htm
- DOI: https://dx.doi.org/10.12998/wjcc.v9.i34.10566


