Copyright
©The Author(s) 2021.
World J Clin Cases. Nov 6, 2021; 9(31): 9652-9661
Published online Nov 6, 2021. doi: 10.12998/wjcc.v9.i31.9652
Published online Nov 6, 2021. doi: 10.12998/wjcc.v9.i31.9652
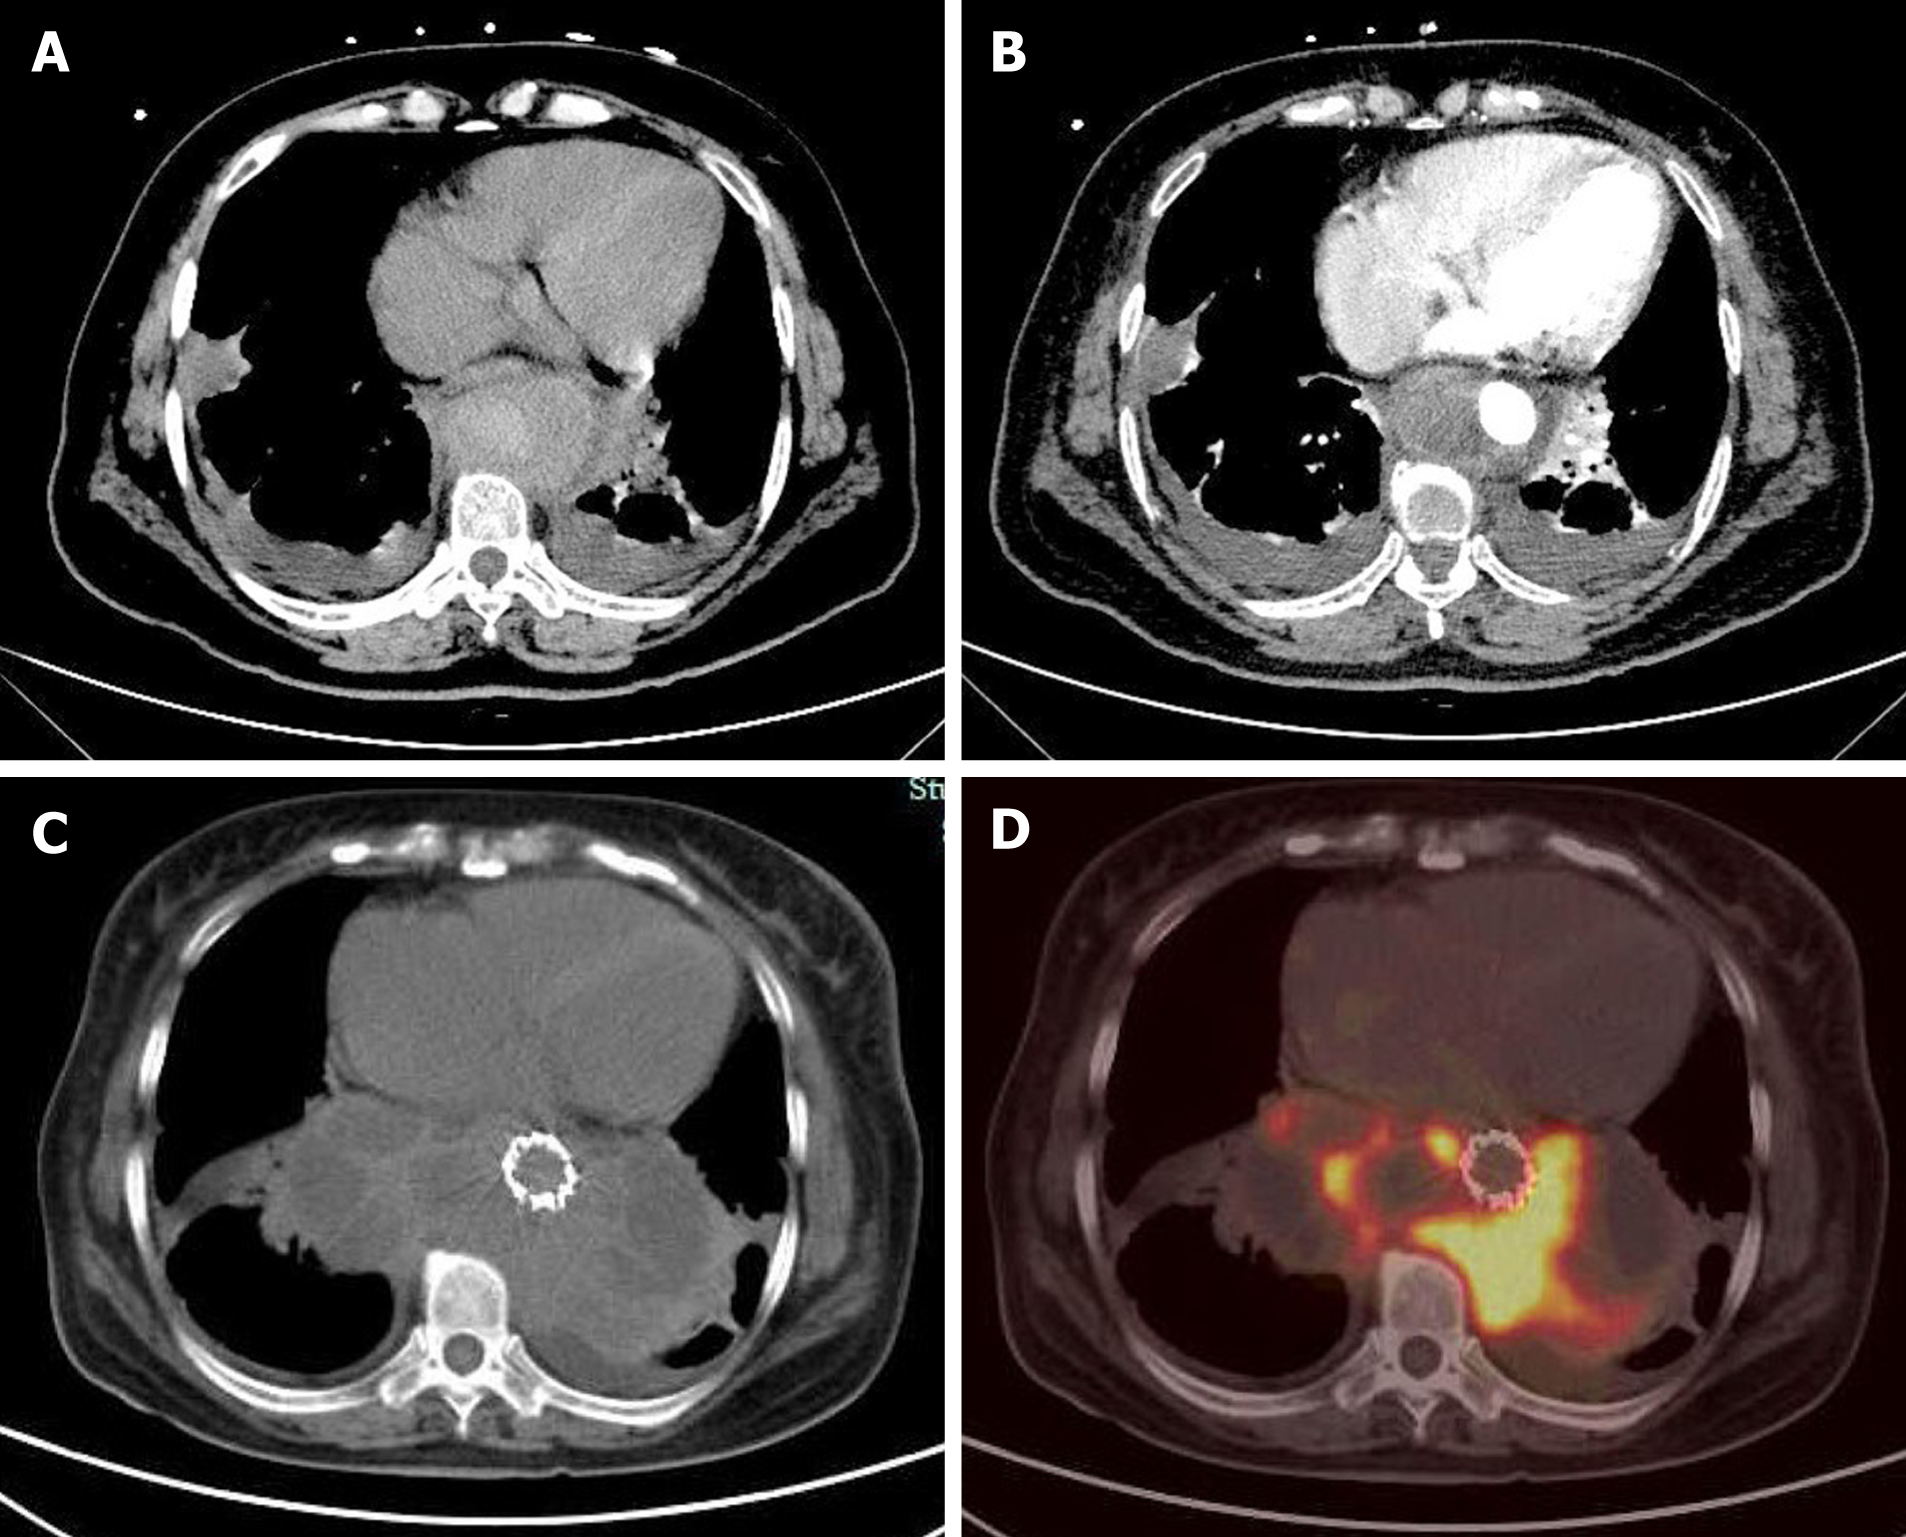
Figure 1 Computed tomography angiography and positron emission tomography/computed tomography transverse section images.
A: Computed tomography (CT) scan; B: Contrast-enhanced CT scan at approximately the same anatomic level. A circular mass with a patchy high-density enhanced signal was found around the lower thoracic aorta. The mass showed heterogeneous enhancement on the contrast-enhanced CT scan; C: CT scan 1 mo later; D: Positron emission tomography scan at the same anatomic level 1 mo later. The mass had significantly increased, still surrounding the lower thoracic aorta. The high-density part of the mass had increased fluorodeoxyglucose (FDG) metabolism, whereas the low-density part had decreased FDG metabolism.
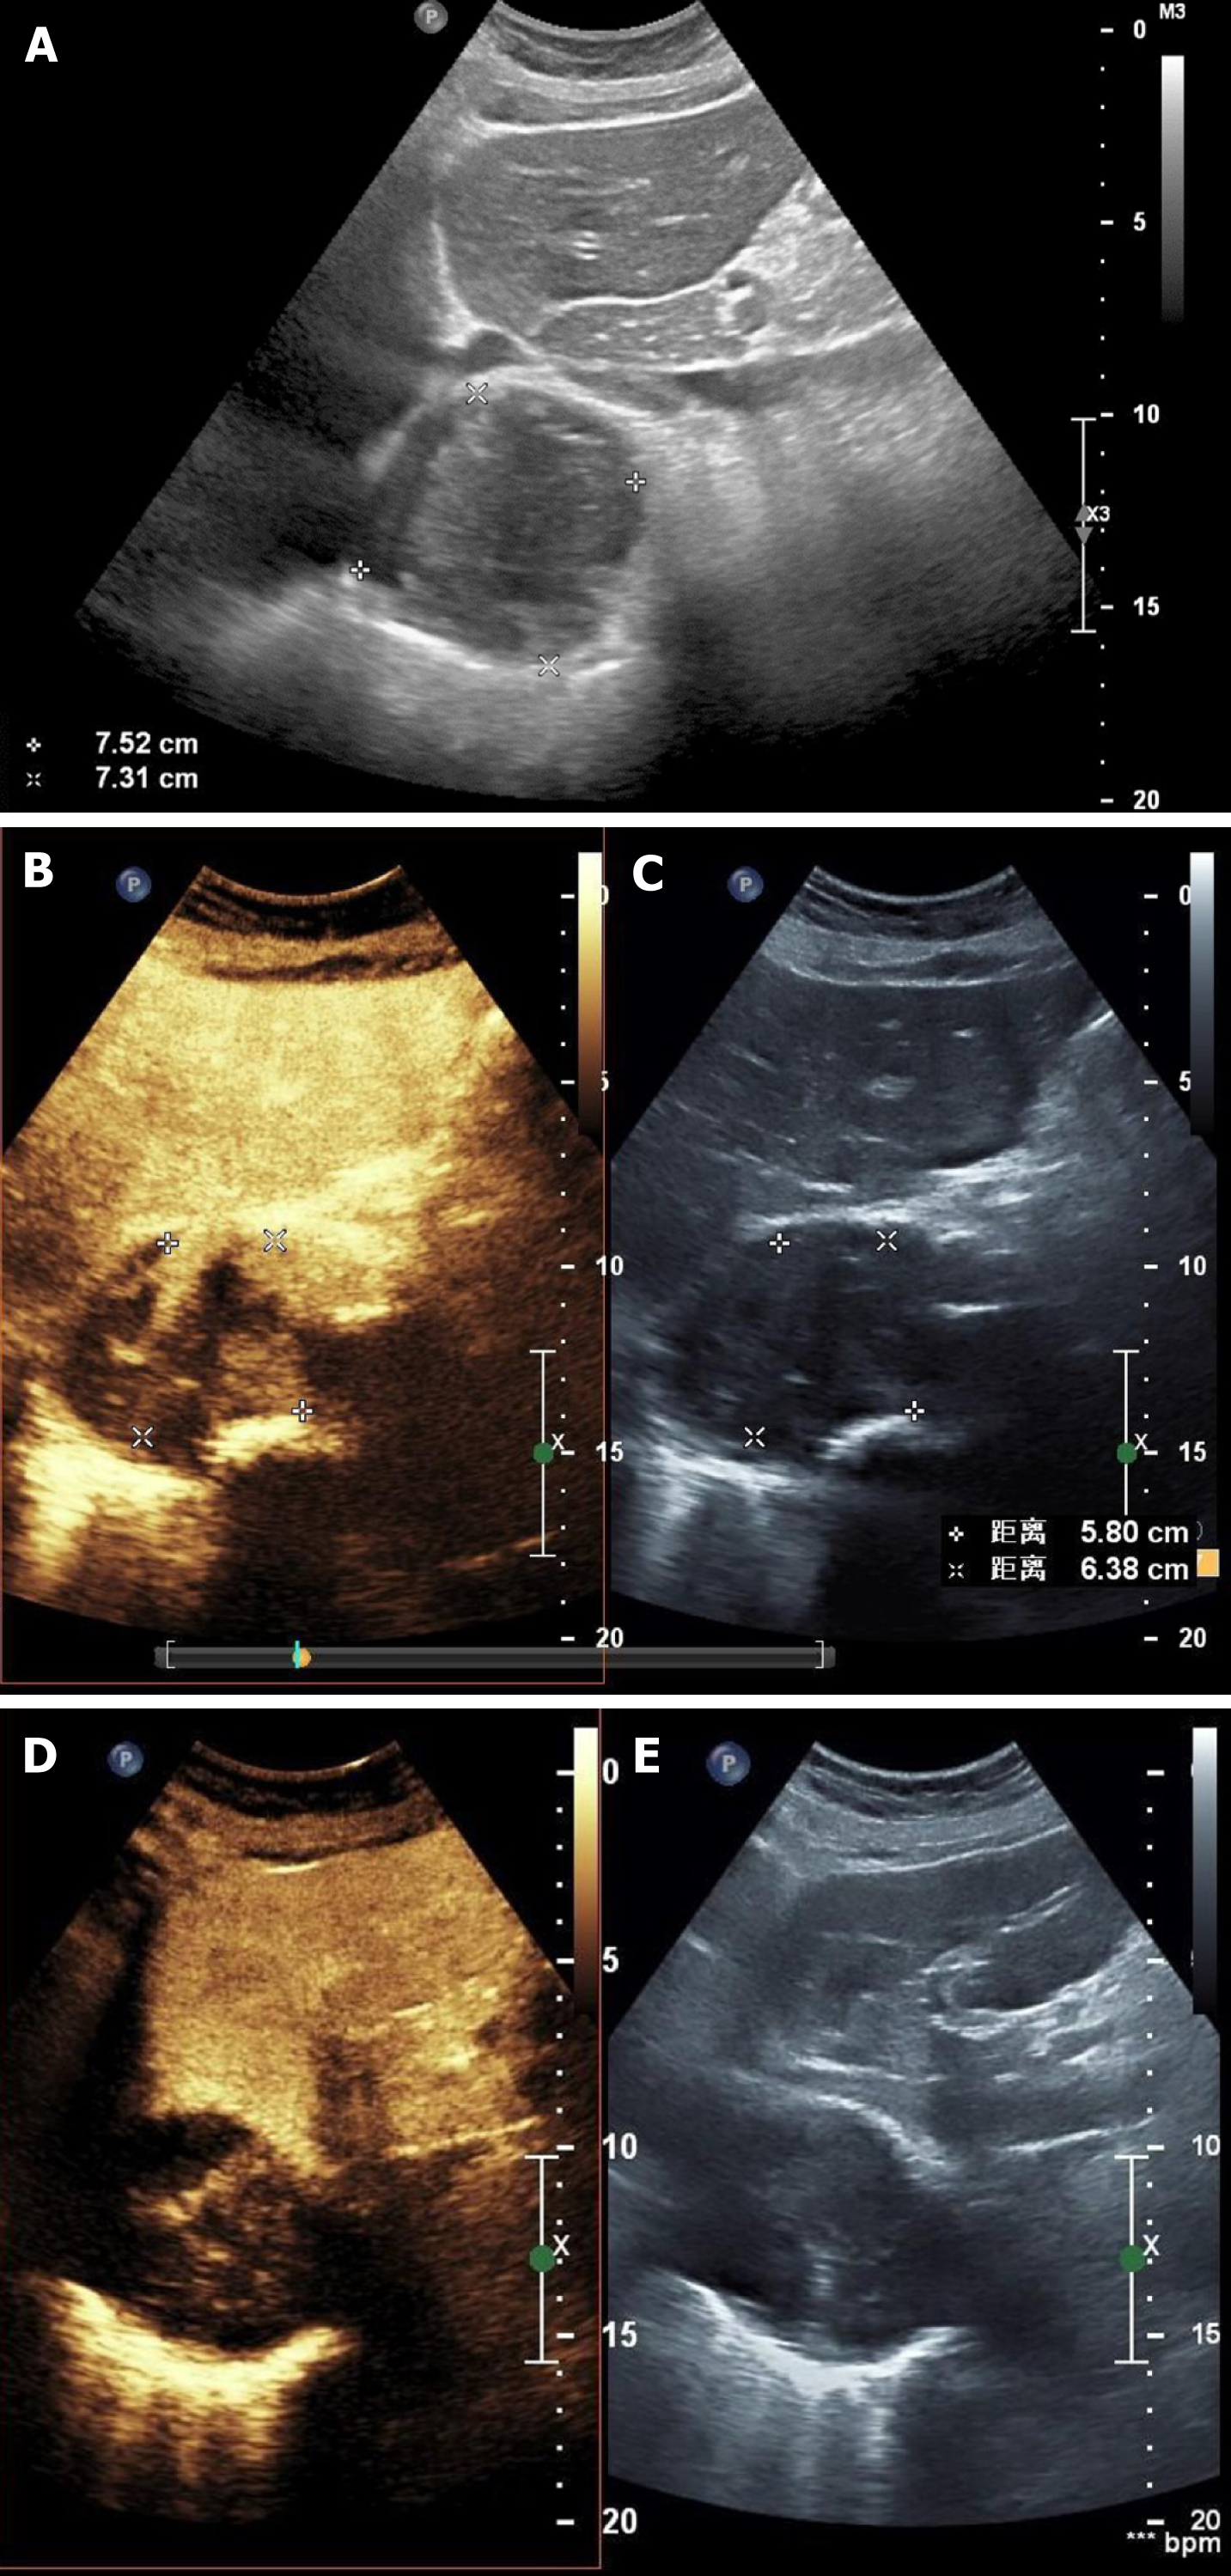
Figure 2 Ultrasound and contrast-enhanced ultrasonography images.
A: Two-dimensional ultrasound image. The marked circular area is the mass; B: Synchronous contrast-enhanced ultrasonography (CEUS) pictures showing the harmonic mode; C: Synchronous CEUS pictures showing the basal mode; D: Synchronous CEUS pictures at different times and levels compared to B and C in the harmonic mode, in which the contrast signal was highlighted; E: Synchronous CEUS pictures at different times and levels compared to B and C in the basal mode, in which only the tissue signal was displayed similar to a normal ultrasound and the contrast agent signal was not highlighted. Solids have stronger properties reflecting ultrasound than liquid material, which present as a stronger signal and show more brightness in the basal mode picture. In the harmonic mode, the higher the content of contrast agent in the tissue, the stronger the signal and the higher the brightness in the image. As seen in panel A, the echo of the mass around the artery was uneven and was comprised of liquid anechoic and solid hyperechoic areas. By comparing panels B and C with panels D and E, it can be observed that the contrast medium predominantly diffusely filled the hyperechoic areas, rather than the hypoechoic areas. There was no enhancement signal of the contrast medium in the liquid anechoic area but a rich signal of contrast medium in the solid hyperechoic area was present, suggesting that the hyperechoic regions in this study were solid tissues rich in blood supply and capillaries. The lesion was similar to a malignant tumor with liquefaction and necrosis.
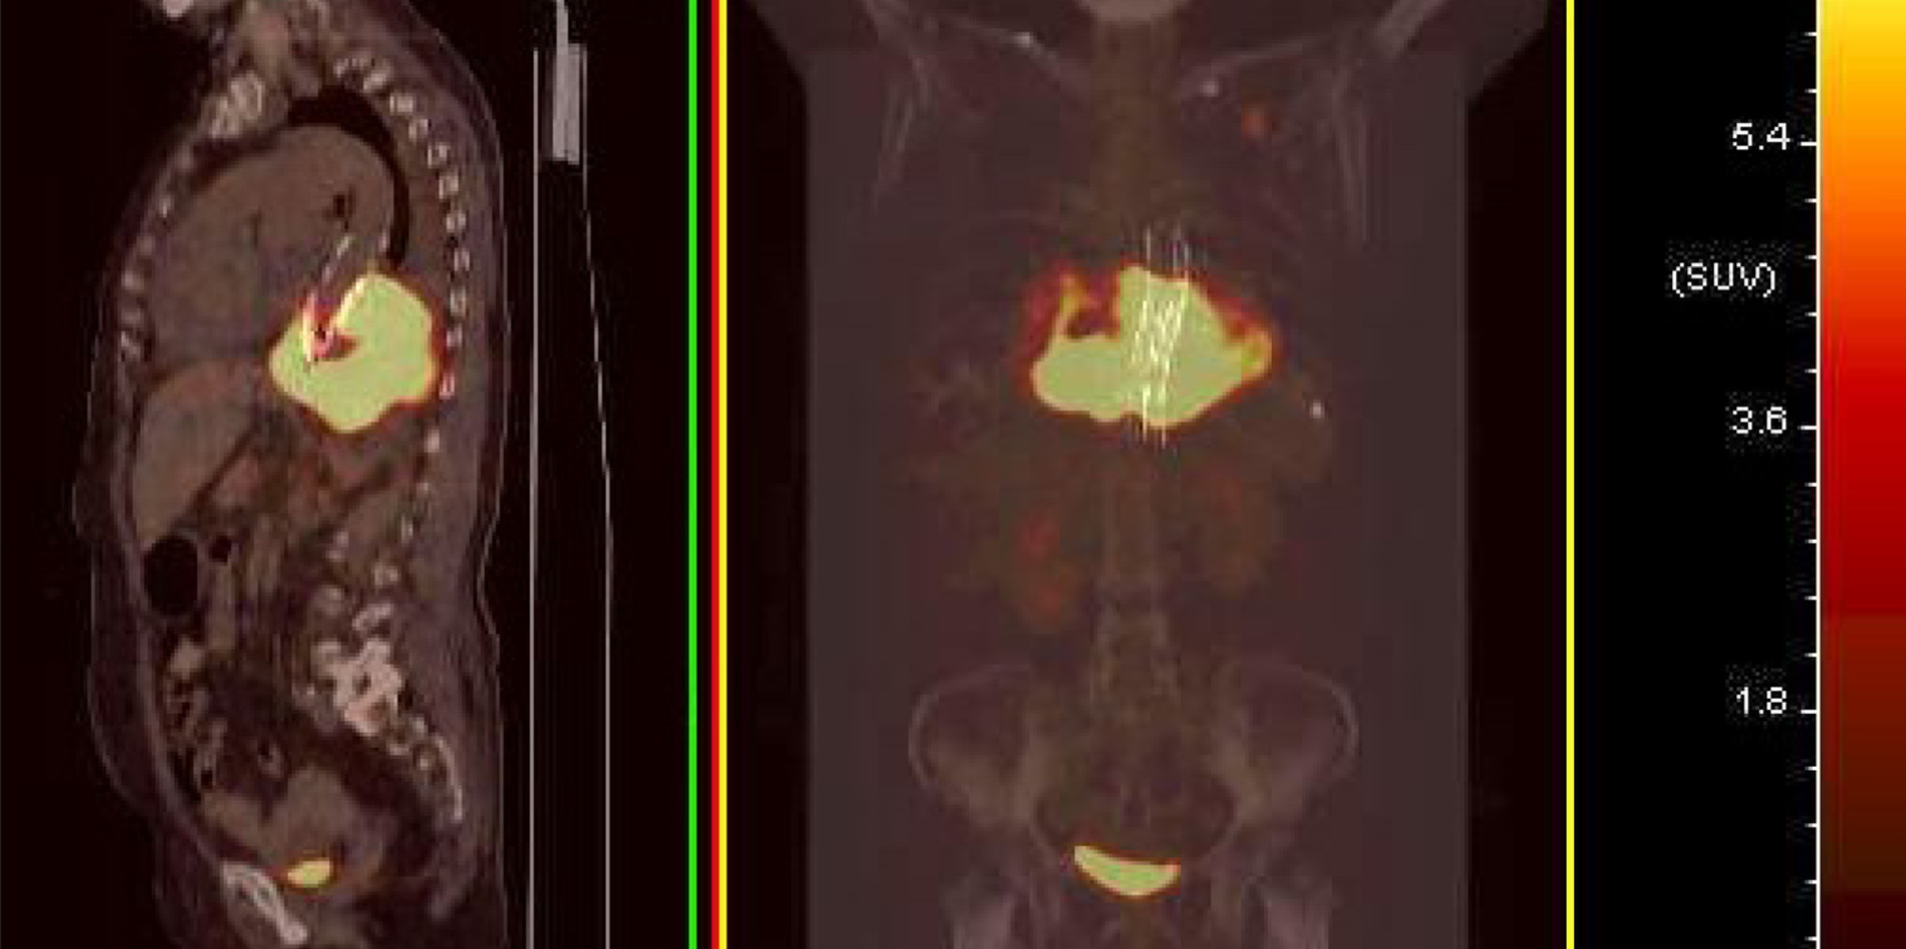
Figure 3 Median sagittal and coronal section images of positron emission tomography/computed tomography.
Positron emission tomography/computed tomography showed that the mass with high fluorodeoxyglucose (FDG) metabolism surrounded the descending aorta. The maximum standardized uptake value (SUV) was 28.8. A nodule with a high FDG metabolism was observed in the left upper lobe, with a maximum SUV of 9.5. The high metabolic signal in the bladder should represent the excreted drugs. No abnormal increase in FDG metabolism was observed in the rest of the body.
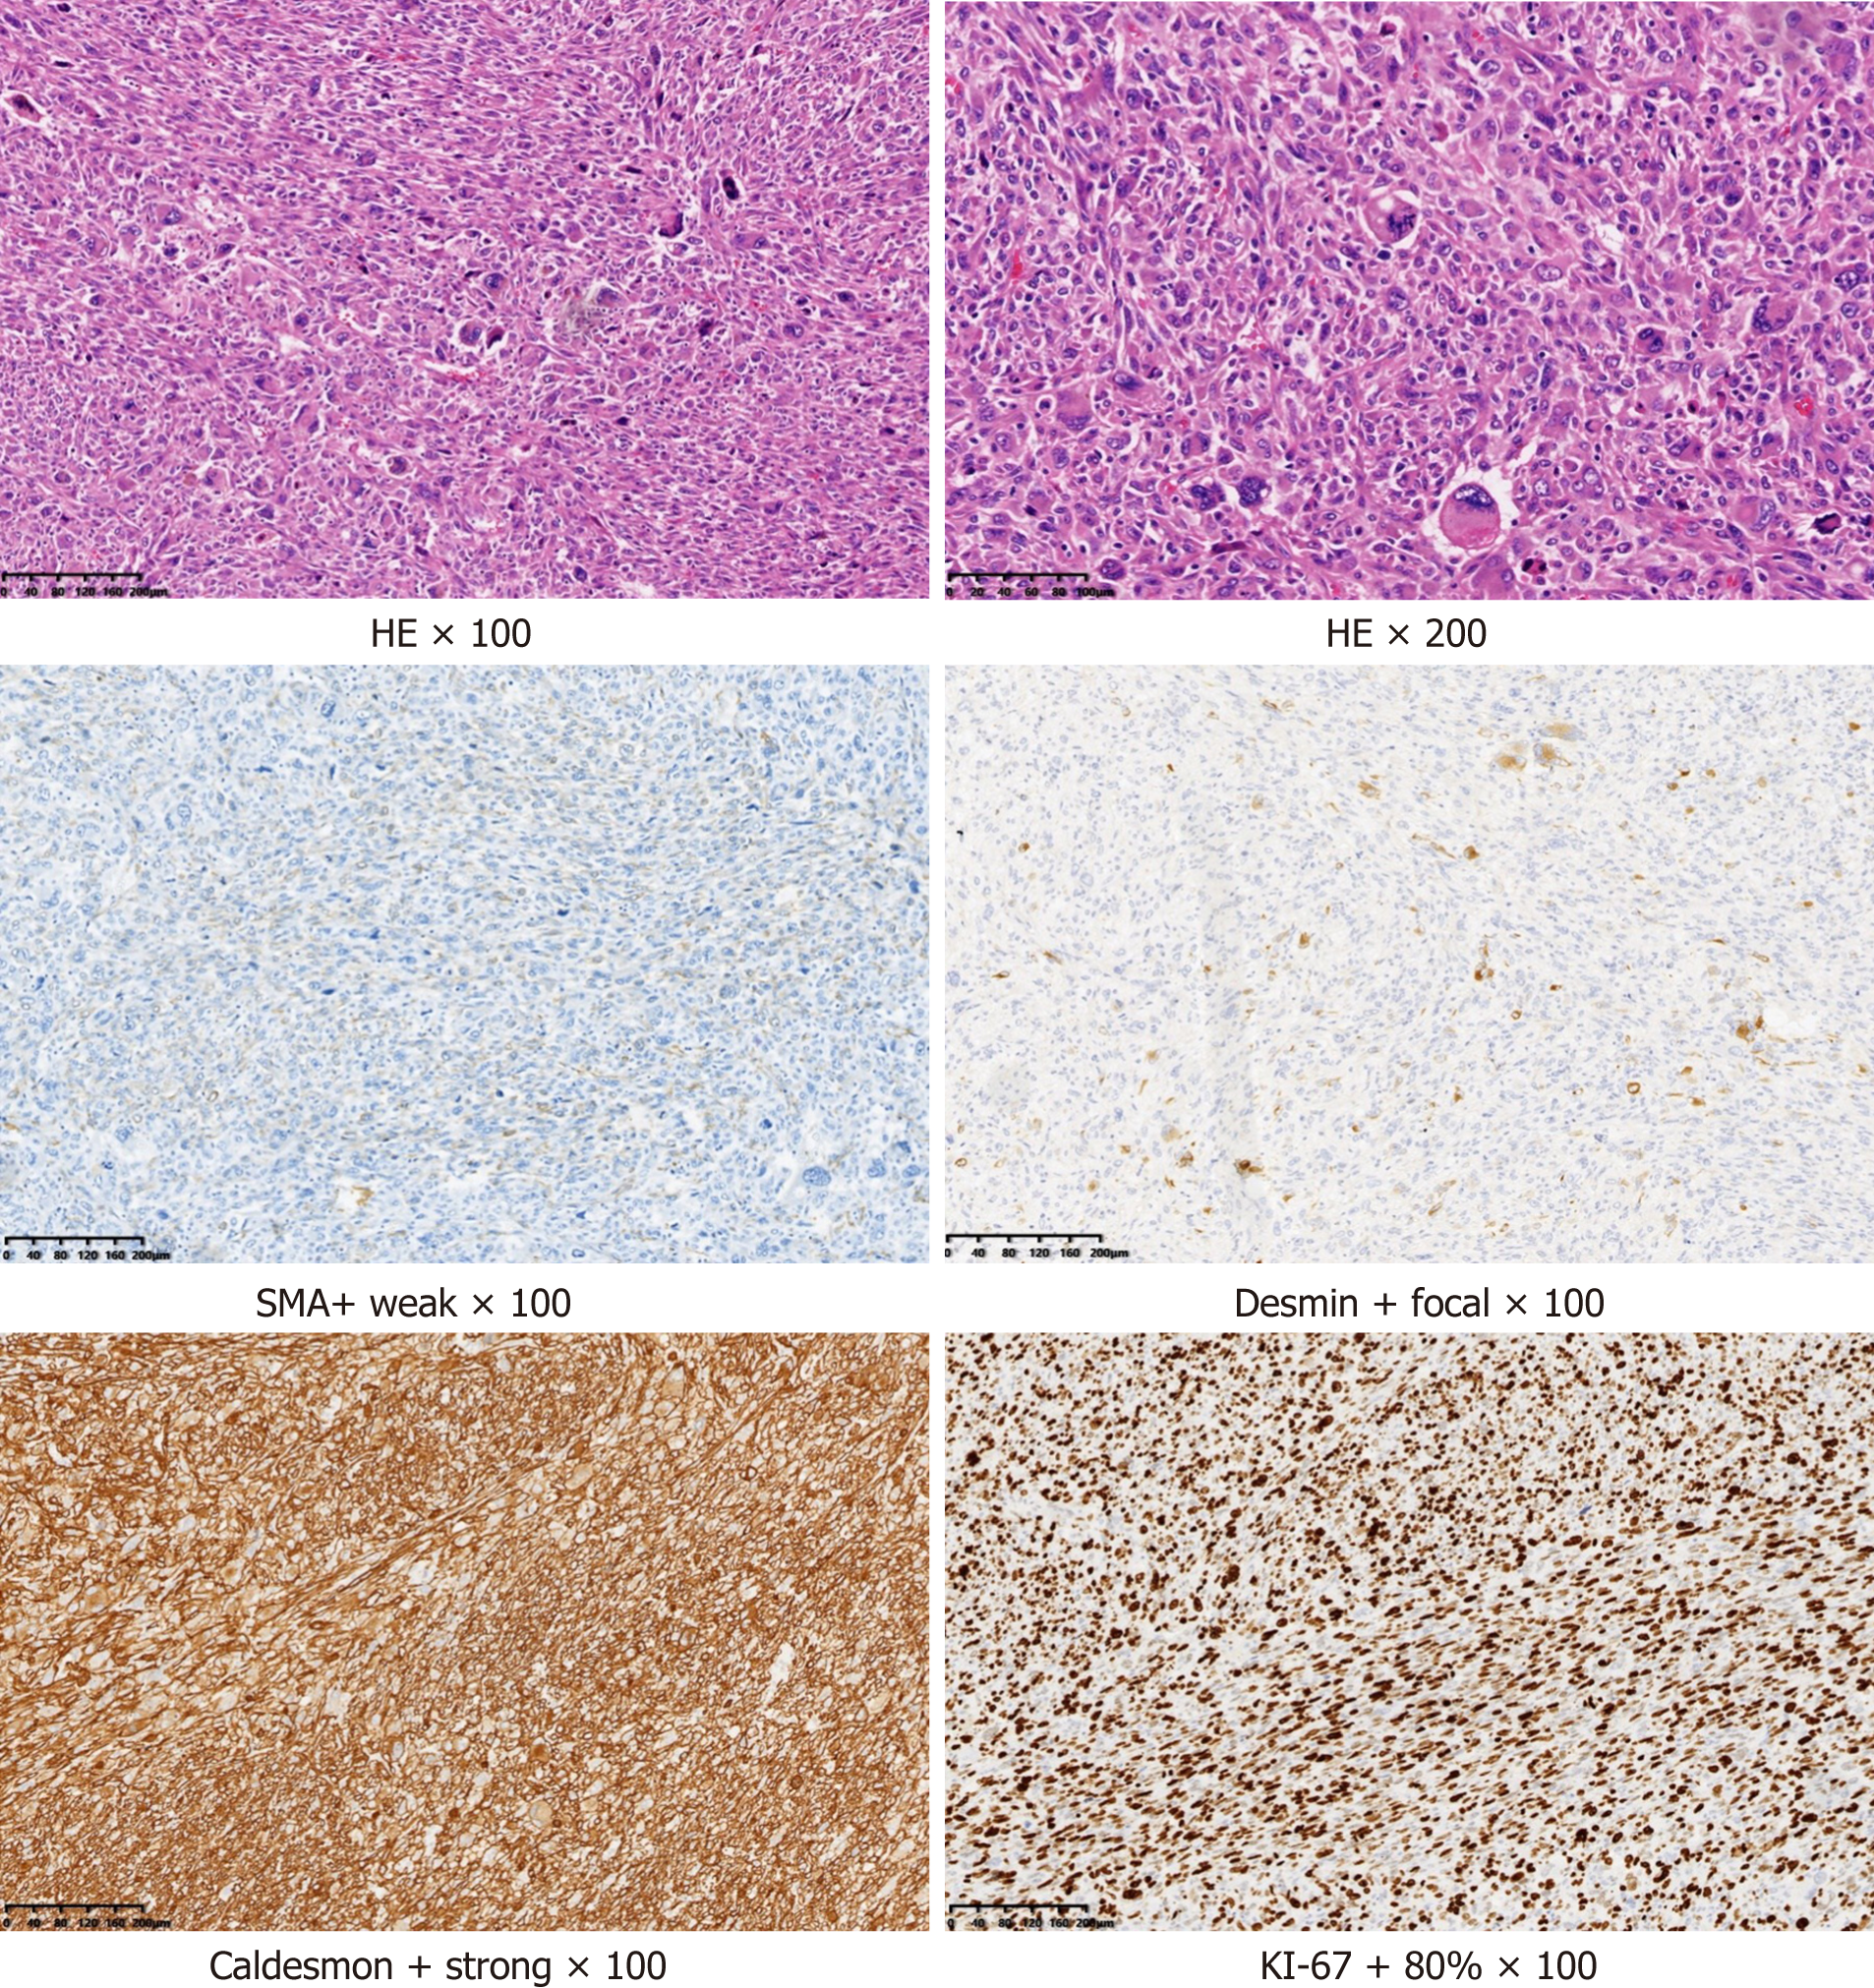
Figure 4 Postoperative pathological picture.
The size of the resected tumor tissue was about 12 cm × 7 cm × 4.5 cm, with hemorrhage and necrosis. Under the microscope (hematoxylin and eosin staining), the tumor cells were short fusiform or epithelioid with obvious atypia. Multinucleated and pleomorphic giant cells were also present. Mitosis indicating active growth was present. Immunohistochemistry revealed that the tumor was positive for smooth muscle actin, desmin, and caldesmon, suggesting a smooth muscle origin, and was negative for cytokeratin, epithelial membrane antigen, synaptophysin, S-100, chromogranin A, and cluster of differentiation 56 (CD56), suggesting that the tumor was not epithelial, neurogenic, neuroendocrine, or neuroectodermal. Ki-67, an antigen index of cell proliferation, had a value of 60%. The higher the index, the higher the risk of malignancy. Cytokeratin, epithelial membrane antigen, synaptophysin, S-100, chromogranin A, and CD56 were all negative in this case (data not shown), suggesting that the tumor was not epithelial, neurogenic, neuroendocrine, or neuroectodermal. HE: Hematoxylin and eosin.
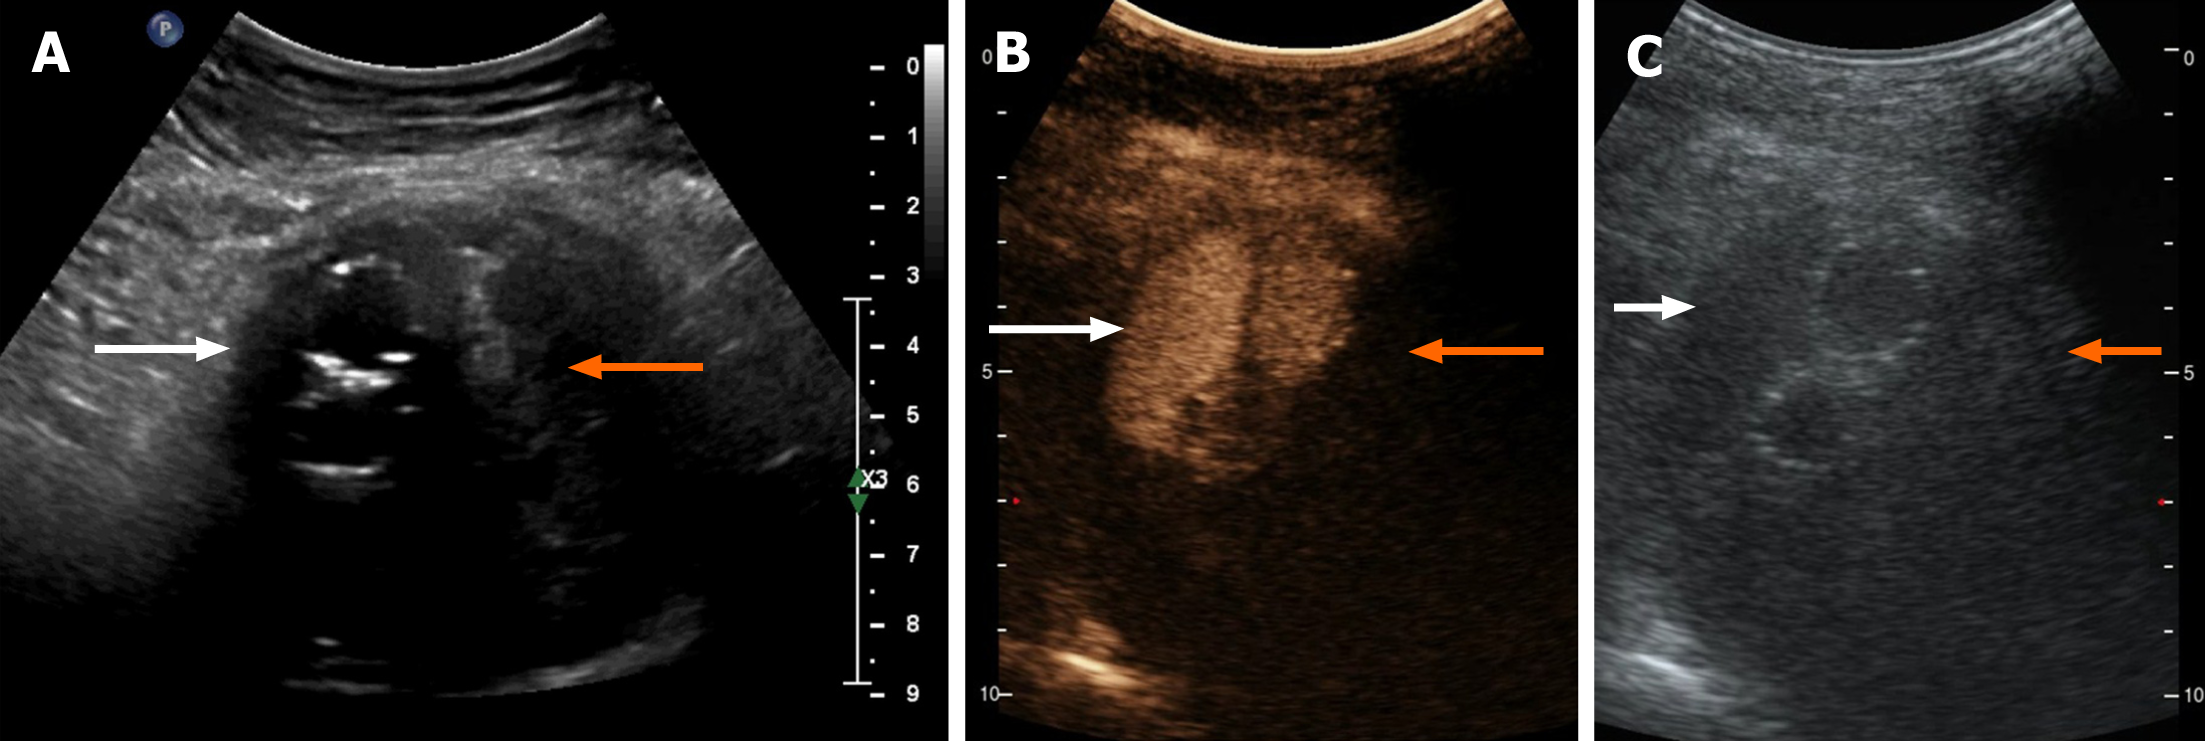
Figure 5 Typical Type 2 endoleak contrast-enhanced ultrasonography findings.
A-C: The areas referred to by the white arrows are approximately the same anatomical location, as are the areas referred to by the orange arrows. A: Two-dimensional ultrasound image. The region pointed to by the white arrows are hypoechoic areas presumed to be flowing blood, and the areas pointed to by the orange arrows indicate patchy hyperechoic areas presumed to be clotted thrombi; B: Synchronous contrast-enhanced ultrasonography (CEUS) pictures indicating the harmonic mode, in which the contrast signal was highlighted. The areas pointed to by the white arrows indicate the fascicular contrast signal presumed to be flowing blood with rich contrast medium. The areas pointed to by the orange arrows have no contrast signal and are presumed to have very little blood supply; C: Synchronous CEUS pictures indicating the basal mode, in which only the tissue signal was displayed similar to a normal ultrasound and the contrast agent signal was not highlighted. The areas pointed to by the white arrow are hypoechoic areas, and the area indicated by the orange arrow has a patchy hyperechoic area. Comparing B and C, it could be seen that the contrast medium filled the hypoechoic area in bundles.
- Citation: Xie XJ, Jiang TA, Zhao QY. Diagnostic value of contrast-enhanced ultrasonography in mediastinal leiomyosarcoma mimicking aortic hematoma: A case report and review of literature . World J Clin Cases 2021; 9(31): 9652-9661
- URL: https://www.wjgnet.com/2307-8960/full/v9/i31/9652.htm
- DOI: https://dx.doi.org/10.12998/wjcc.v9.i31.9652


