Copyright
©The Author(s) 2021.
World J Clin Cases. Nov 6, 2021; 9(31): 9520-9534
Published online Nov 6, 2021. doi: 10.12998/wjcc.v9.i31.9520
Published online Nov 6, 2021. doi: 10.12998/wjcc.v9.i31.9520
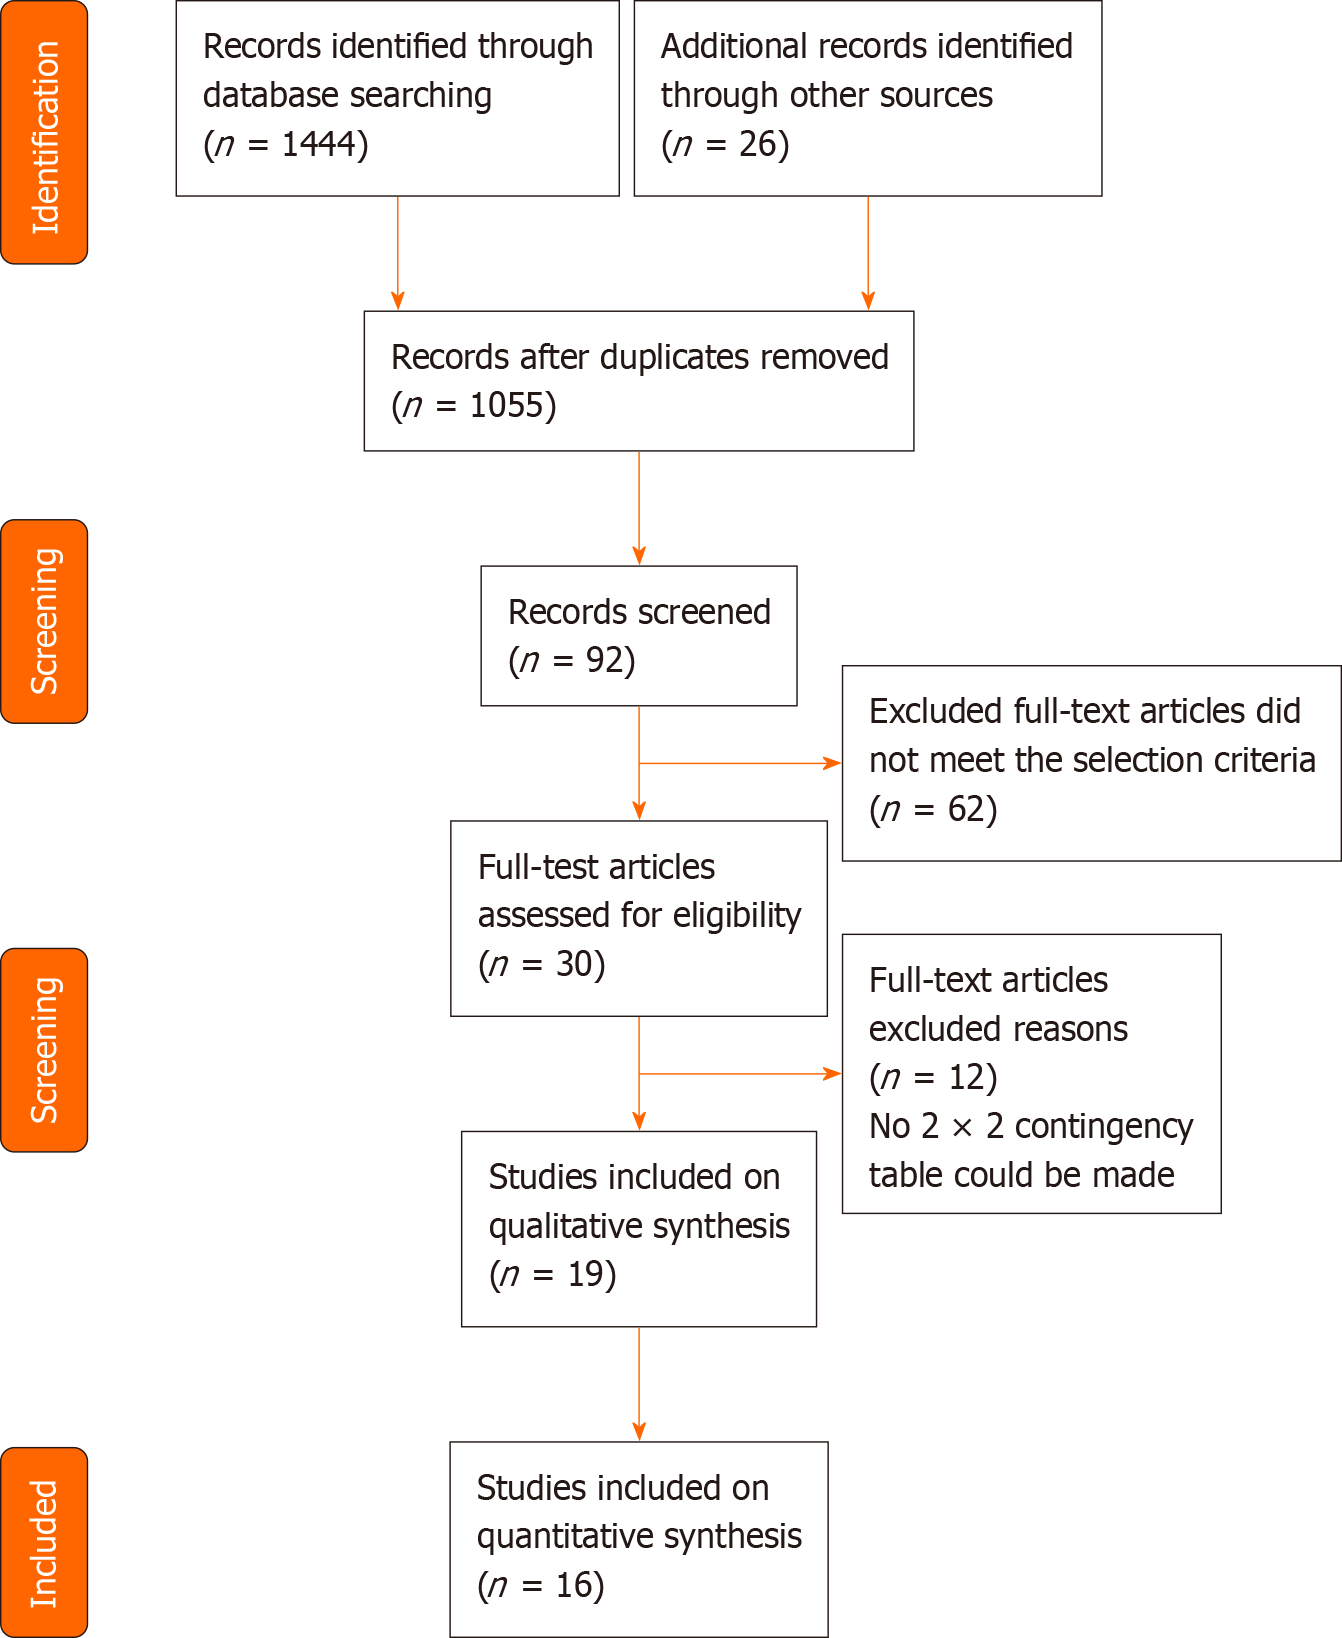
Figure 1 Flow chart of article selection.
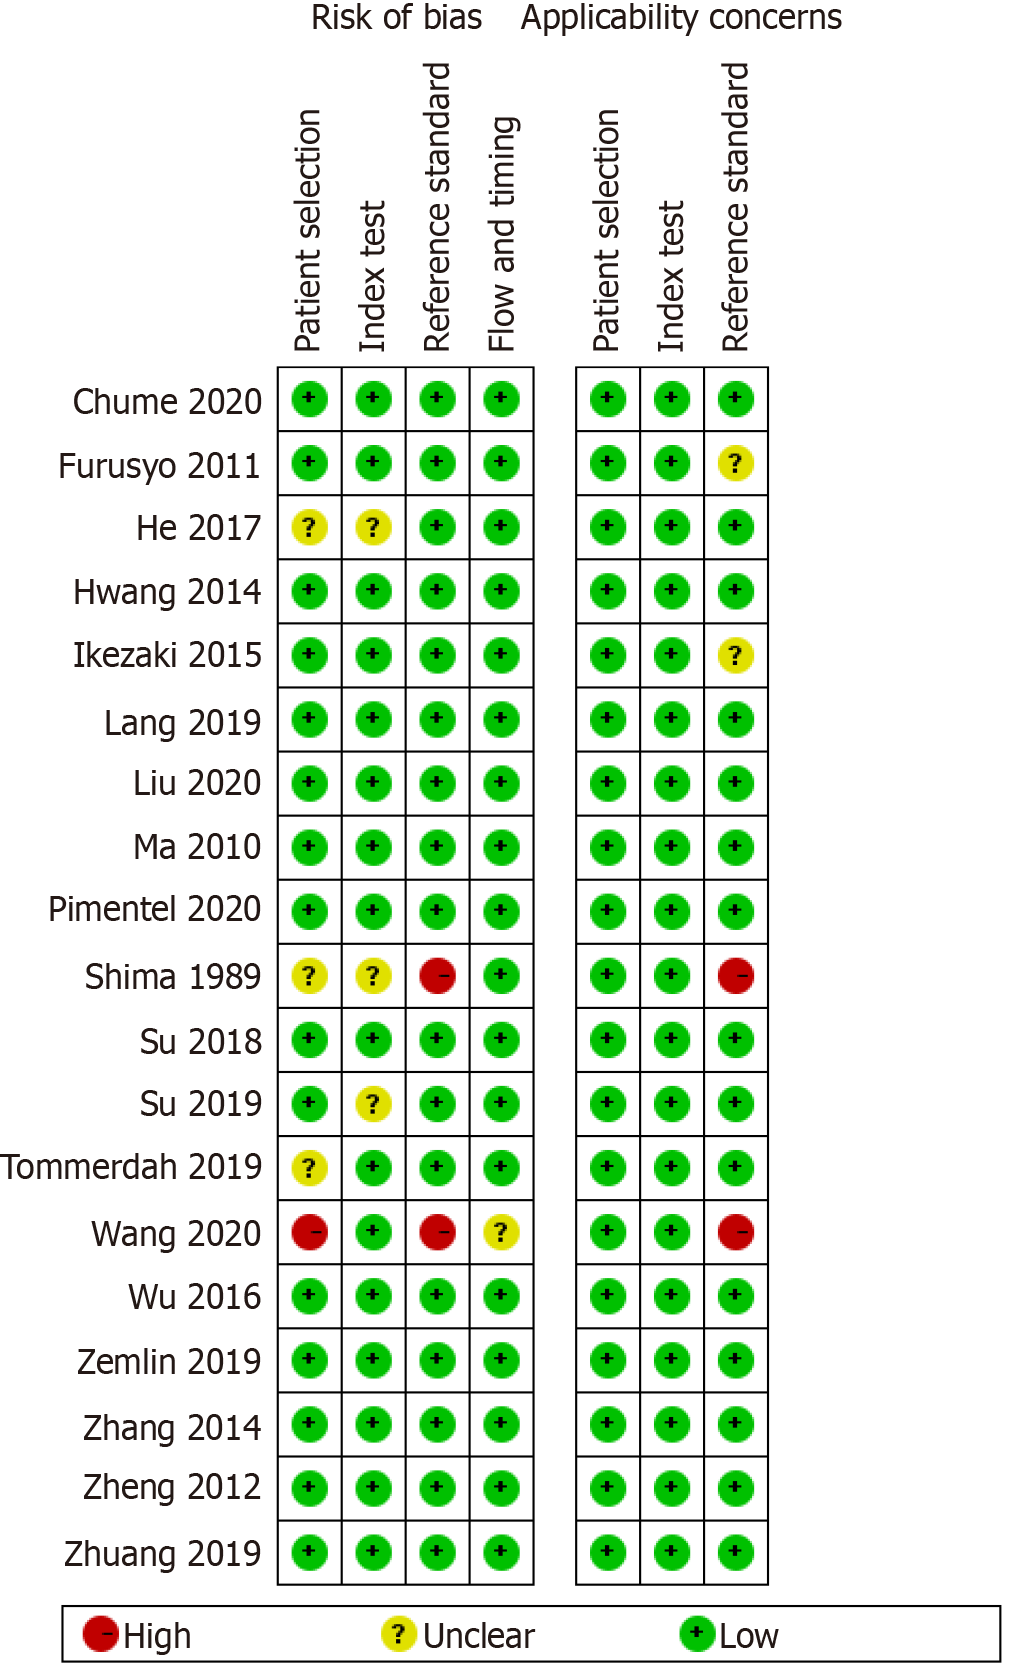
Figure 2 Risk of bias and applicability concerns summary: Review authors’ judgements about each domain for each included study.
Figure 3 Risk of bias and applicability concerns graph: Review authors’ judgements about each domain presented as percentages across included studies.
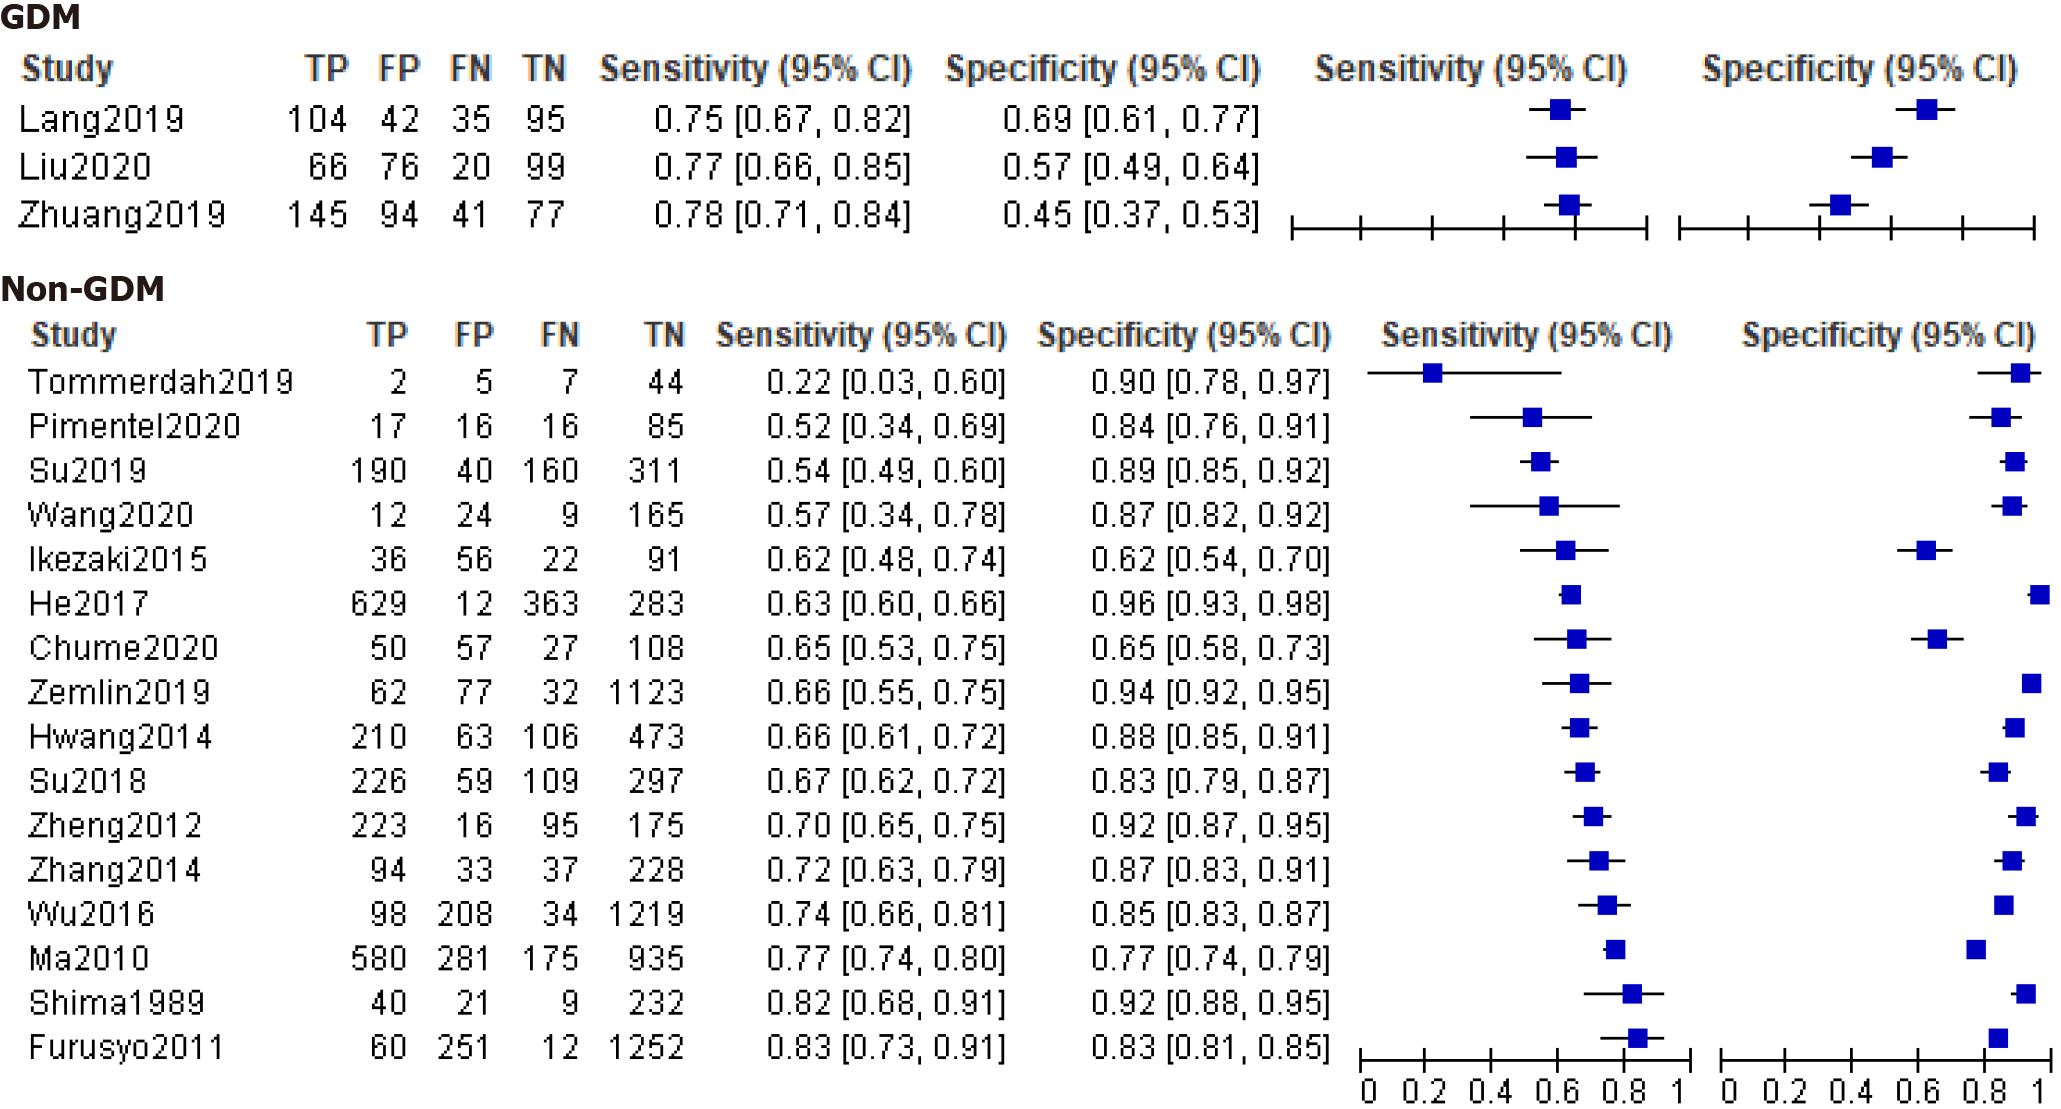
Figure 4 Forest plots of serum glycated albumin for diagnosis of gestational diabetes mellitus and non-gestational diabetes mellitus at different thresholds.
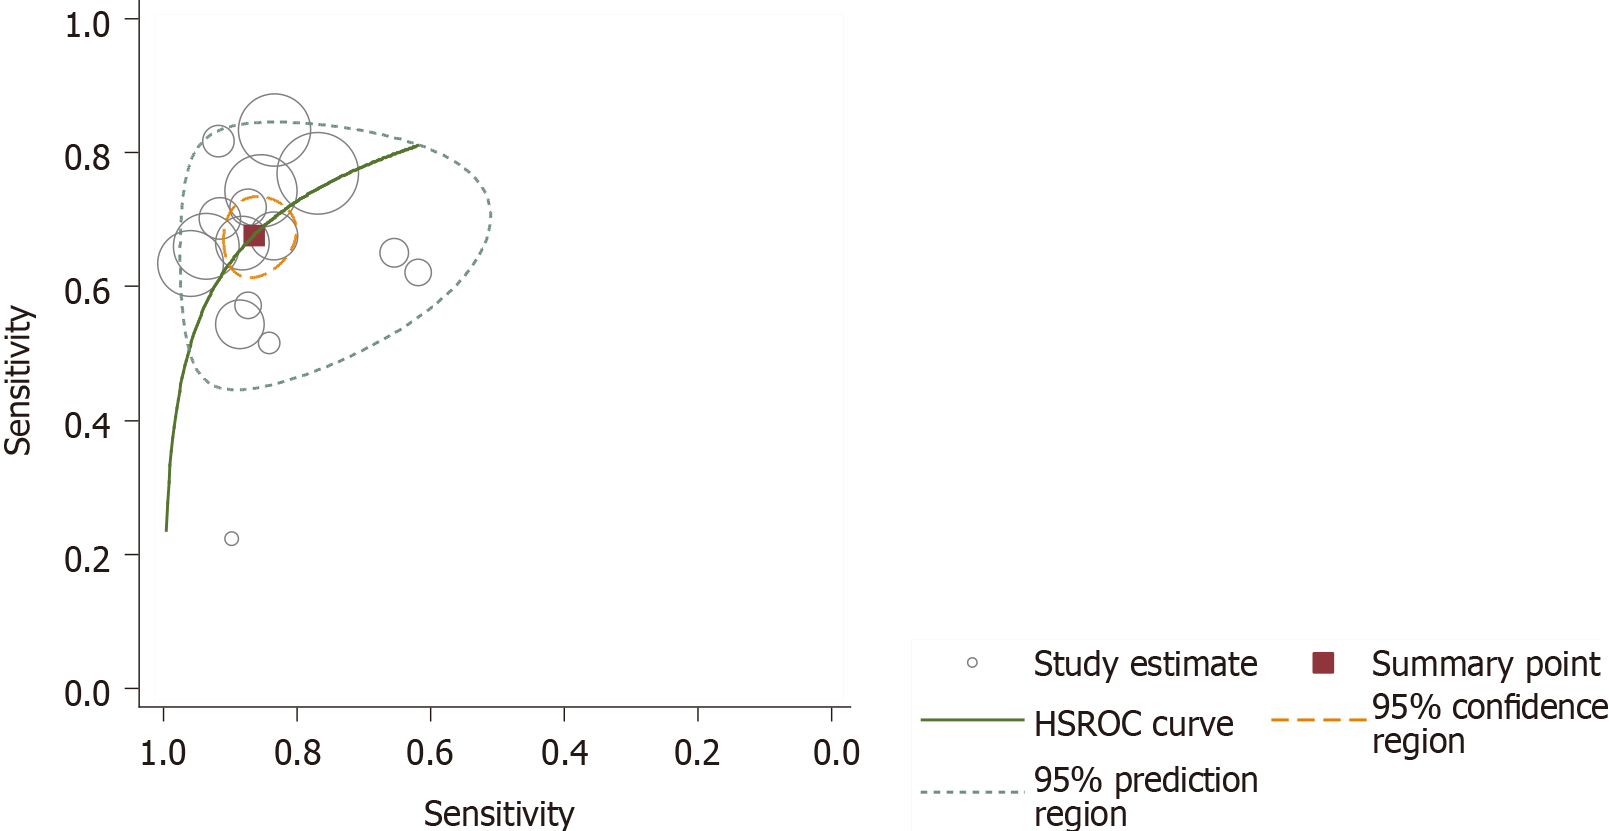
Figure 5 Summary receiver operating characteristic plot of plasma glycated albumin concentrations of non-gestational diabetes mellitus, using hierarchical summary receiver operating characteristic parameters.
HSROC: Hierarchical summary receiver operator characteristic curve.
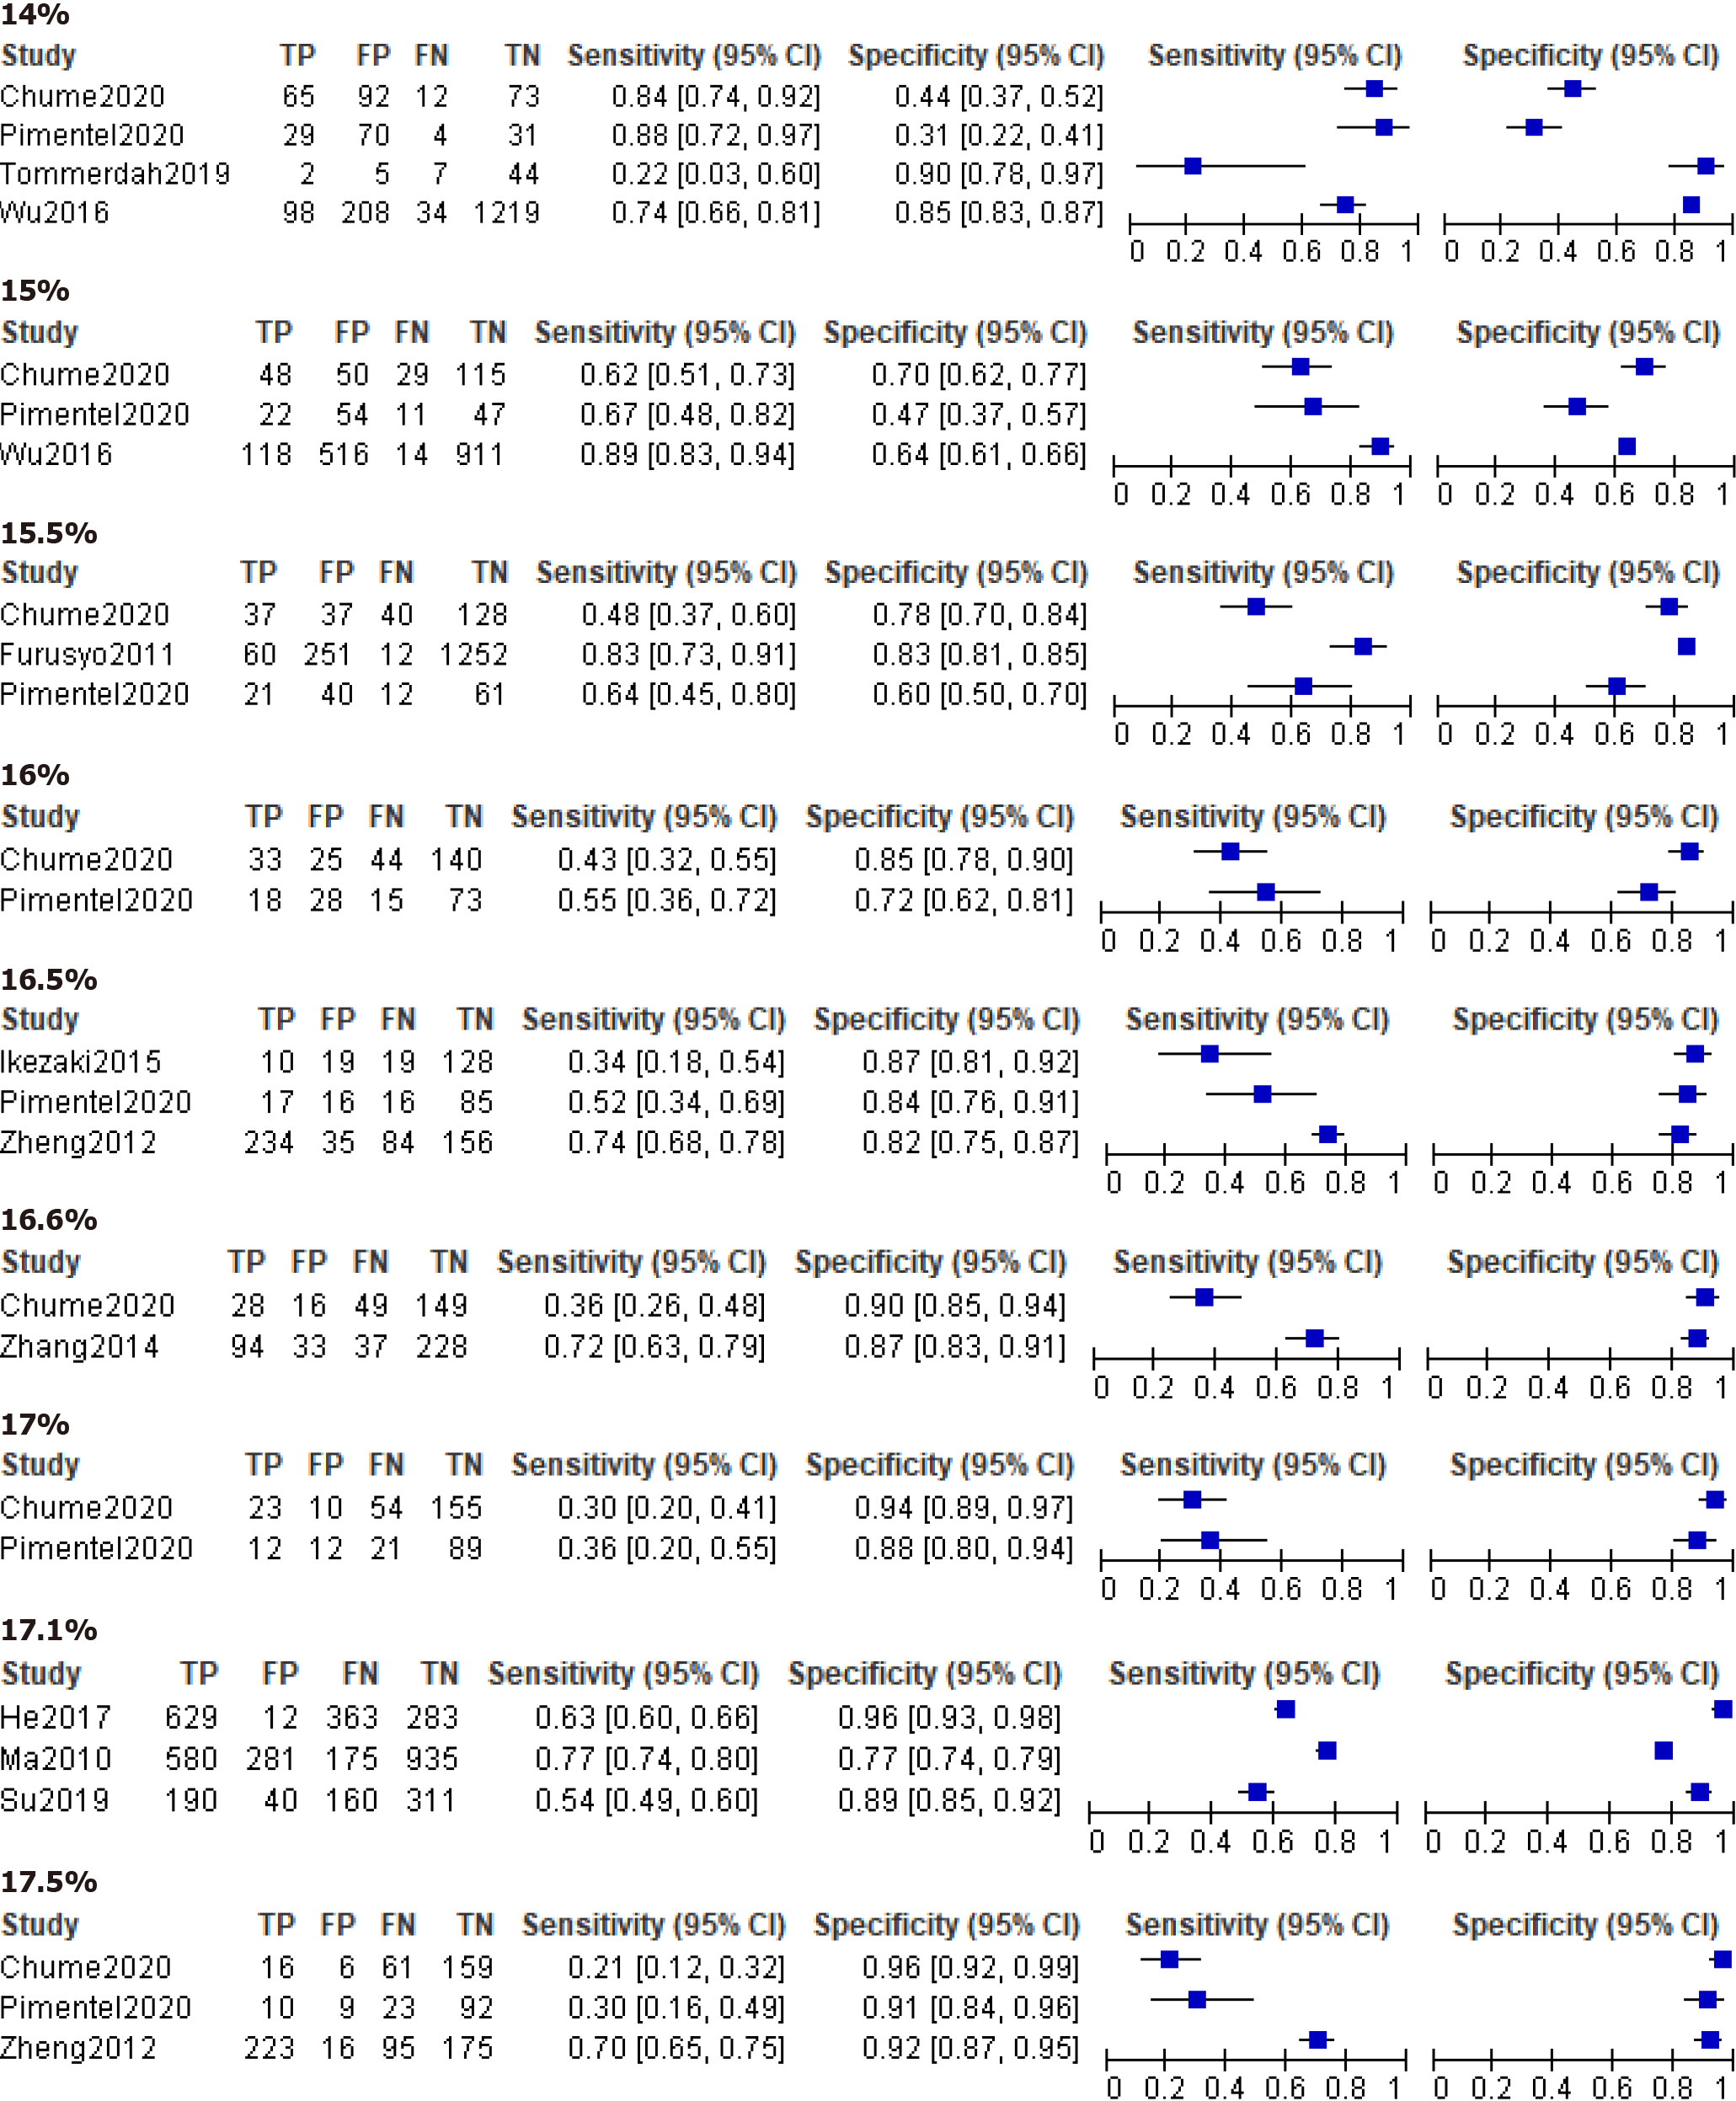
Figure 6 Forest plots of different cut-off values of plasma glycated albumin for diagnosis of non-gestational diabetes mellitus.
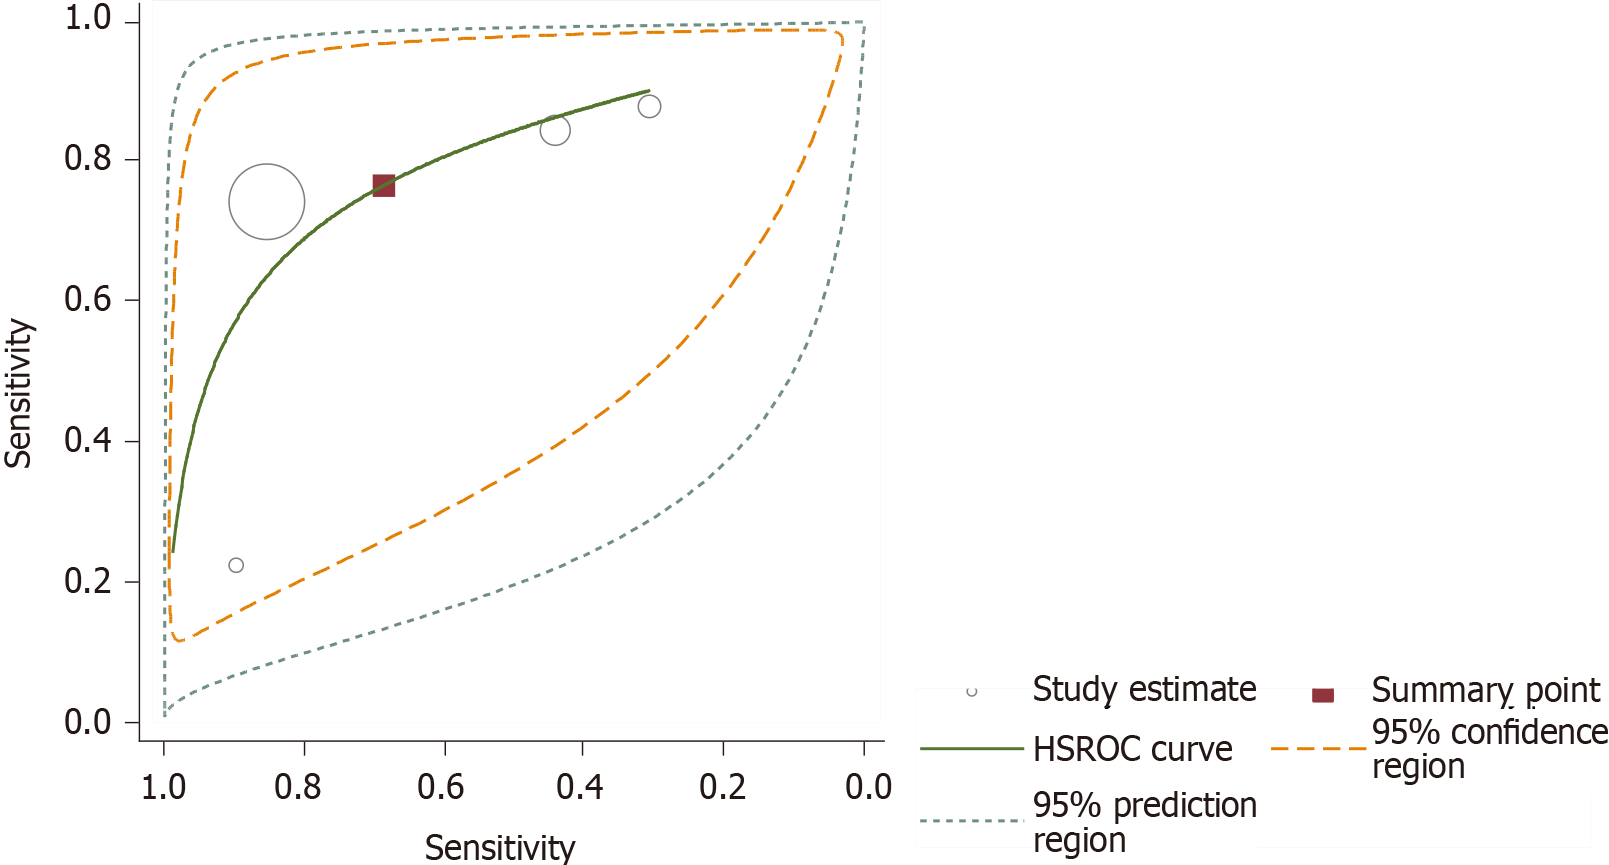
Figure 7 Summary receiver operating characteristic plot of plasma glycated albumin concentrations at 14.
0%, using hierarchical summary receiver operating characteristic parameters. HSROC: Hierarchical summary receiver operator characteristic curve.
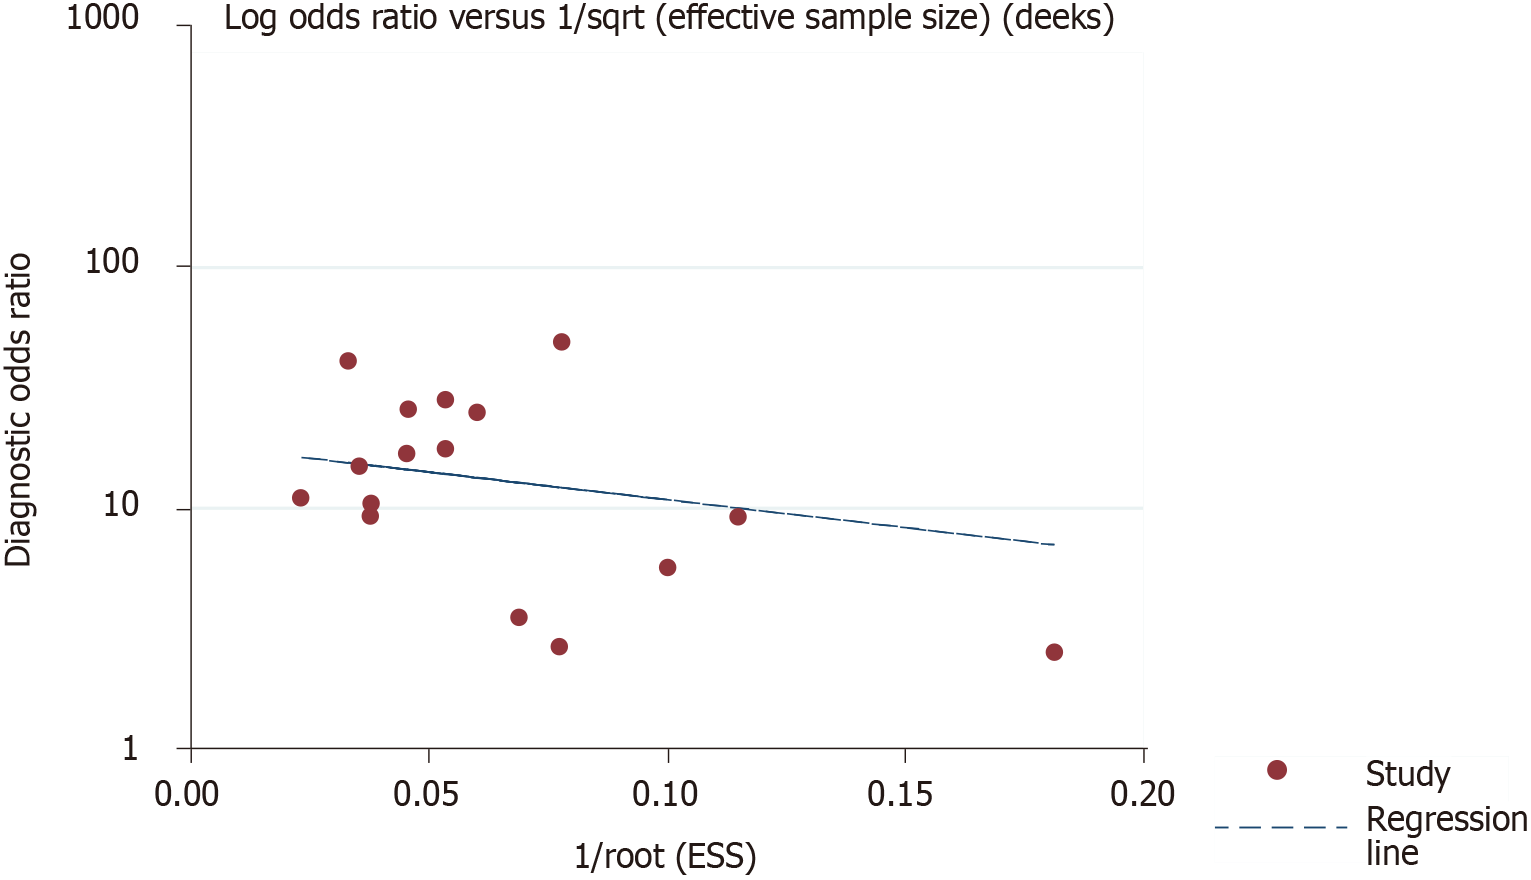
Figure 8 Deek’s funnel plot of included non-gestational diabetes mellitus studies.
- Citation: Xiong JY, Wang JM, Zhao XL, Yang C, Jiang XS, Chen YM, Chen CQ, Li ZY. Glycated albumin as a biomarker for diagnosis of diabetes mellitus: A systematic review and meta-analysis. World J Clin Cases 2021; 9(31): 9520-9534
- URL: https://www.wjgnet.com/2307-8960/full/v9/i31/9520.htm
- DOI: https://dx.doi.org/10.12998/wjcc.v9.i31.9520


