Copyright
©The Author(s) 2021.
World J Clin Cases. Nov 6, 2021; 9(31): 9491-9499
Published online Nov 6, 2021. doi: 10.12998/wjcc.v9.i31.9491
Published online Nov 6, 2021. doi: 10.12998/wjcc.v9.i31.9491
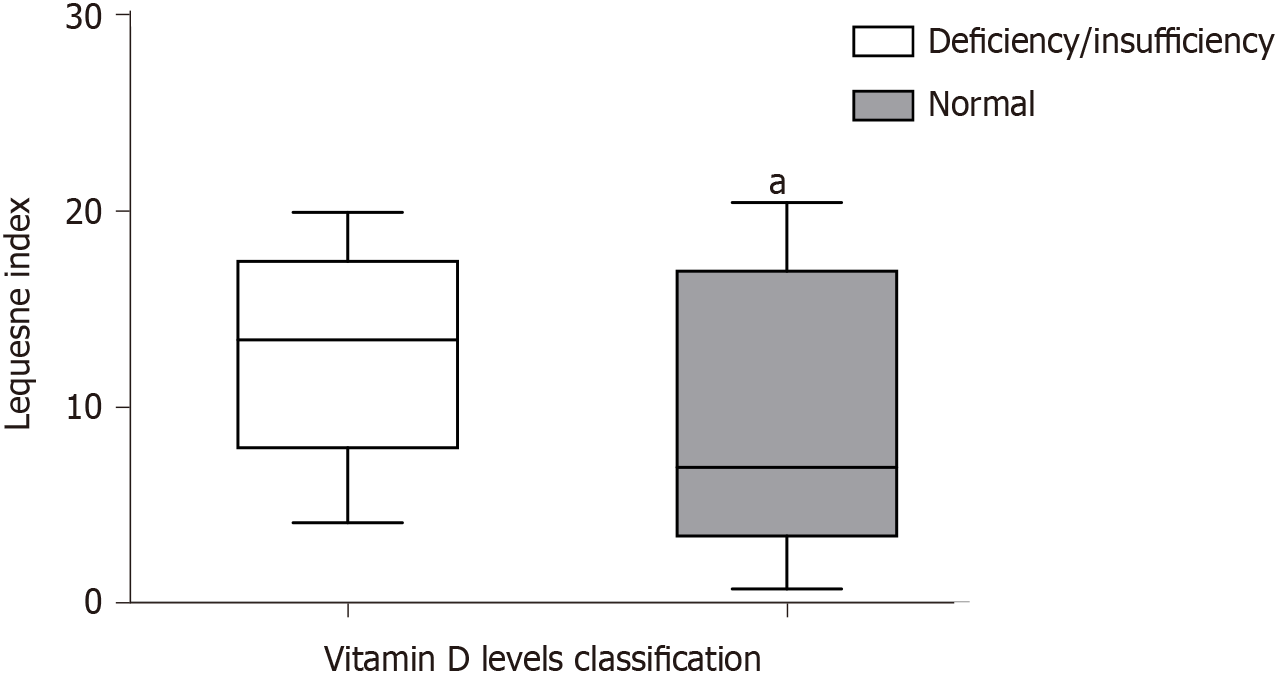
Figure 1 Comparison of functional status (analyzed with Lequesne index) of individuals with osteoarthritis in relation to vitamin D classification (deficiency/insufficiency and normal).
The boxplots represent the median with interquartile range. The error bars represent minimum and maximum values for each group. a Statistically different, Mann-Whitney test, P < 0.05.
Figure 2 Comparison of velocity (cm/s) of individuals with osteoarthritis in relation to vitamin D classification (deficiency/insufficiency and normal).
A: Antero-posterior velocity; B: Medio-lateral velocity. The boxplots represent the median with interquartile range. The error bars represent minimum and maximum values for each group. a Statistically different, Mann-Whitney test, P < 0.05. A/P: Anteroposterior; M/L: Mediolateral.
- Citation: Montemor CN, Fernandes MTP, Marquez AS, Poli-Frederico RC, da Silva RA, Fernandes KBP. Vitamin D deficiency, functional status, and balance in older adults with osteoarthritis. World J Clin Cases 2021; 9(31): 9491-9499
- URL: https://www.wjgnet.com/2307-8960/full/v9/i31/9491.htm
- DOI: https://dx.doi.org/10.12998/wjcc.v9.i31.9491


