Copyright
©The Author(s) 2021.
World J Clin Cases. Jan 26, 2021; 9(3): 639-643
Published online Jan 26, 2021. doi: 10.12998/wjcc.v9.i3.639
Published online Jan 26, 2021. doi: 10.12998/wjcc.v9.i3.639
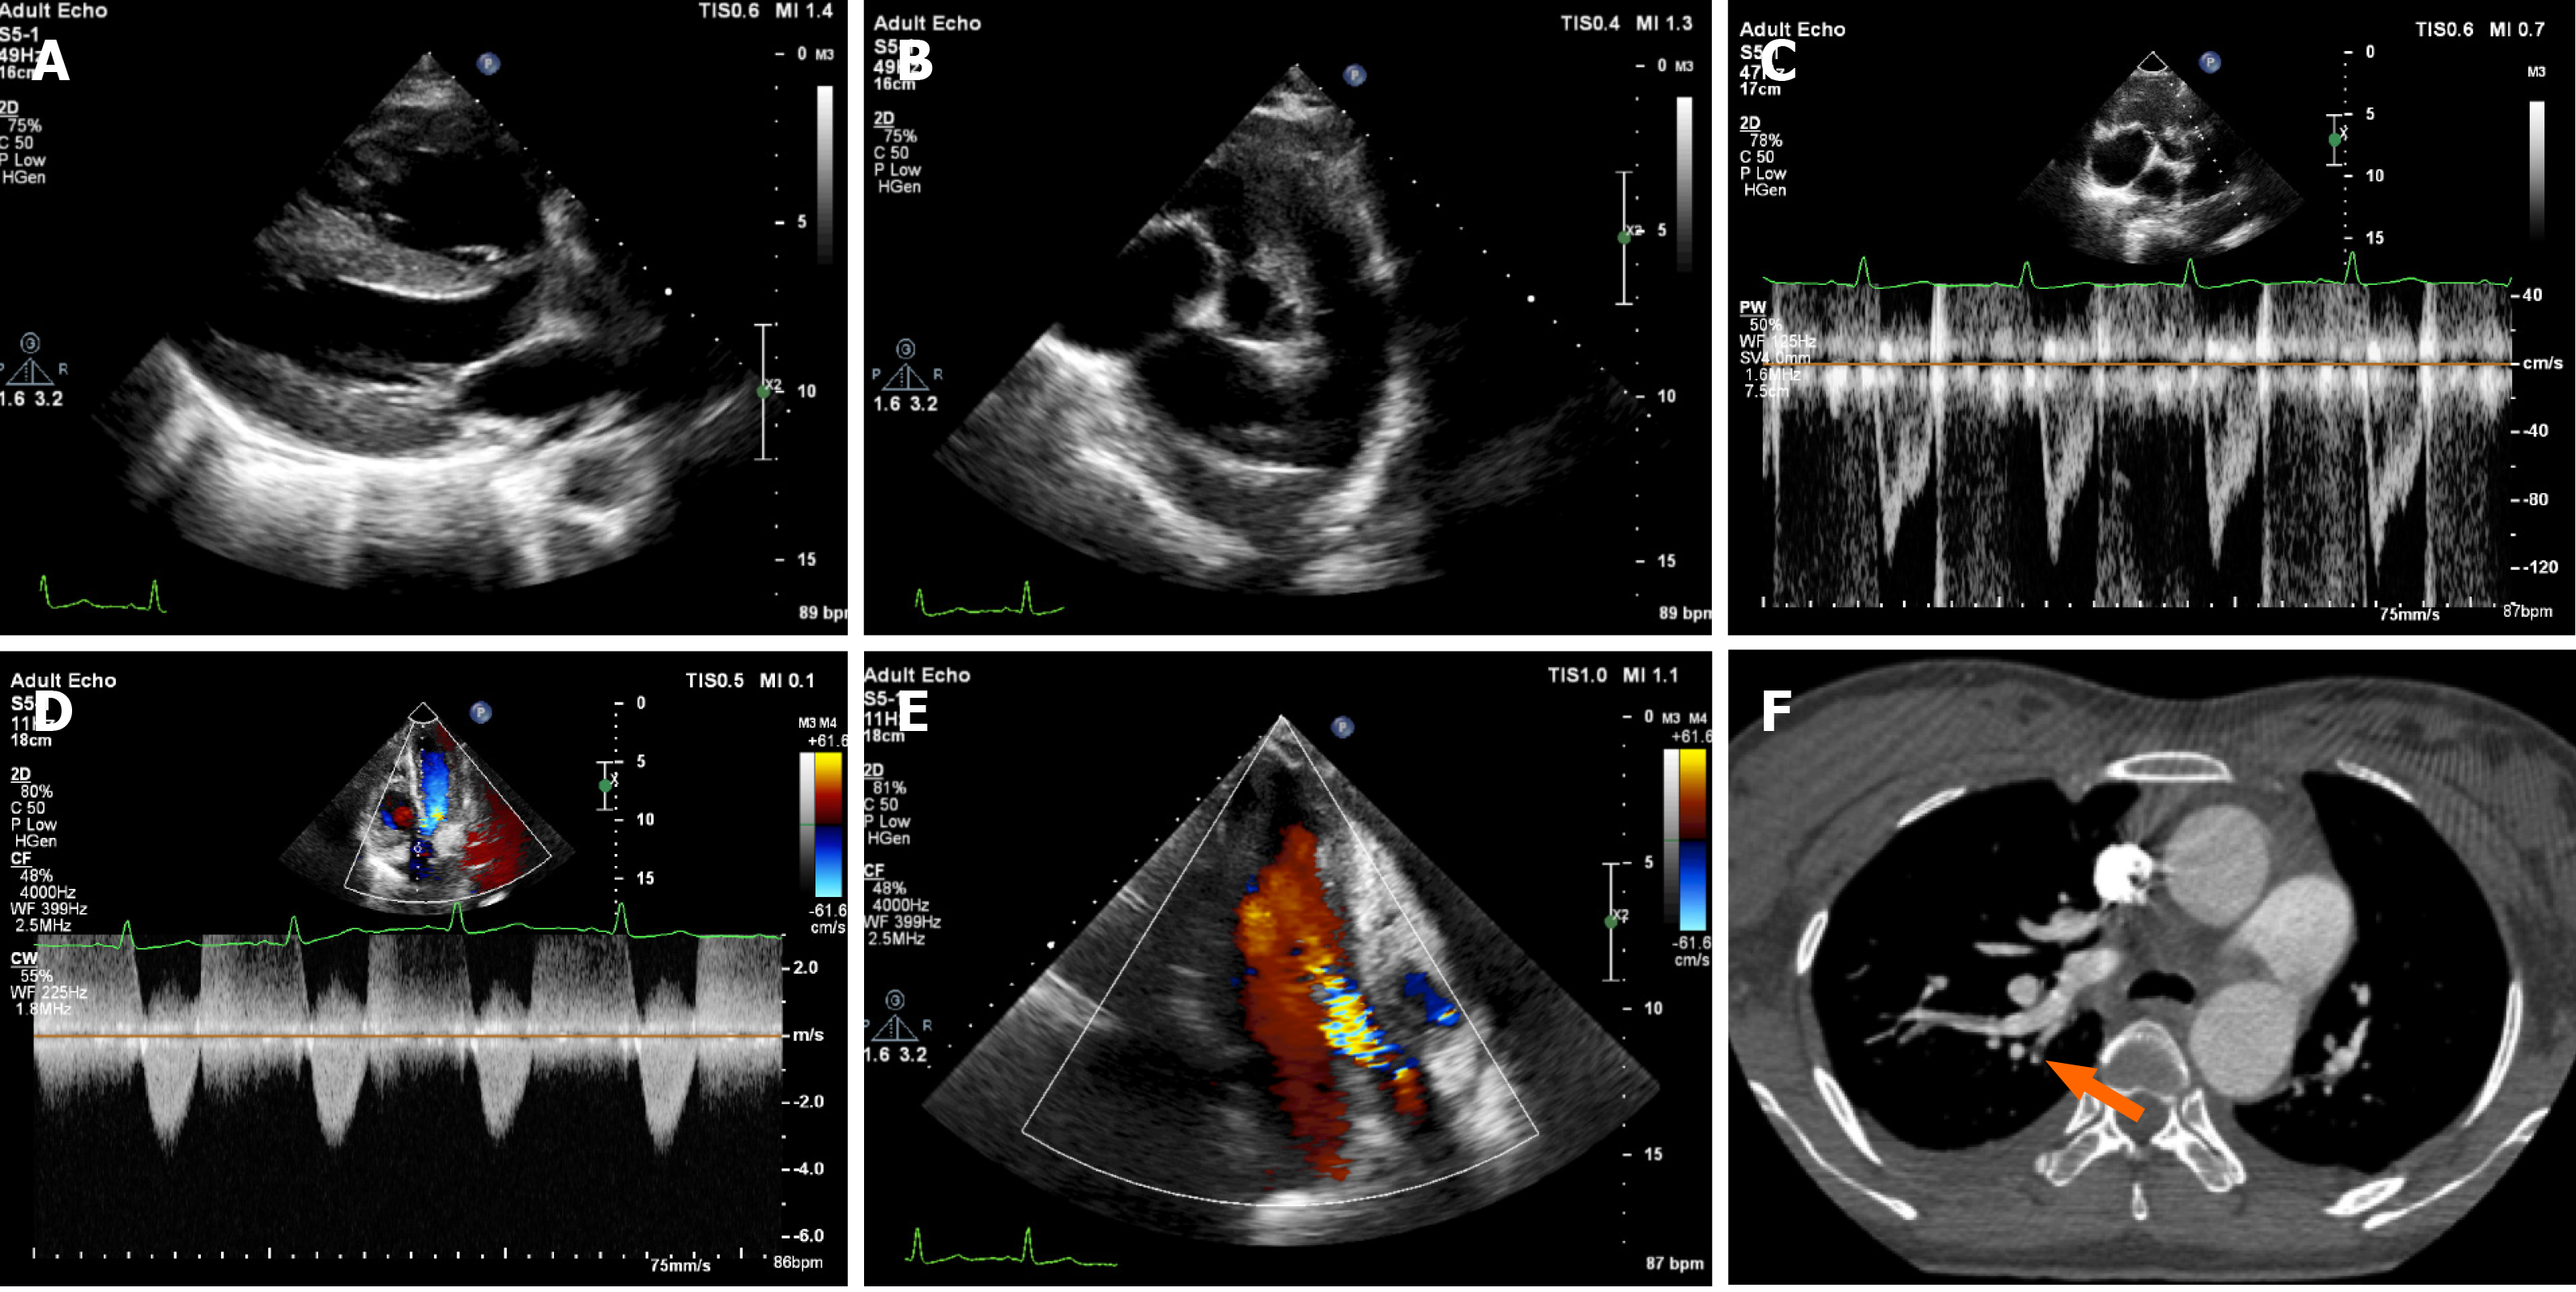
Figure 1 Imaging examinations during the first hospitalization.
A: Right ventricular enlargement (29 mm) and thickened right ventricular wall (9 mm); B: Dilated pulmonary artery (28 mm); C: Shortening of pulmonary artery forward blood flow spectrum acceleration time (74 ms). The spectrum form was "fist indication" with visible incisure; D: Mild aortic stenosis (Vmax = 336 cm/s; pressure gradient = 45 mmHg); E: Moderate aortic insufficiency; F: Computed tomography angiography showing pulmonary artery branch embolism (arrow denotes a filling defect).
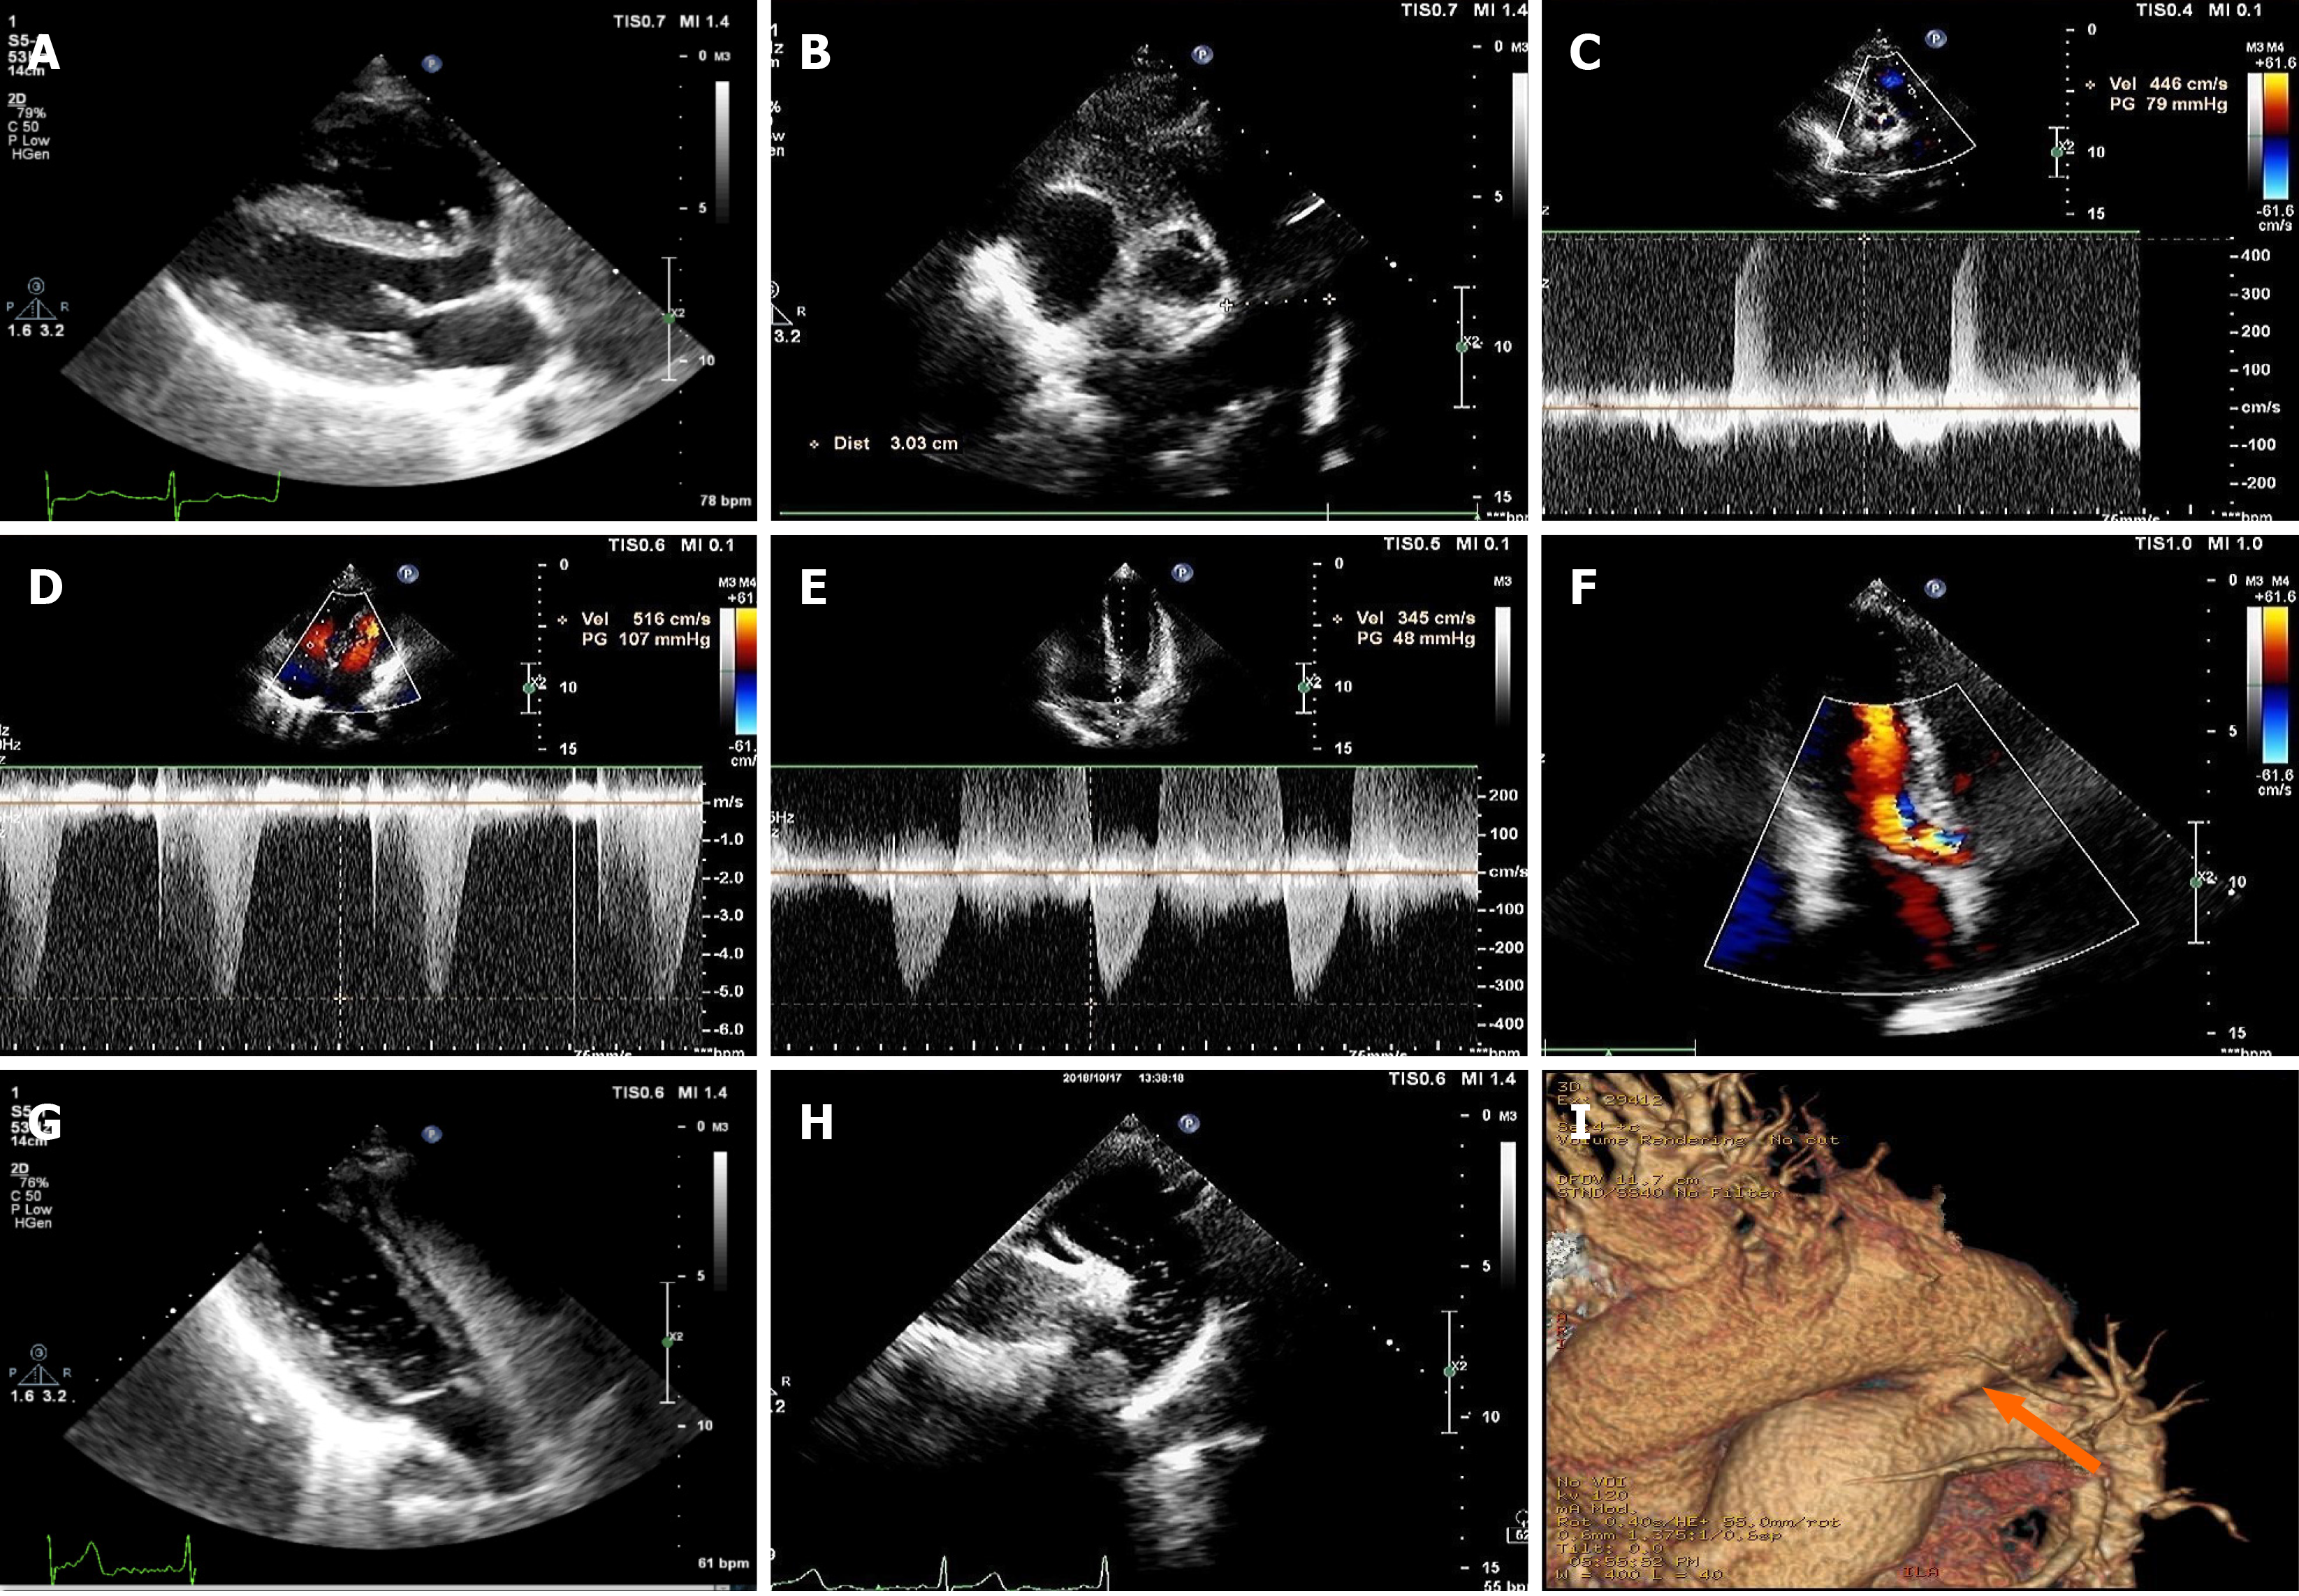
Figure 2 Imaging examinations during the second hospitalization.
A: Right ventricular enlargement (29 mm) and thickened right ventricular wall (8 mm); B: Dilated pulmonary artery (30 mm); C: Mild pulmonary valve regurgitation (peak flow rate of early diastolic regurgitation V = 446 cm/s; pressure gradient = 79 mmHg; average pulmonary artery pressure approximately 87 mmHg); D: Mild tricuspid regurgitation (Vmax = 516 cm/s; pressure gradient = 107 mmHg; pulmonary artery systolic pressure approximately 115 mmHg); E: Mild aortic stenosis (Vmax = 345 cm/s; pressure gradient = 48 mmHg); F: Moderate aortic insufficiency; G: Right heart contrast echocardiography. At the parasternal four-chamber section, microbubbles can be seen in the right atrium, right ventricle, and left ventricle. There were no microbubbles in the left atrium; H: Right heart contrast echocardiography. At the long axial section of the suprasternal aortic arch, many microbubbles could be seen in the descending aorta; I: Computed tomography angiography showing a patent ductus arteriosus (arrow denotes tubular traffic between the descending aorta and pulmonary artery).
- Citation: Chen JL, Mei DE, Yu CG, Zhao ZY. Right-heart contrast echocardiography reveals missed patent ductus arteriosus in a postpartum woman with pulmonary embolism: A case report. World J Clin Cases 2021; 9(3): 639-643
- URL: https://www.wjgnet.com/2307-8960/full/v9/i3/639.htm
- DOI: https://dx.doi.org/10.12998/wjcc.v9.i3.639


