Copyright
©The Author(s) 2021.
World J Clin Cases. Jan 26, 2021; 9(3): 581-601
Published online Jan 26, 2021. doi: 10.12998/wjcc.v9.i3.581
Published online Jan 26, 2021. doi: 10.12998/wjcc.v9.i3.581
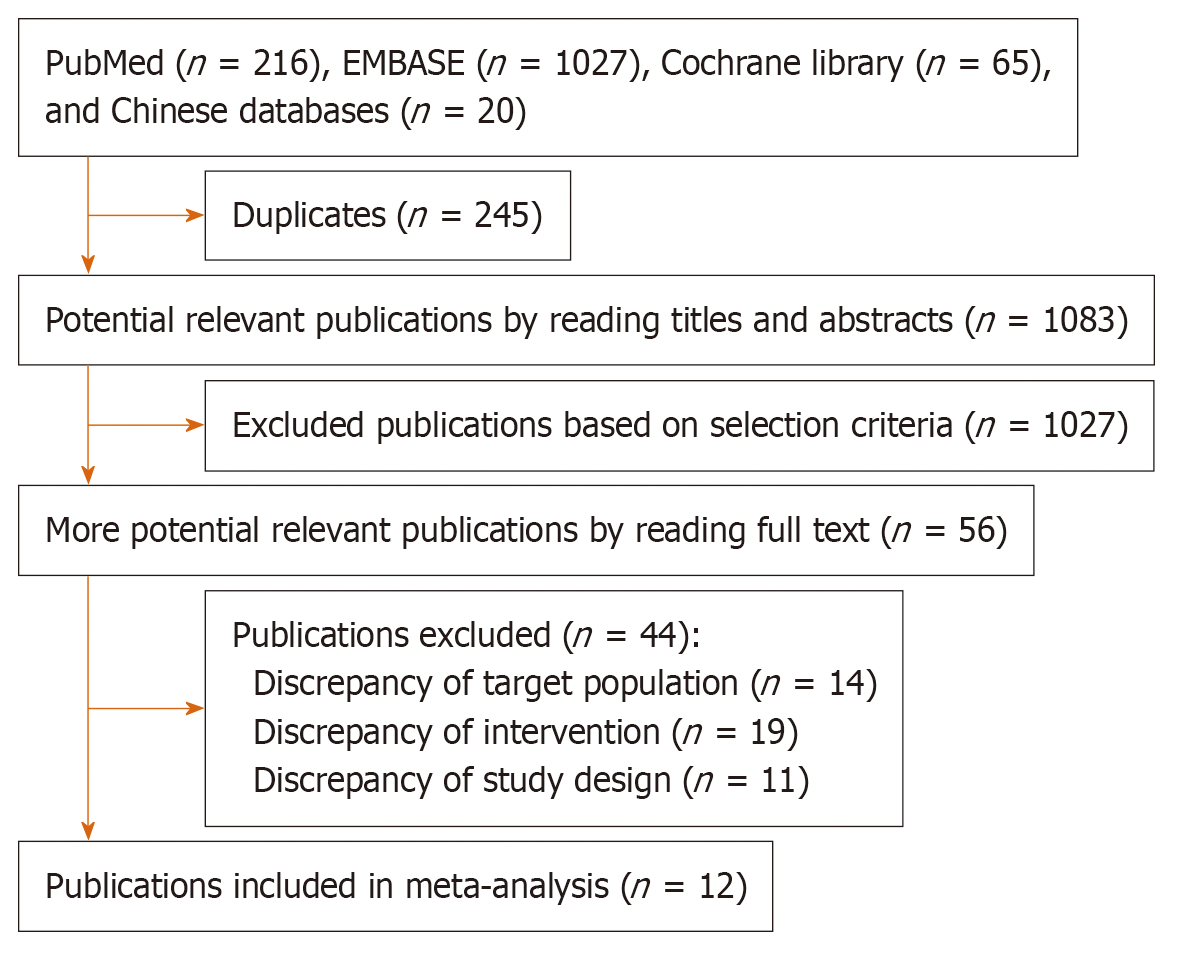
Figure 1 Summary of trial identification and selection.
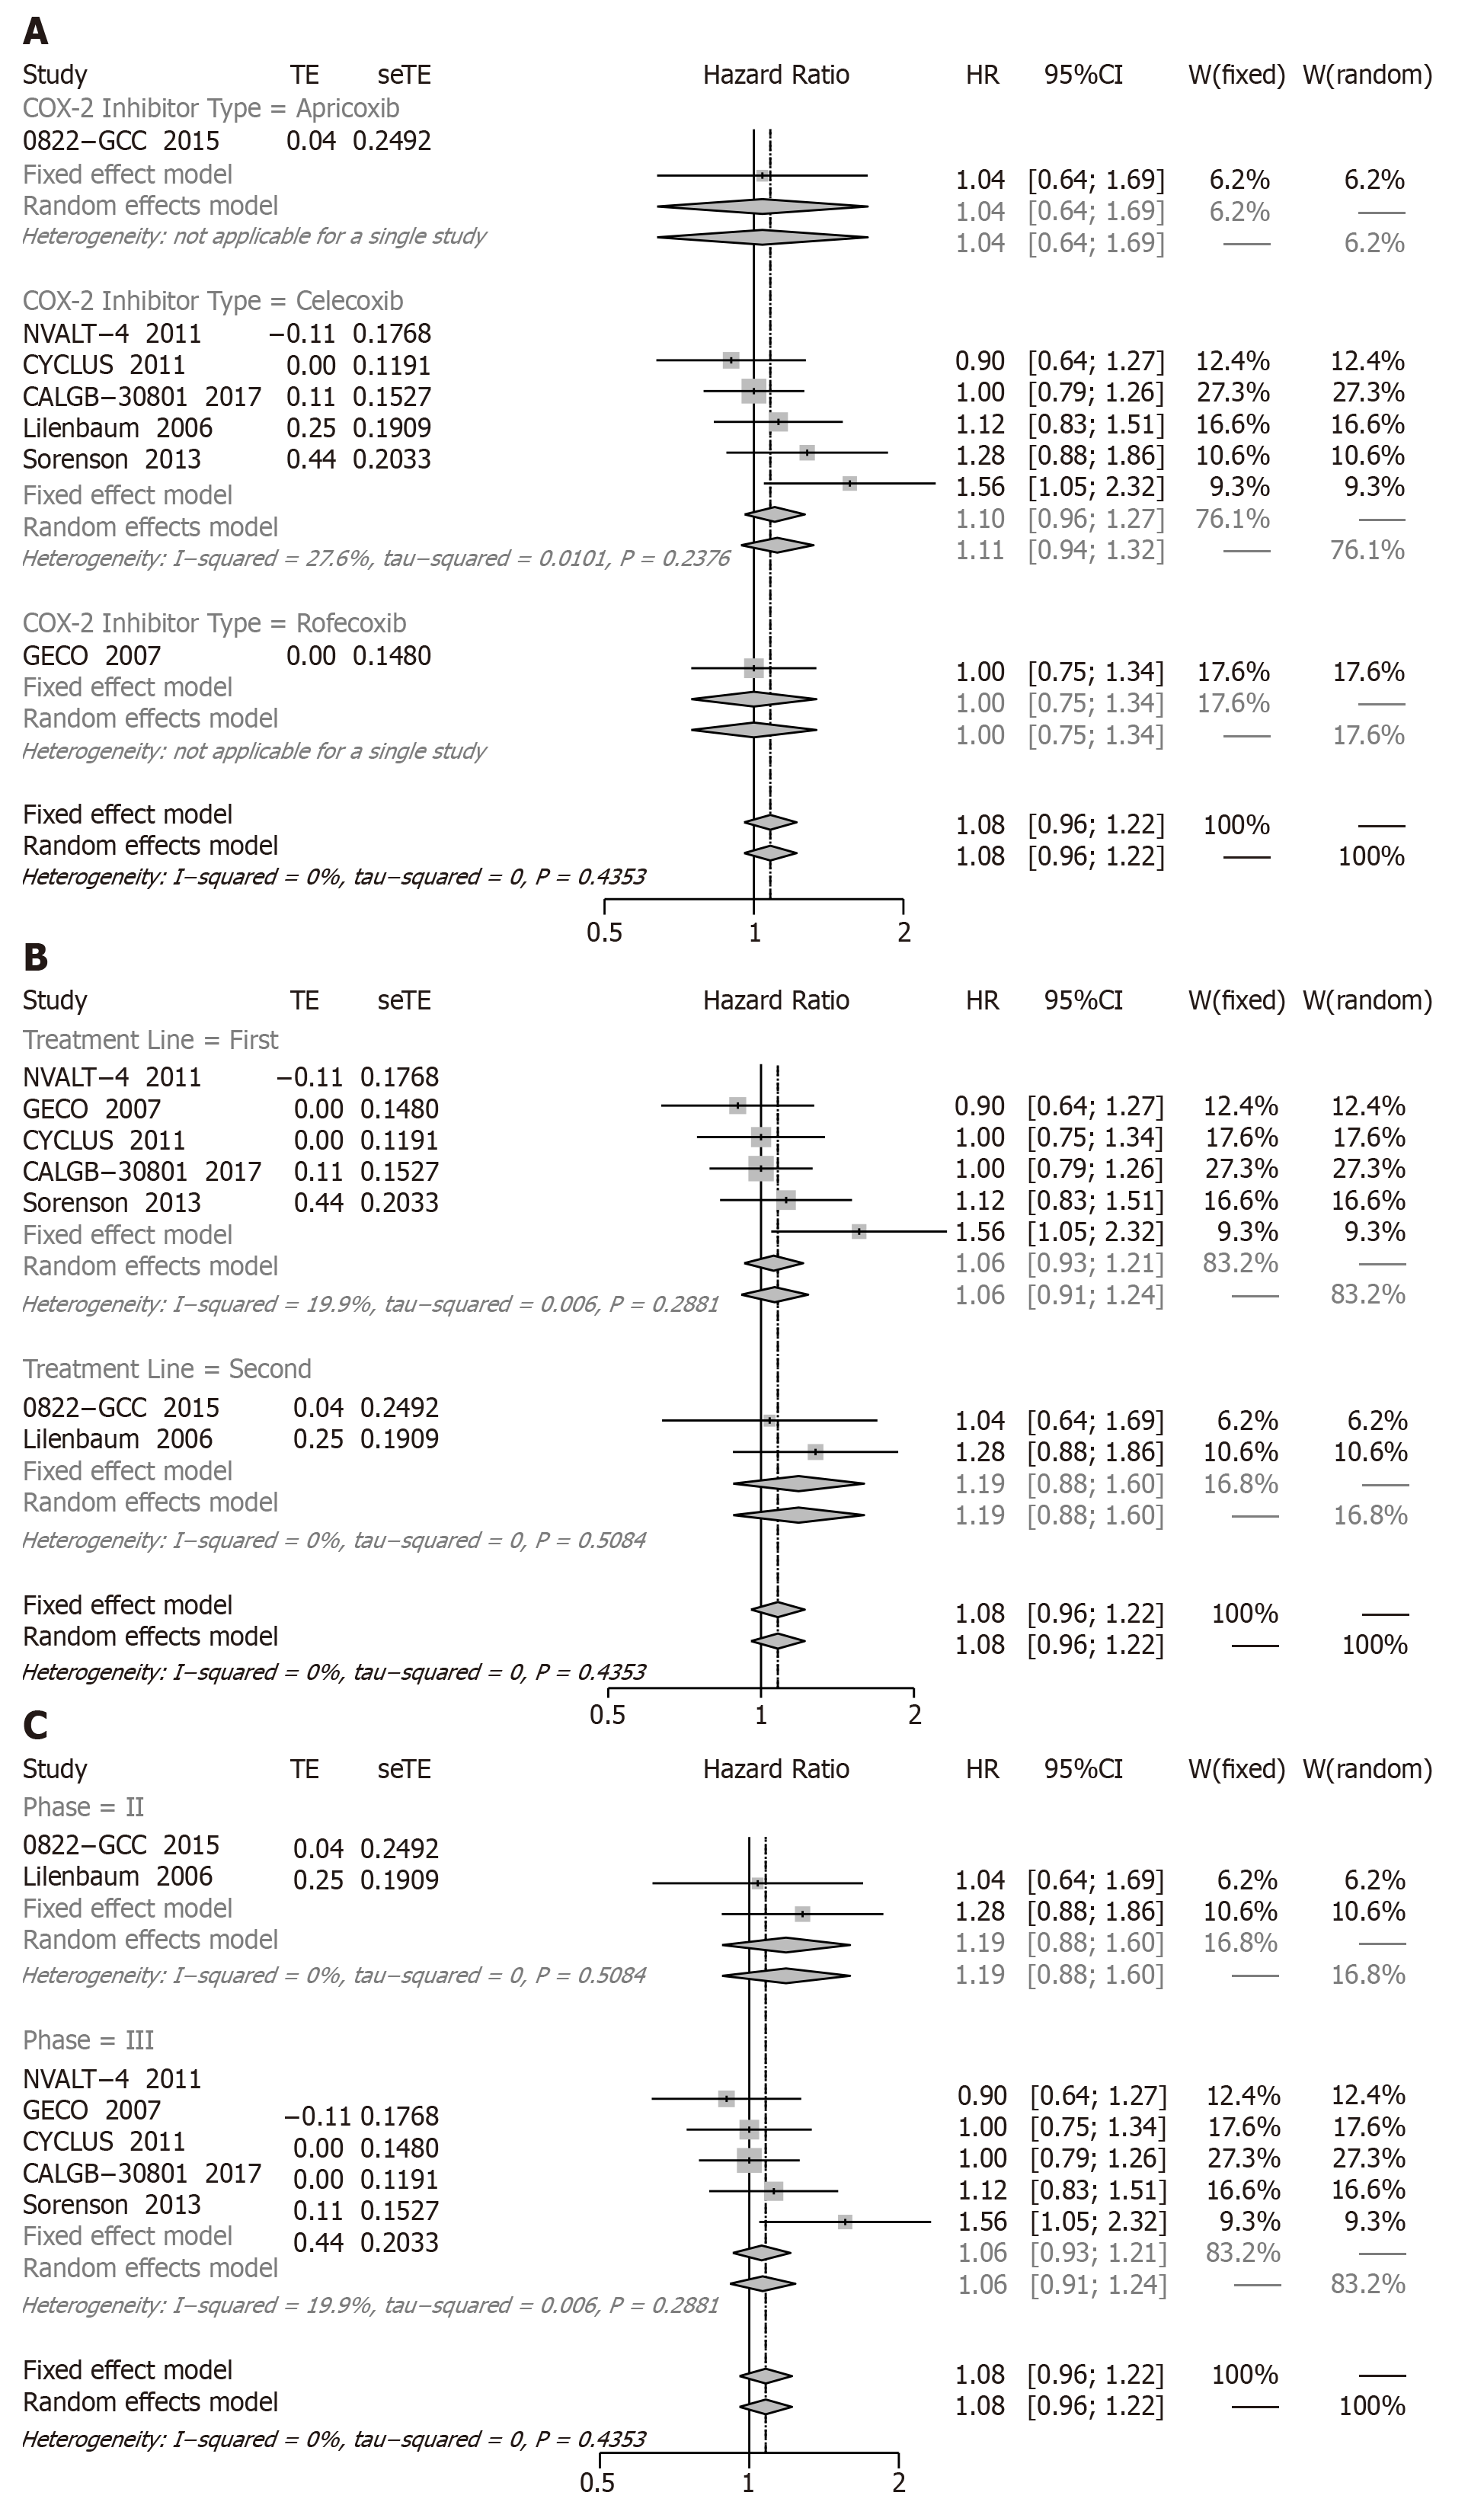
Figure 2 Subgroup analyses of forest plot for overall survival.
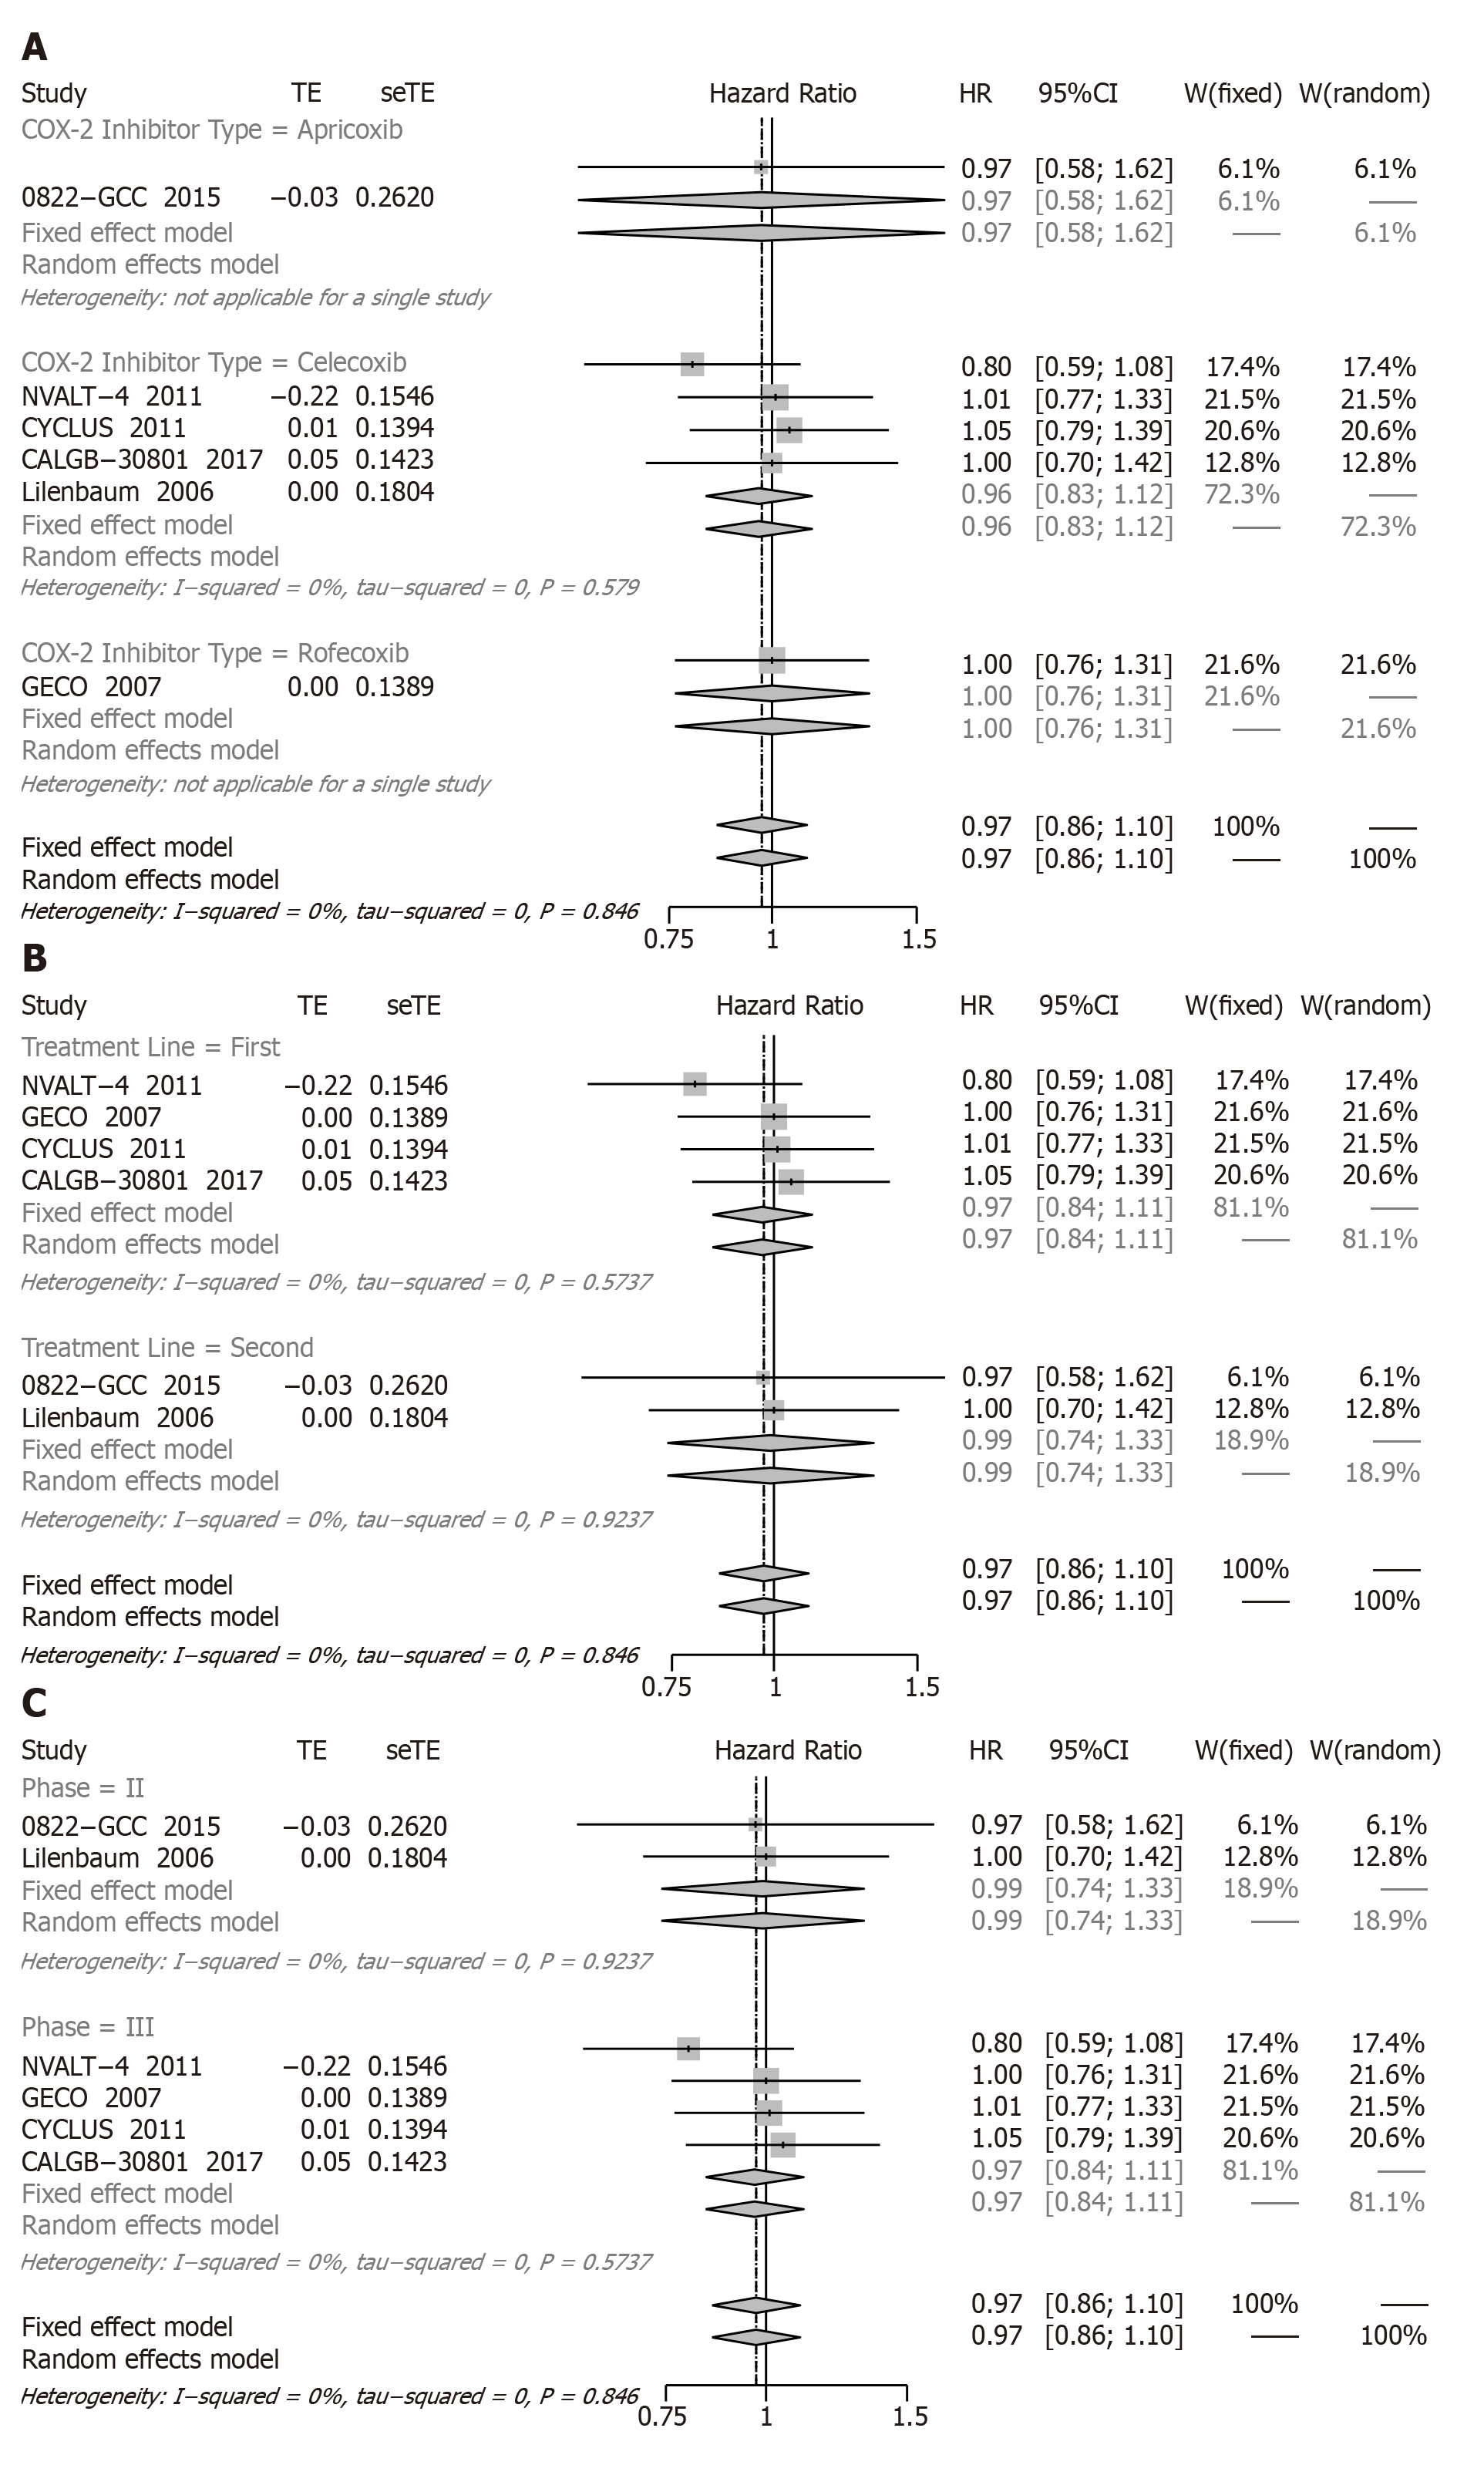
Figure 3 Subgroup analyses of forest plot for progression free survival.
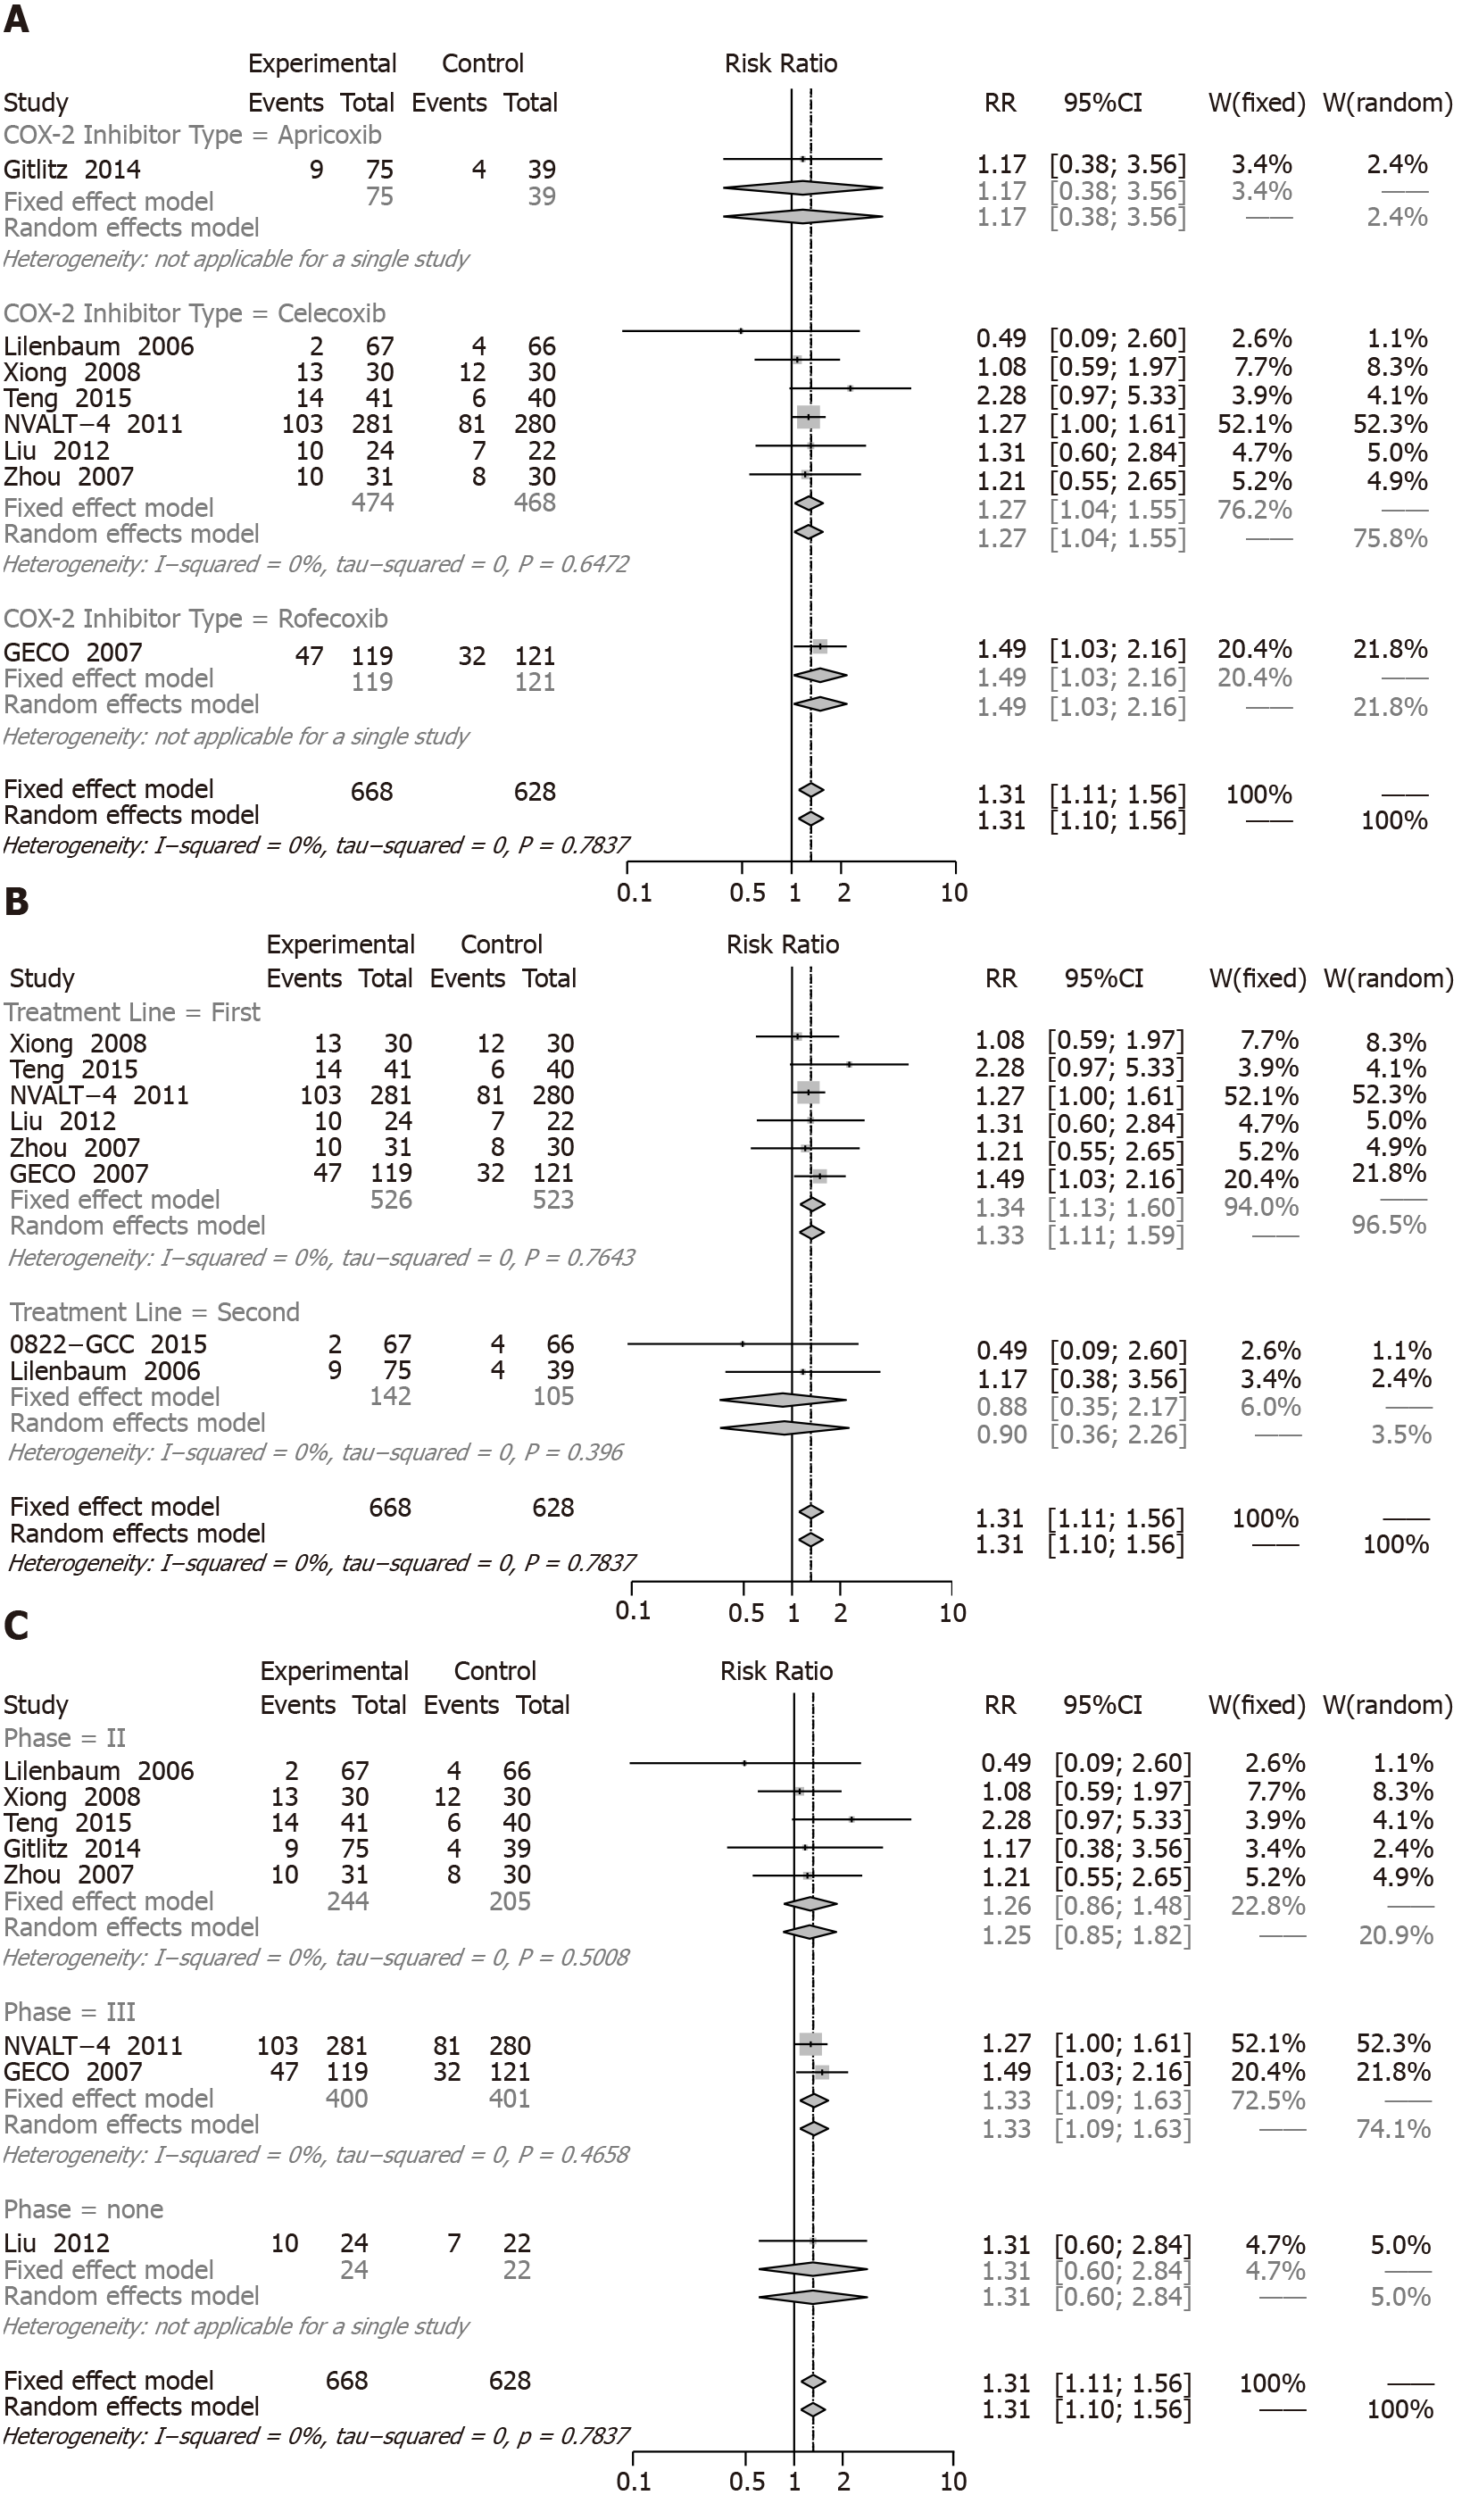
Figure 4 Subgroup analyses of forest plot for 1-year survival rate.
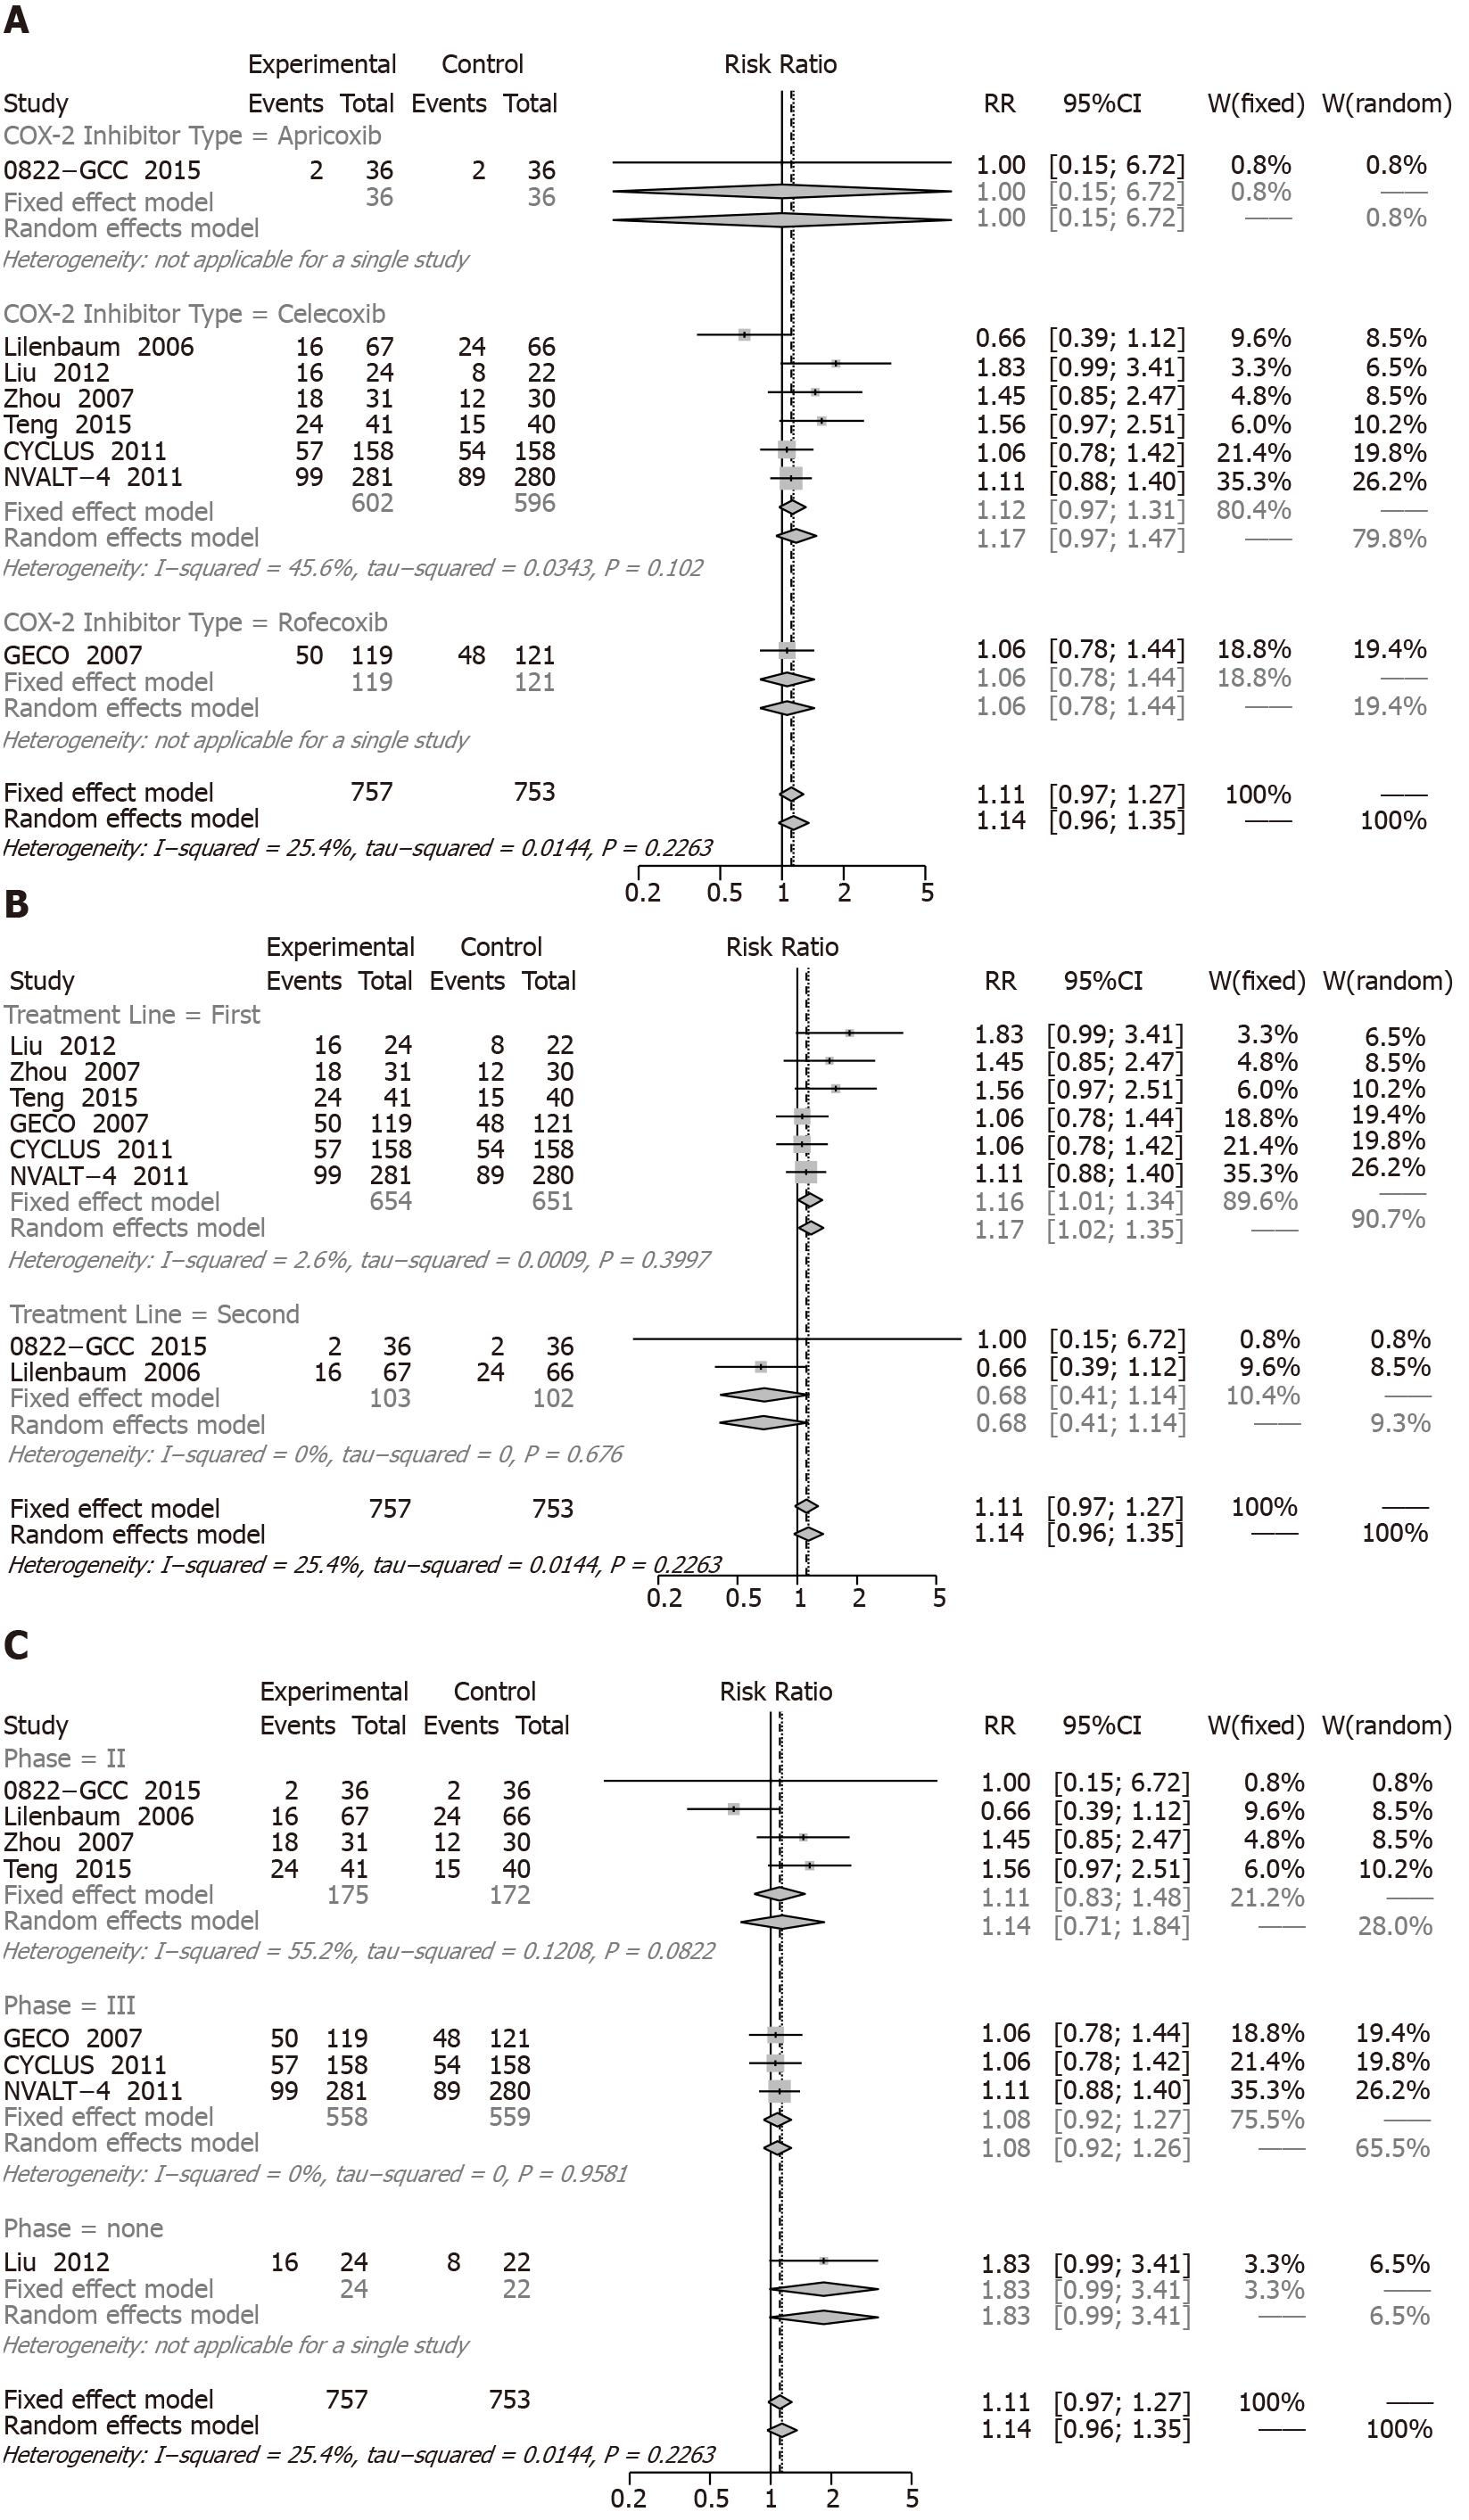
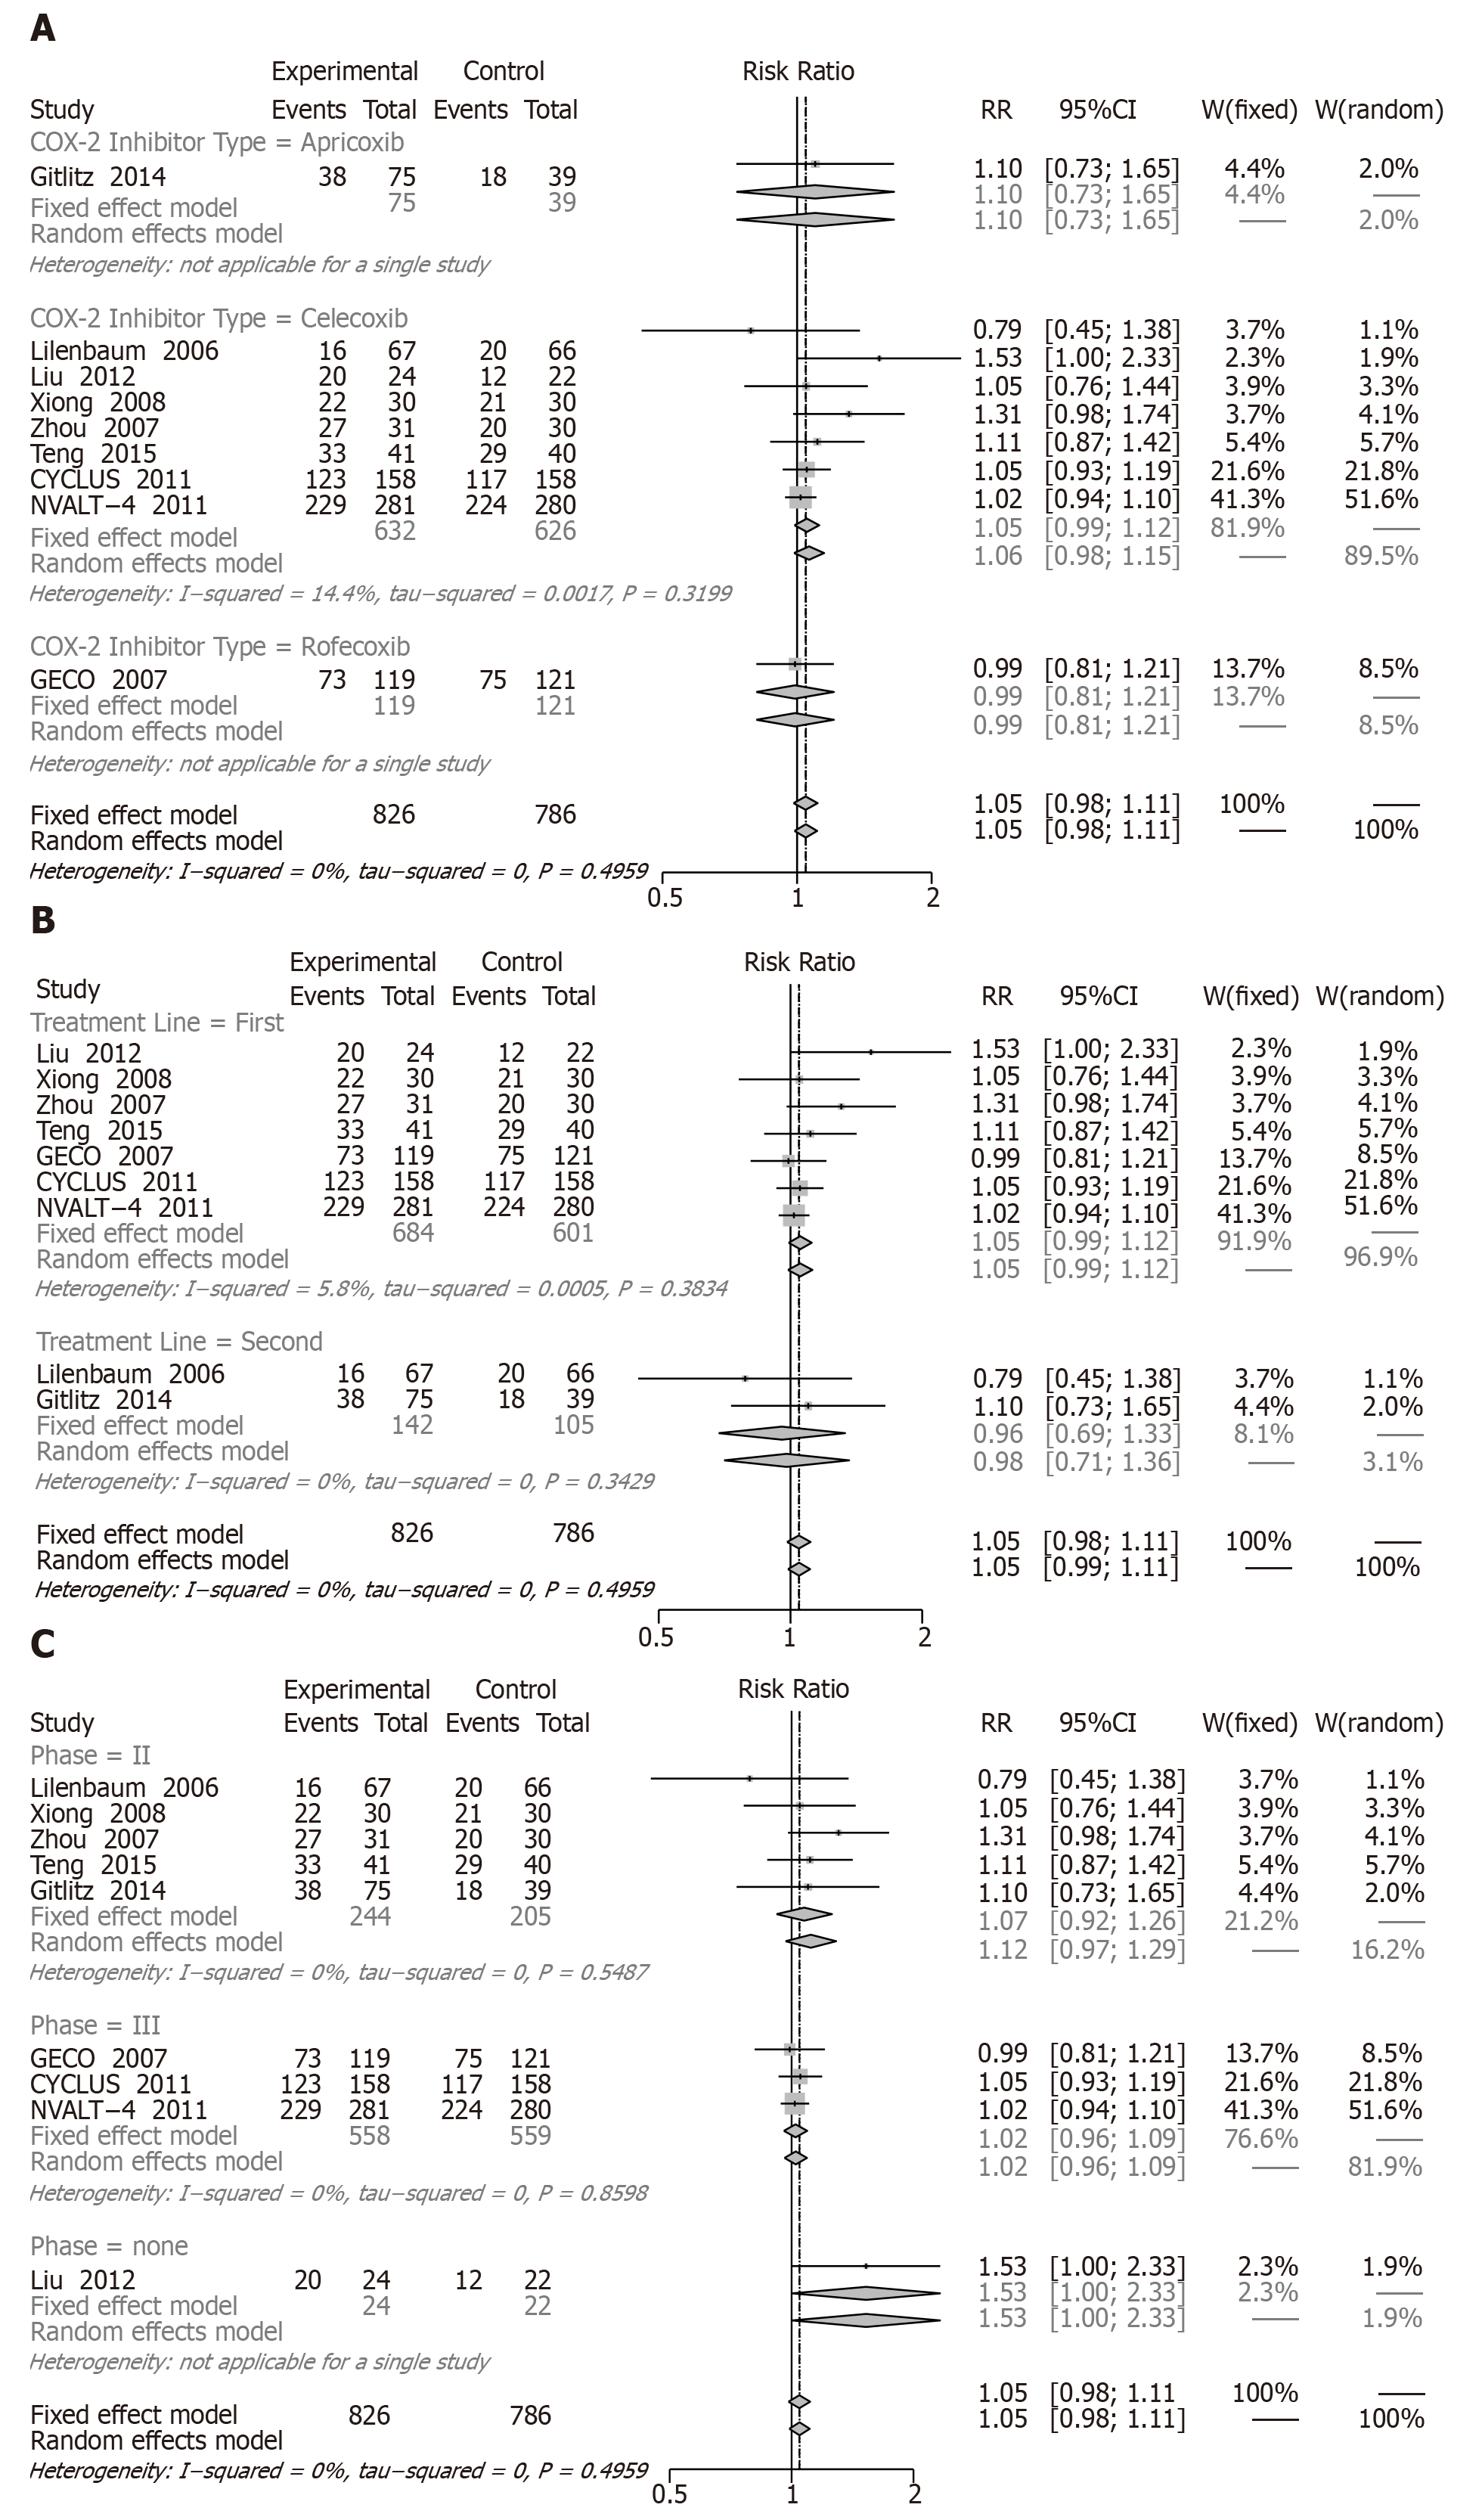
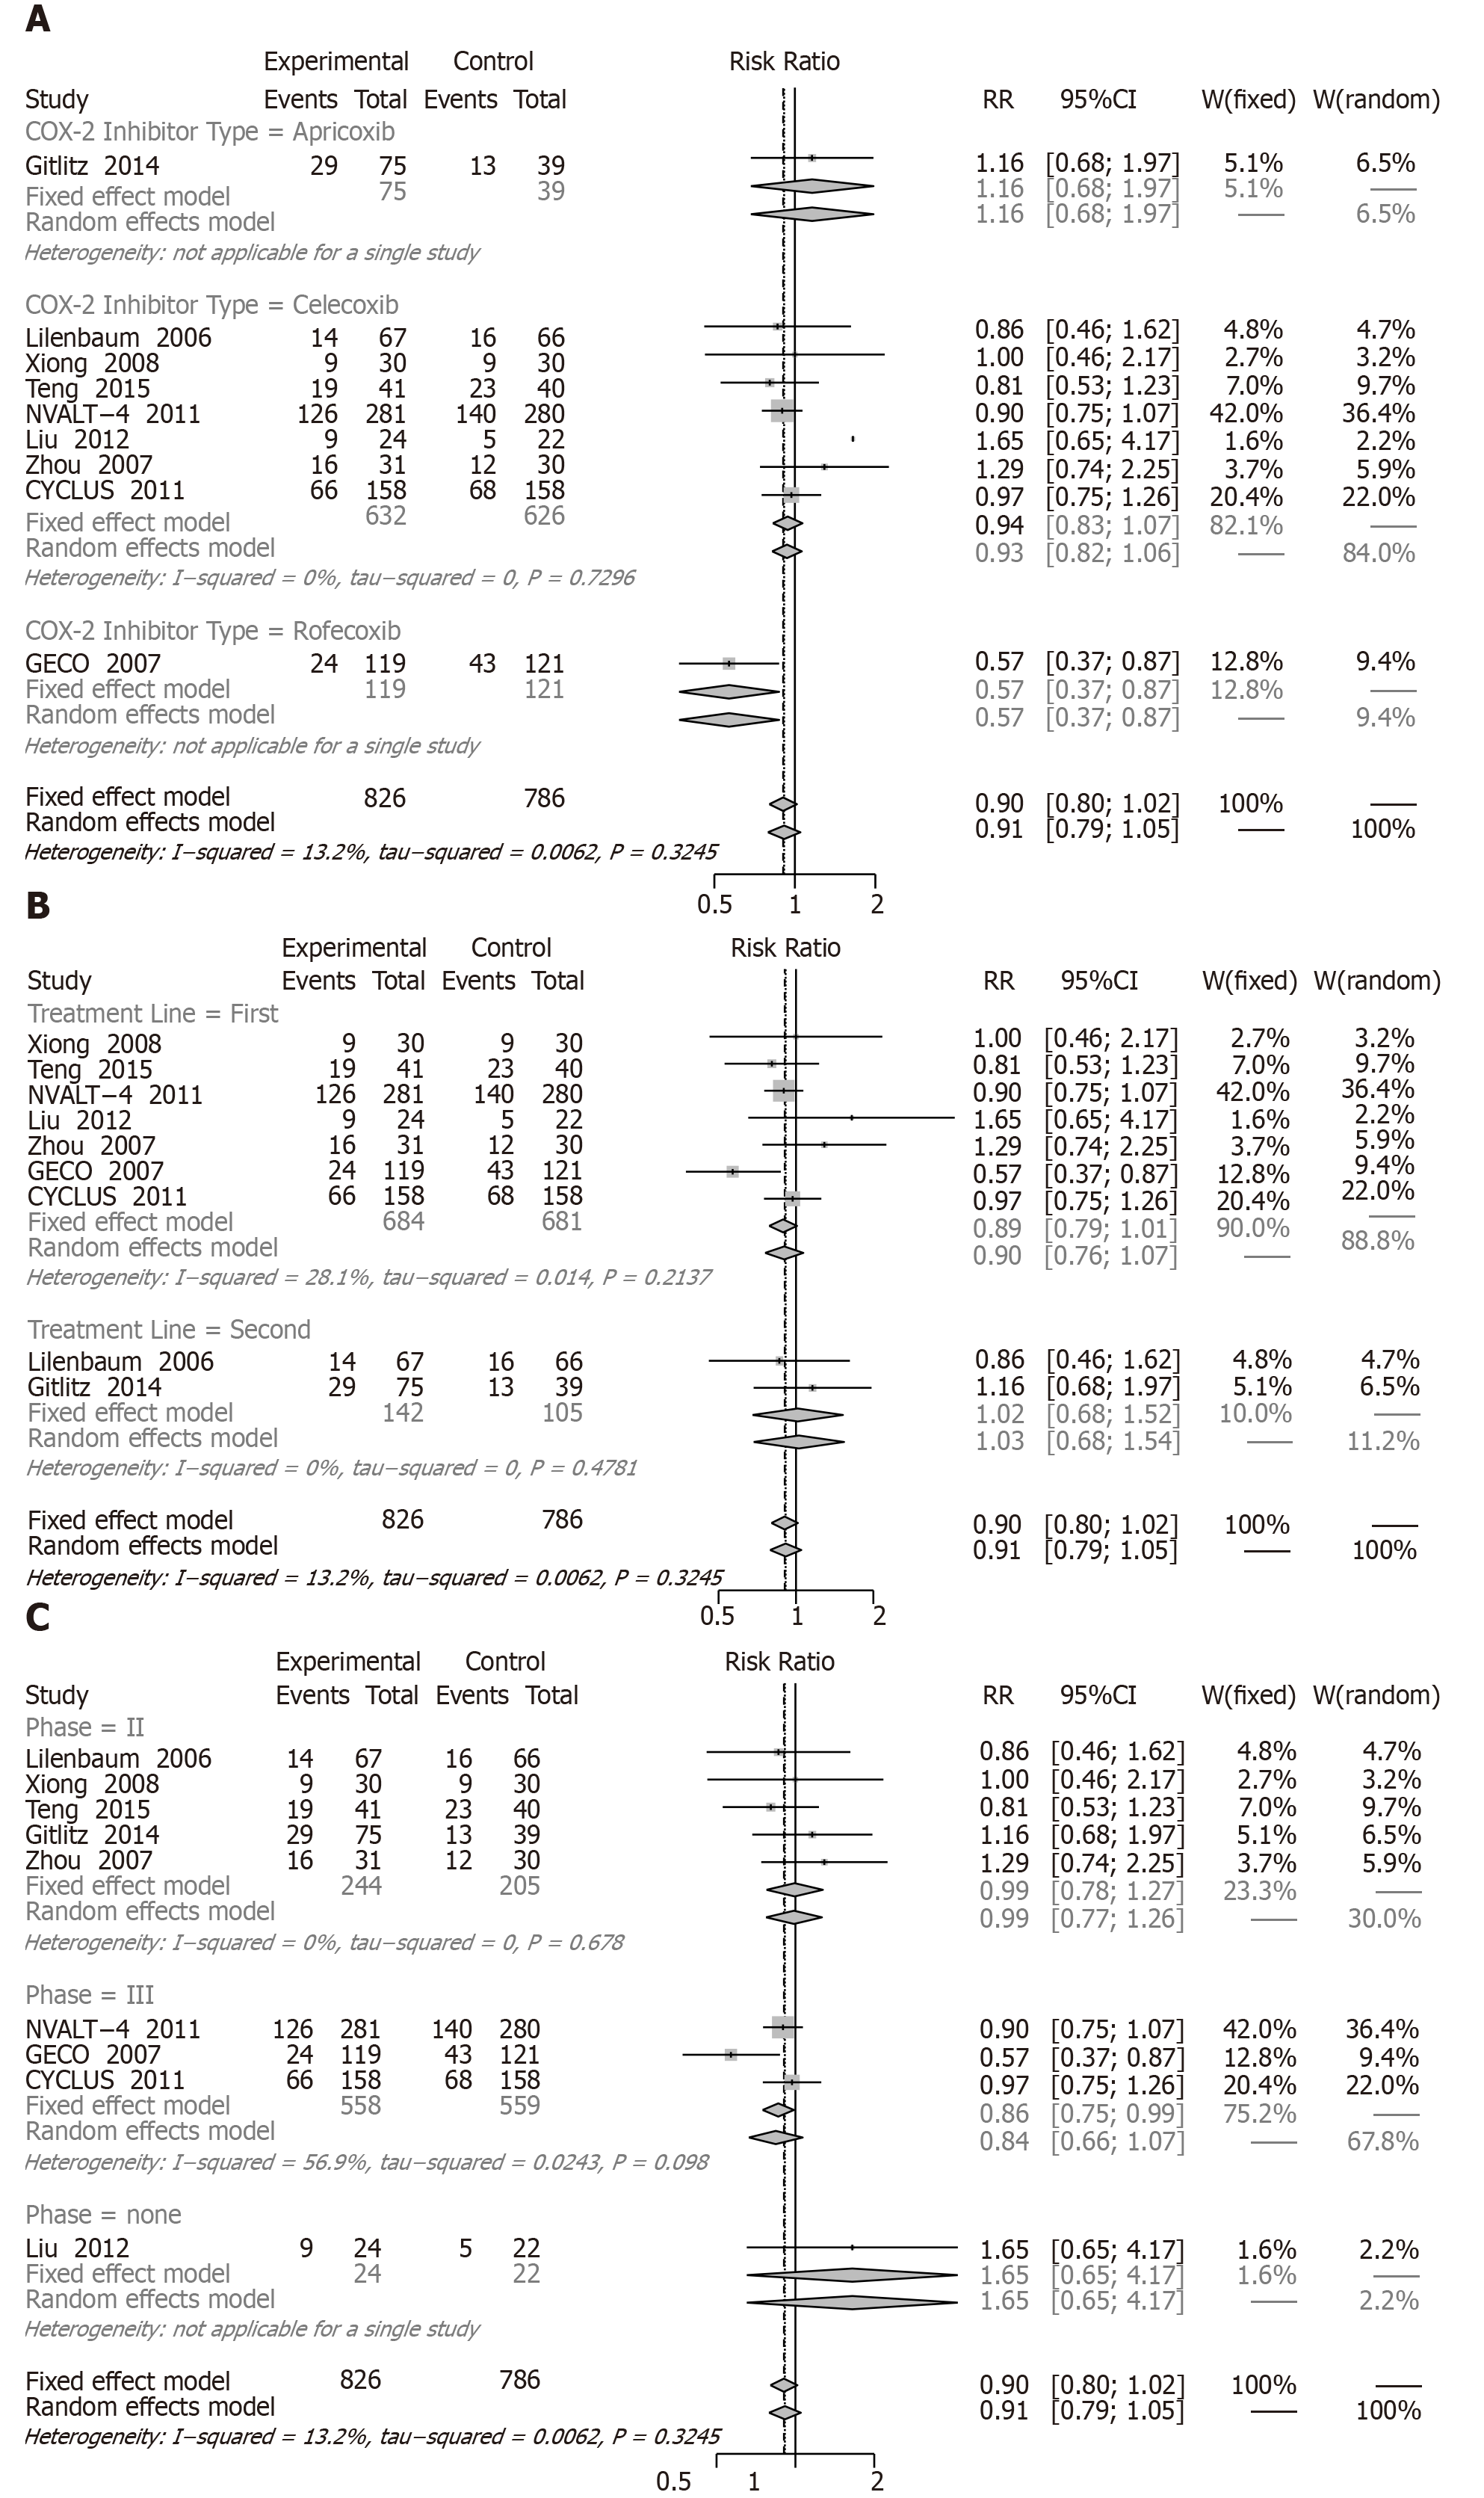
Figure 5 Subgroup analyses of forest plot for overall response rate.
Figure 6 Subgroup analyses of forest plot for clinical benefit.
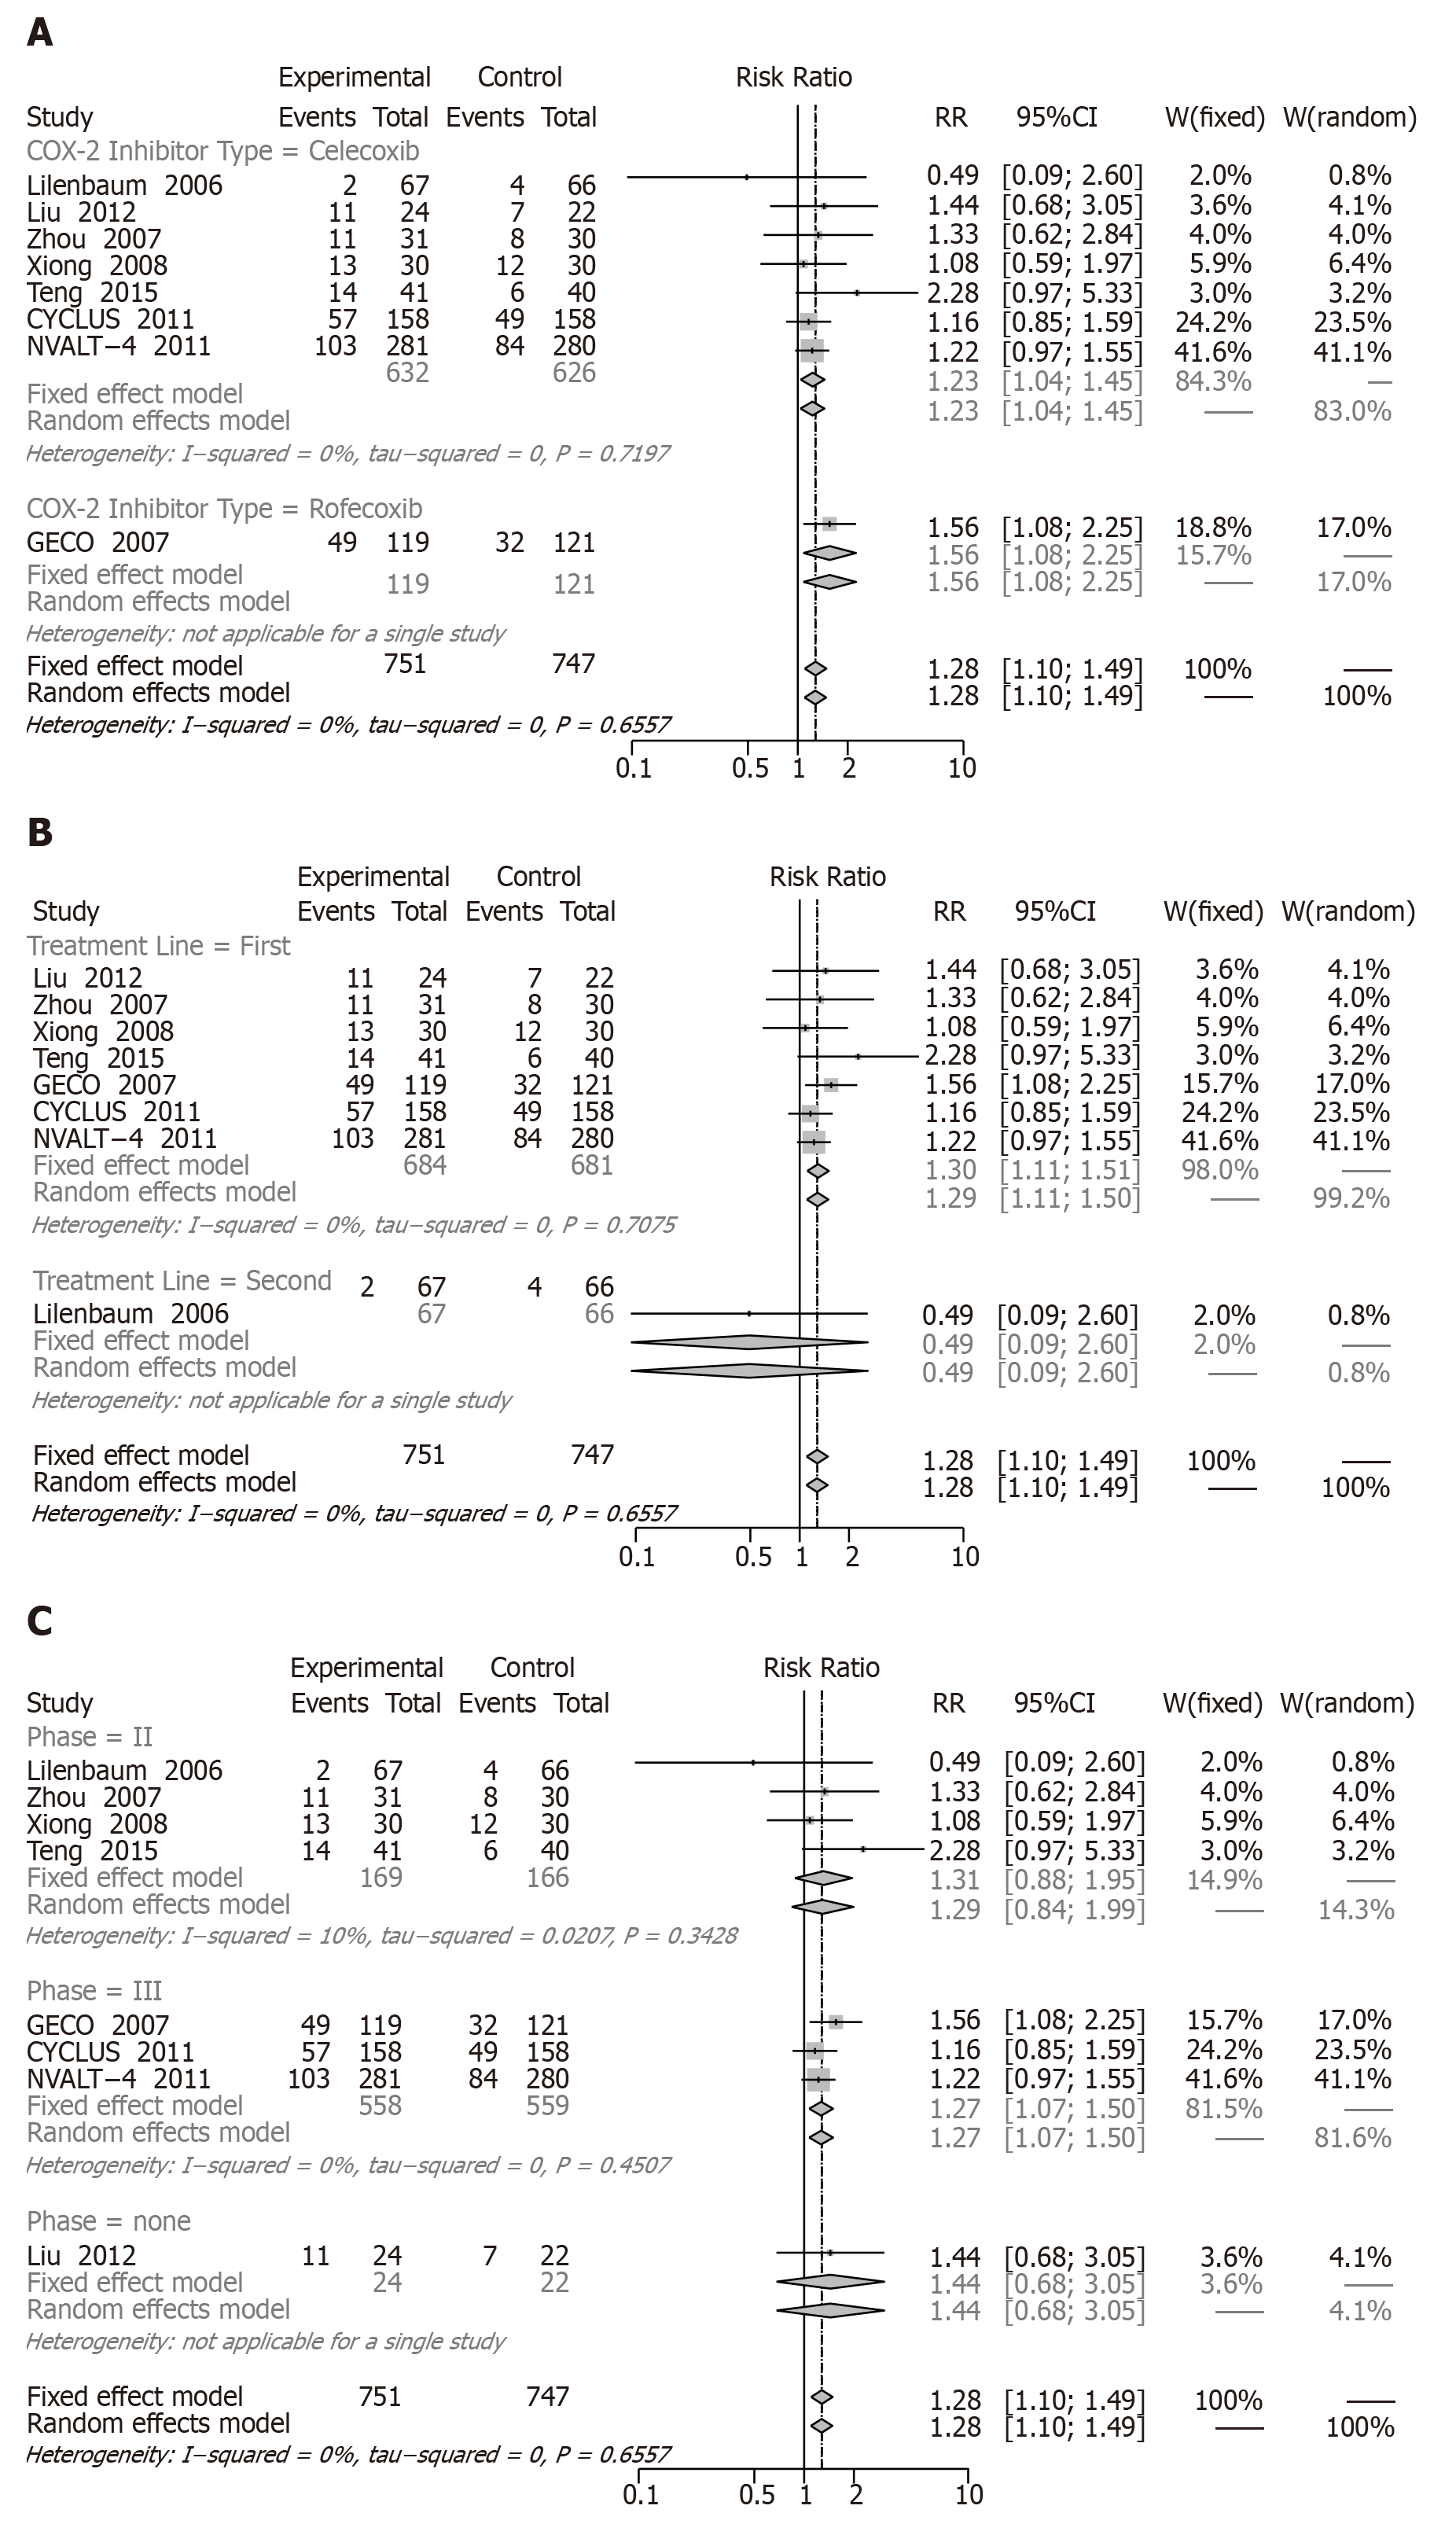
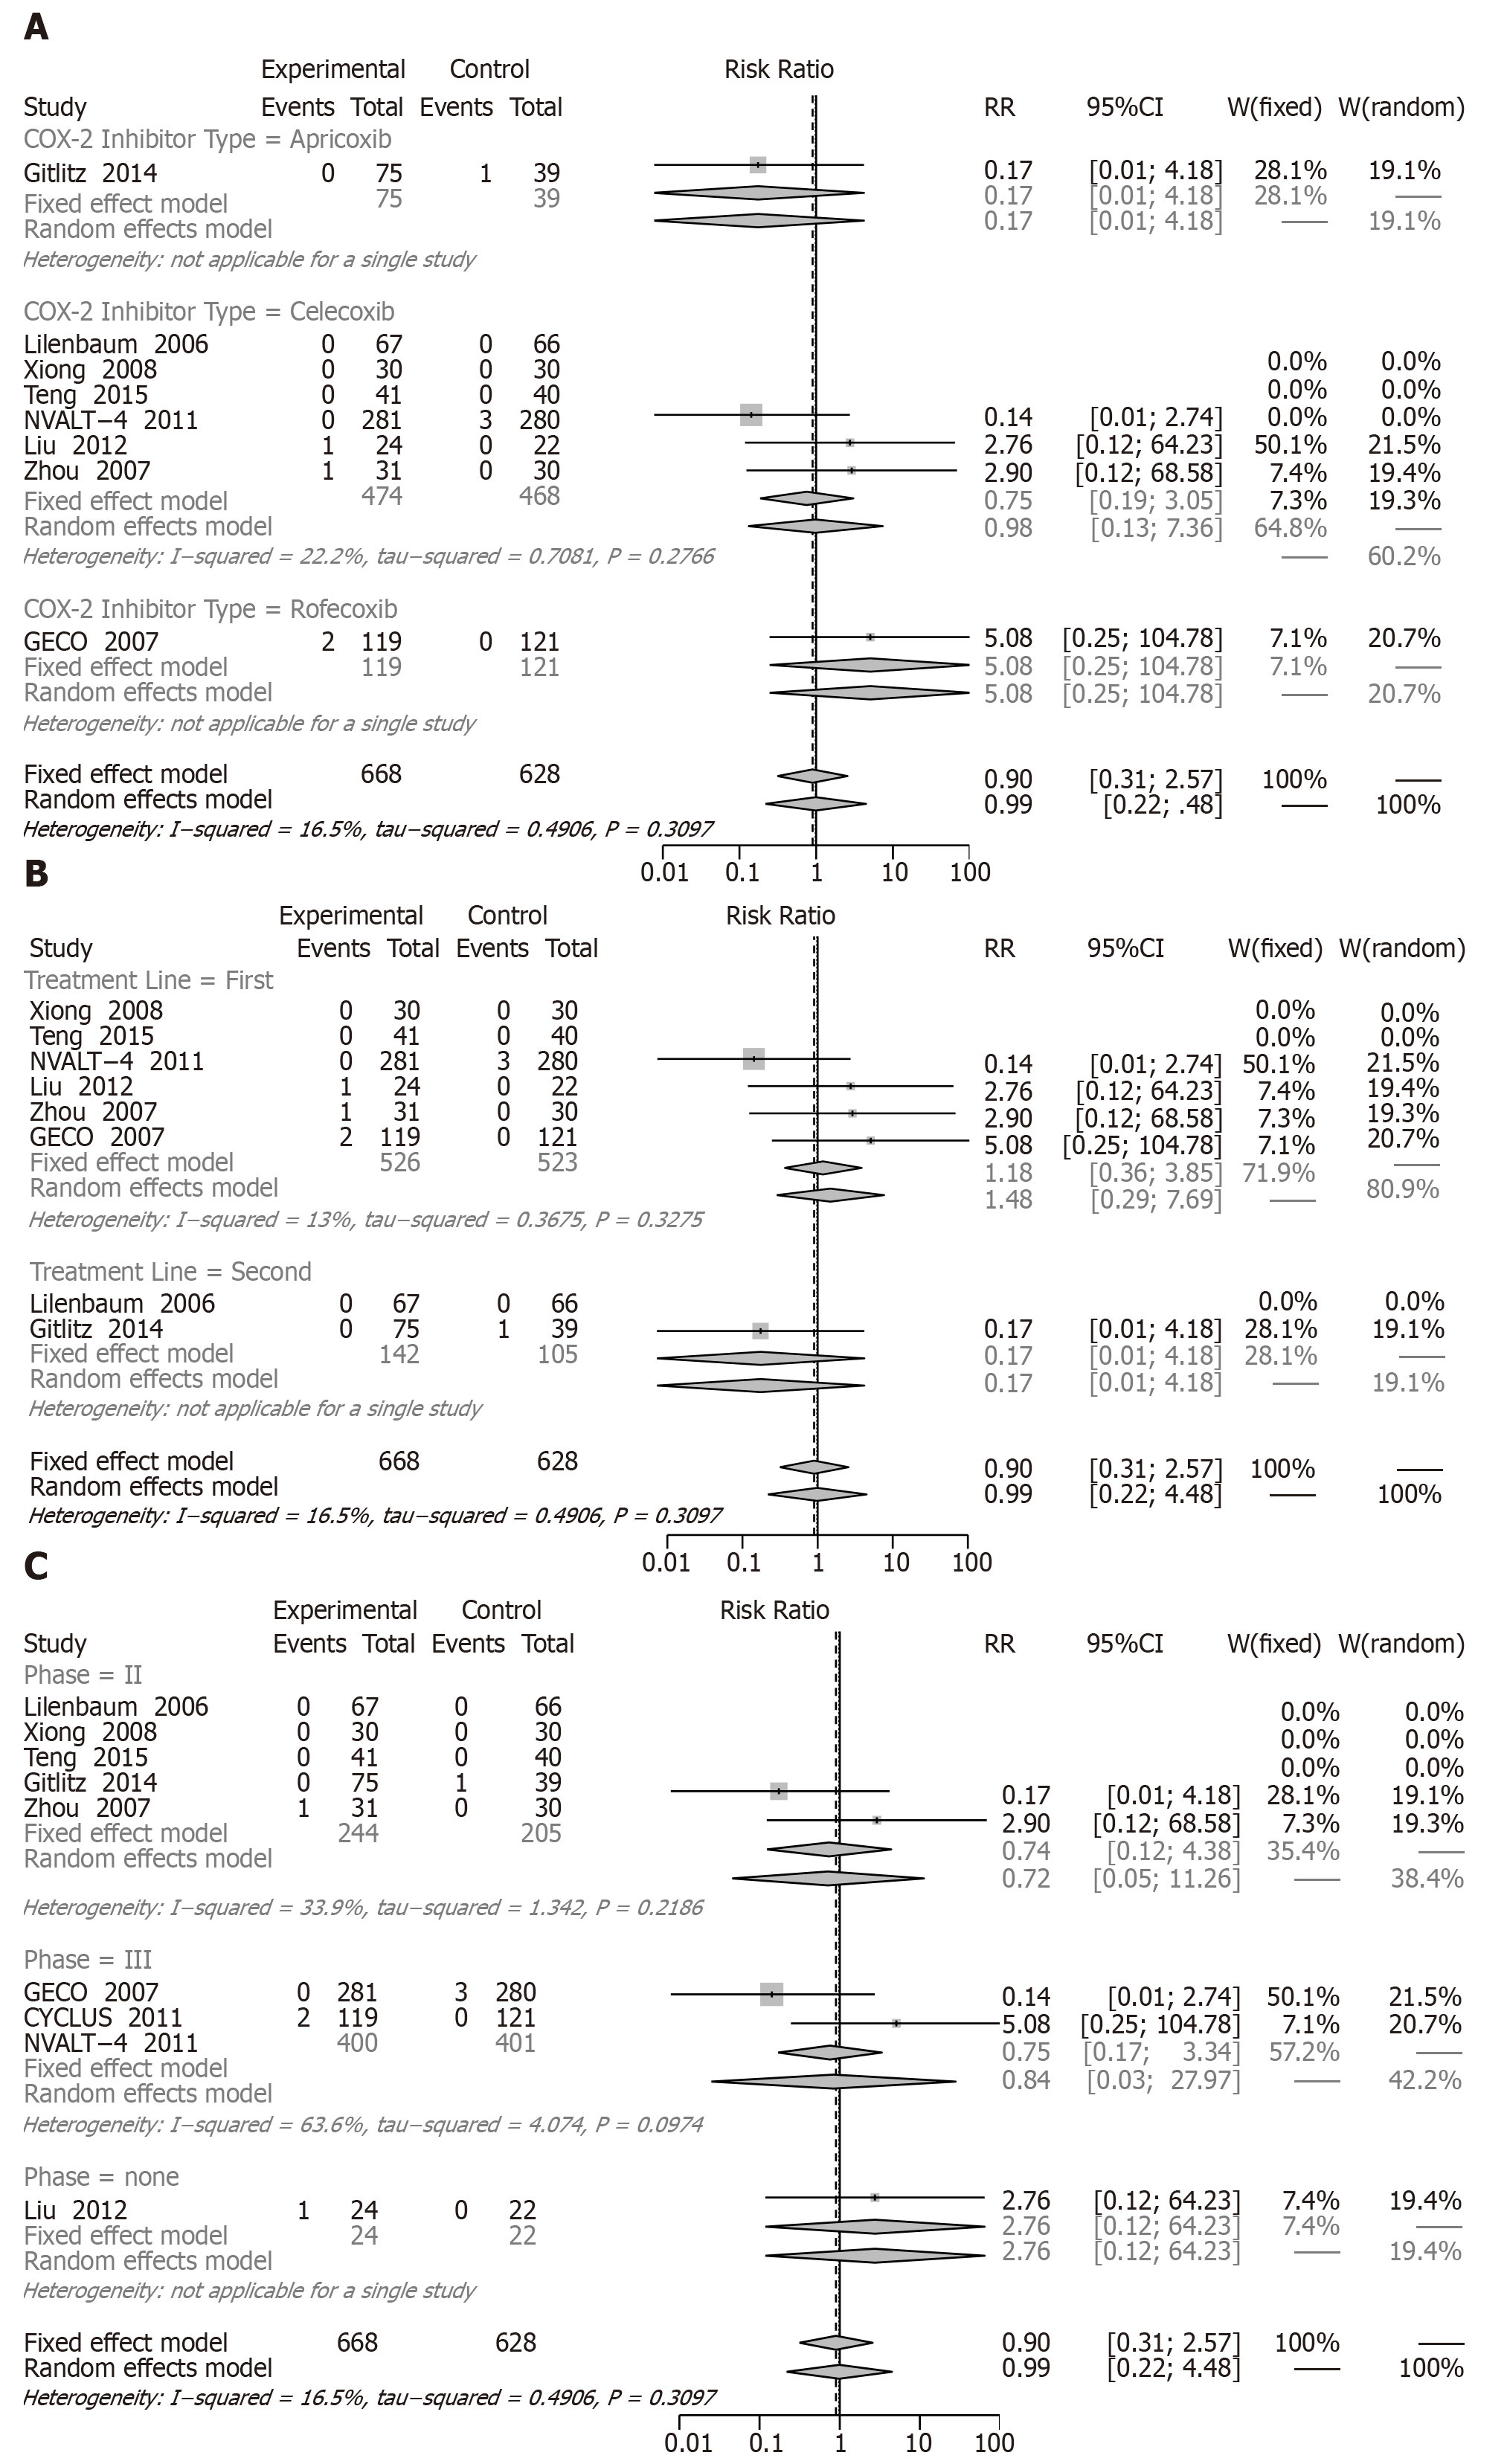
Figure 7 Subgroup analyses of forest plot for complete response.
Figure 8 Subgroup analyses of forest plot for partial response.
Figure 9 Subgroup analyses of forest plot for stable disease.
- Citation: Xu YQ, Long X, Han M, Huang MQ, Lu JF, Sun XD, Han W. Clinical benefit of COX-2 inhibitors in the adjuvant chemotherapy of advanced non-small cell lung cancer: A systematic review and meta-analysis. World J Clin Cases 2021; 9(3): 581-601
- URL: https://www.wjgnet.com/2307-8960/full/v9/i3/581.htm
- DOI: https://dx.doi.org/10.12998/wjcc.v9.i3.581


