Copyright
©The Author(s) 2021.
World J Clin Cases. Oct 6, 2021; 9(28): 8482-8491
Published online Oct 6, 2021. doi: 10.12998/wjcc.v9.i28.8482
Published online Oct 6, 2021. doi: 10.12998/wjcc.v9.i28.8482
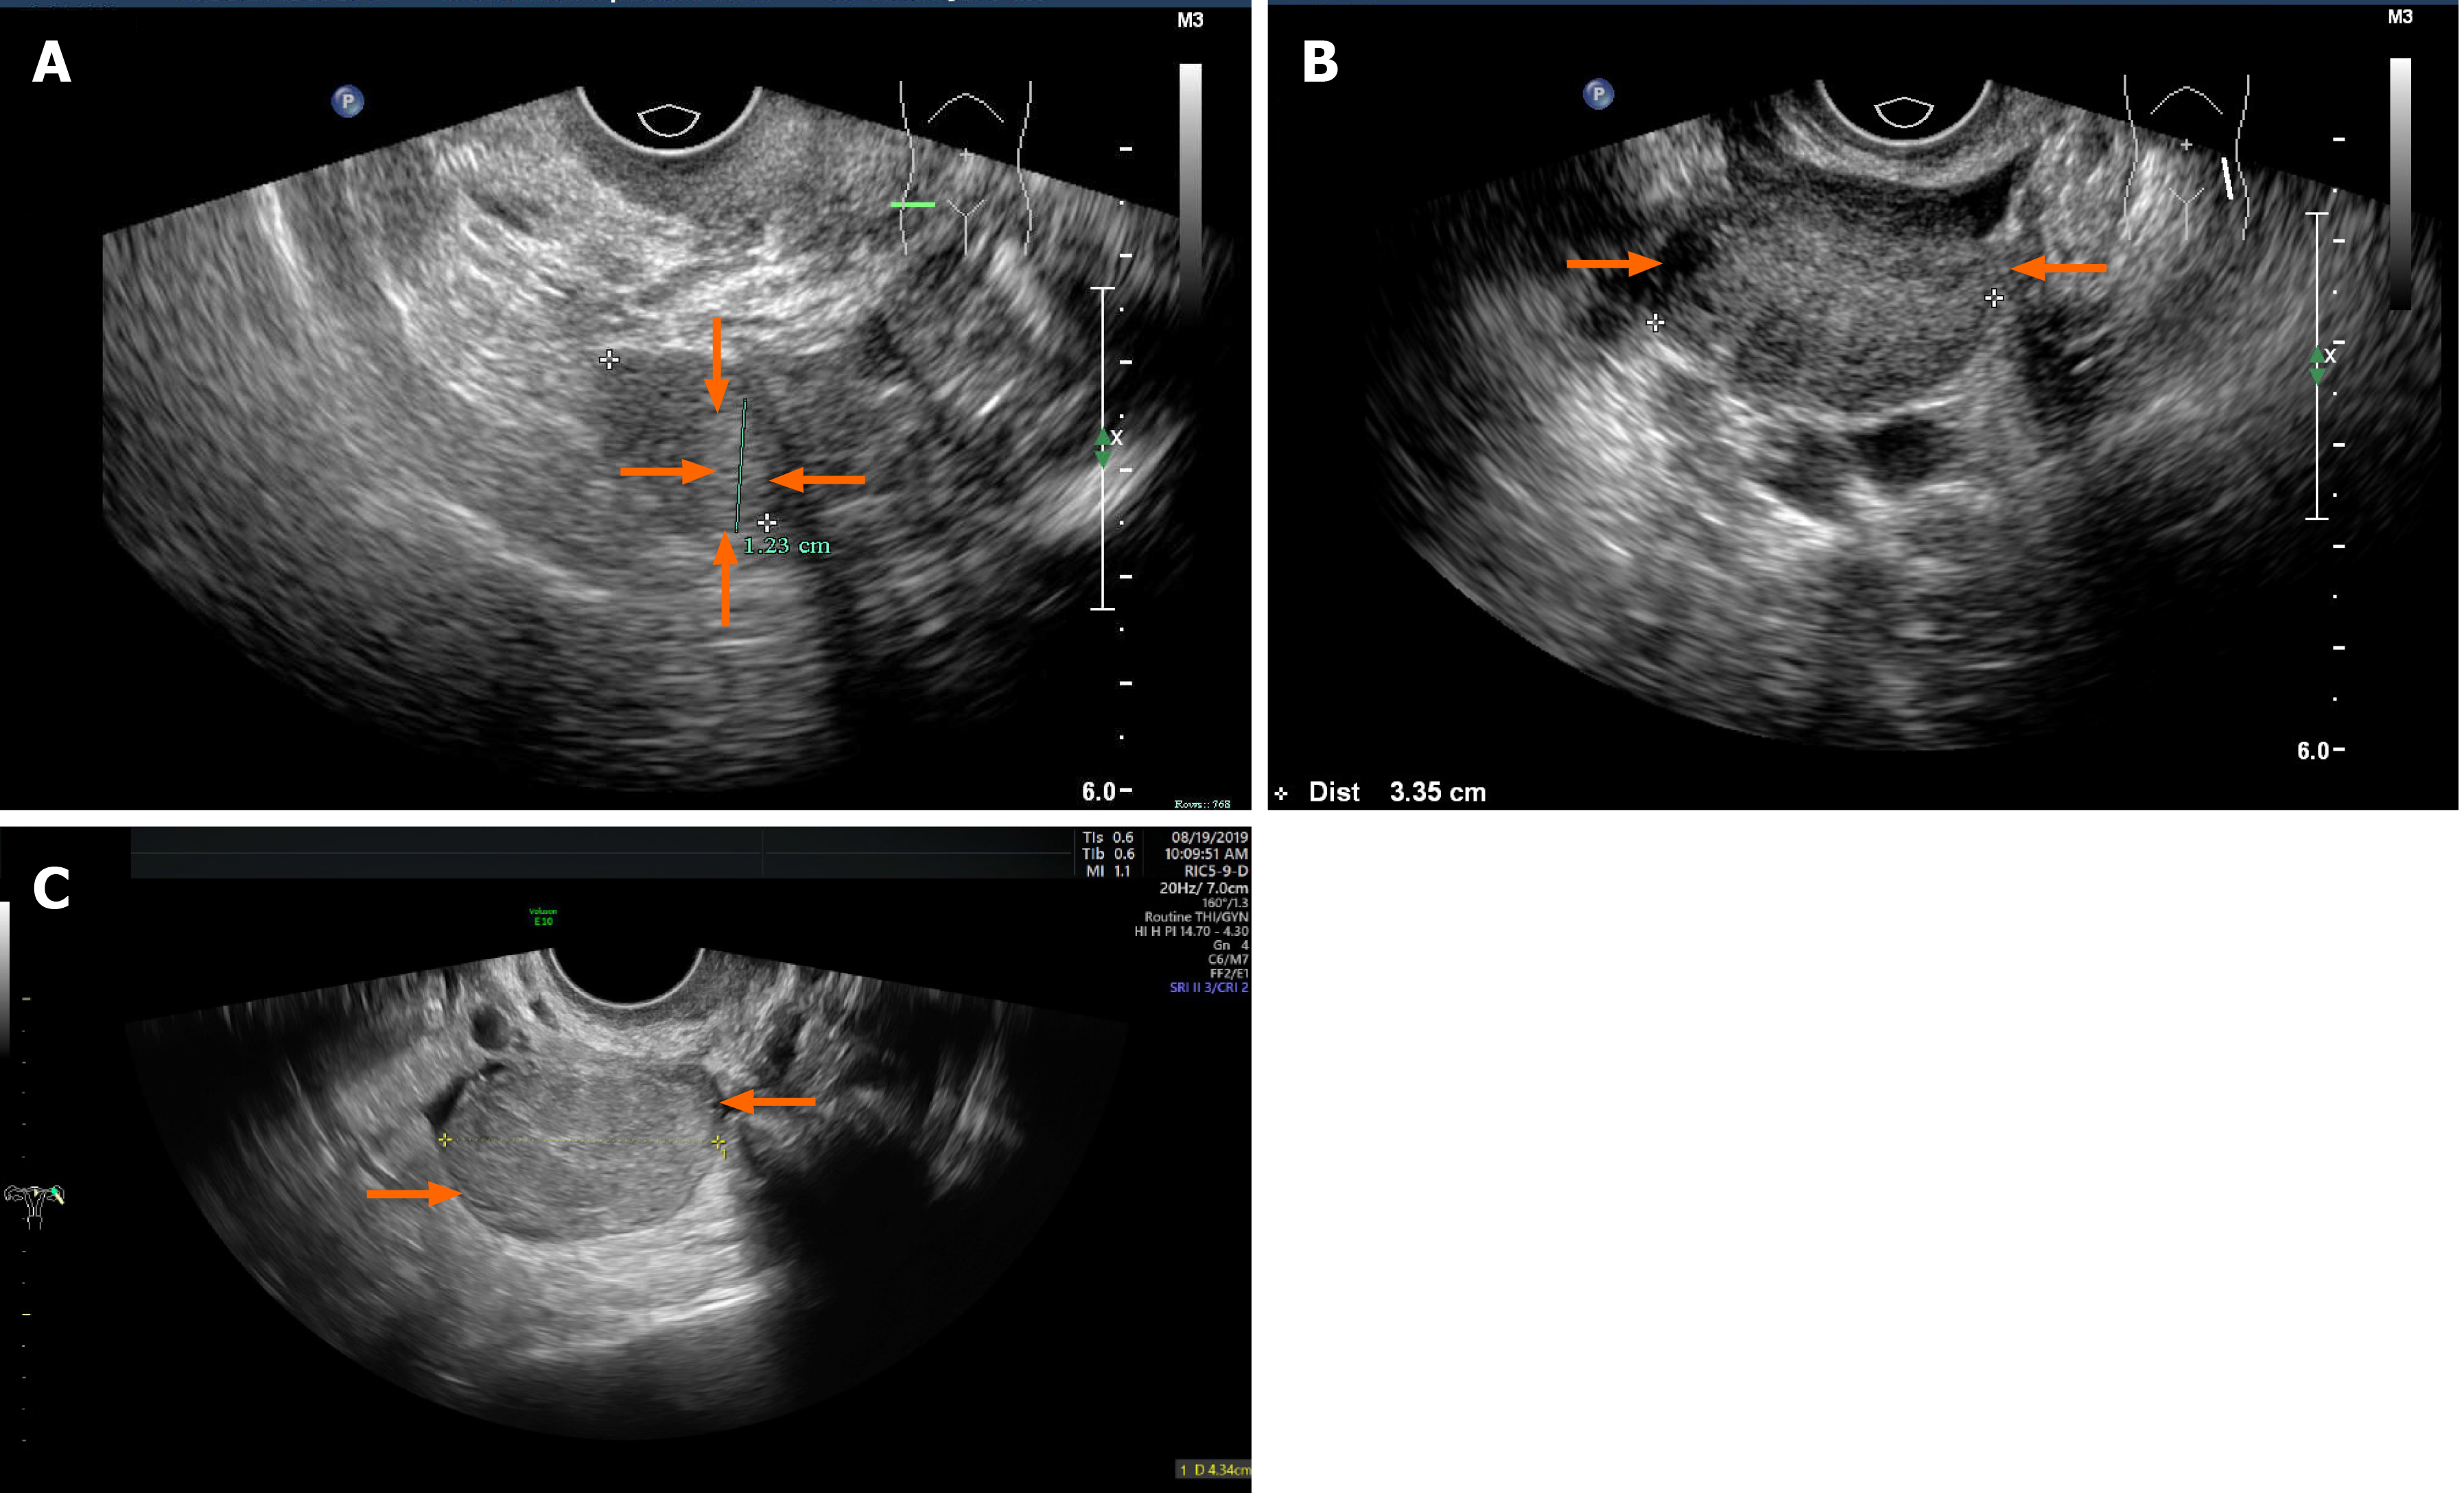
Figure 1 Transvaginal ultrasonography.
A: A slightly hyperechoic nodule with an unclear boundary in the right ovary (case 1); B: The left ovary showed a slightly hyperechoic mass with clear boundary (case 2); C: A solid, slightly hyperechoic mass with clear boundary in the left ovary (case 3).
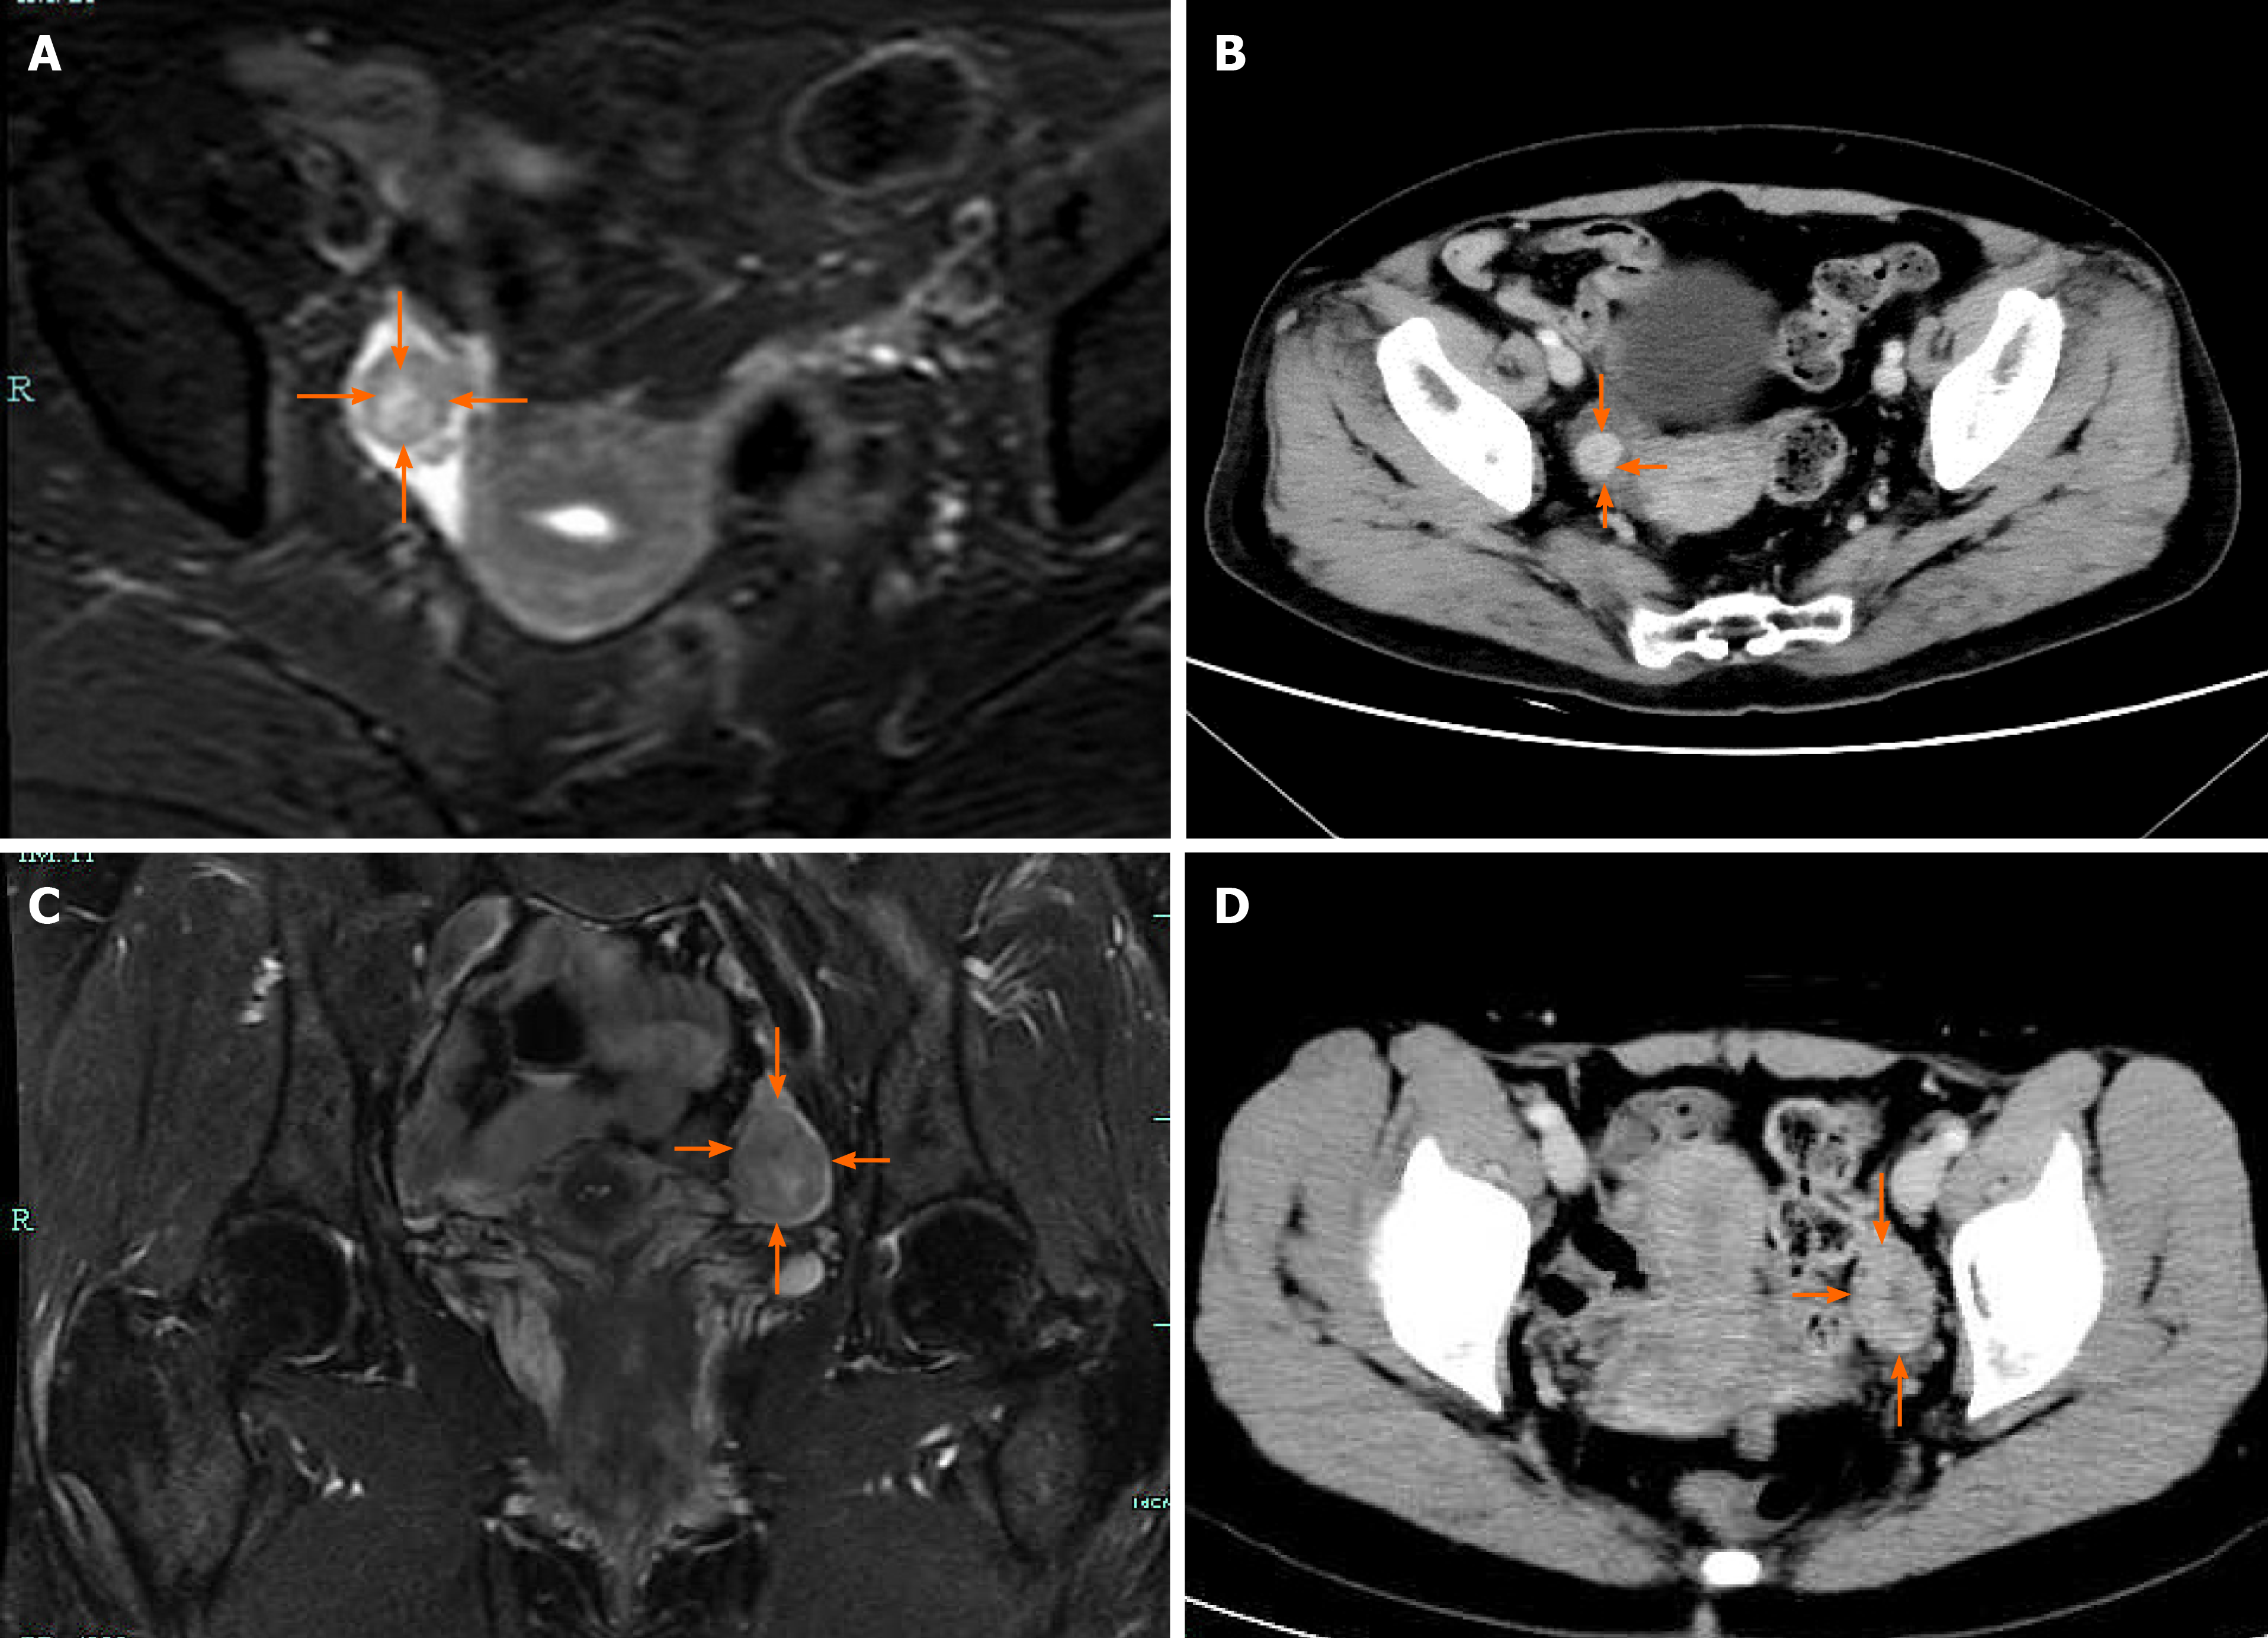
Figure 2 Enhanced magnetic resonance imaging (A and C) and computed tomography (B and D).
A: Enhanced magnetic resonance imaging (MRI) of the pelvis showed nodules in the right adnexal area (case 1); B: Contrast computed tomography (CT) of the pelvis showed high-density shadows in the nodular tip of the right adnexal (case 1); C: Enhanced MRI of the pelvis revealed a space-occupying mass in the left adnexal area (case 2); D: Enhanced CT of the pelvis showed a solid/cystic mass in the left adnexal area (case 3).
Figure 3 Color Doppler flow imaging.
A: Color Doppler flow imaging (CDFI) showed an abundant blood supply with a resistance index of 0.39 (case 2); B: CDFI showed an abundant blood supply in the mass (case 3).
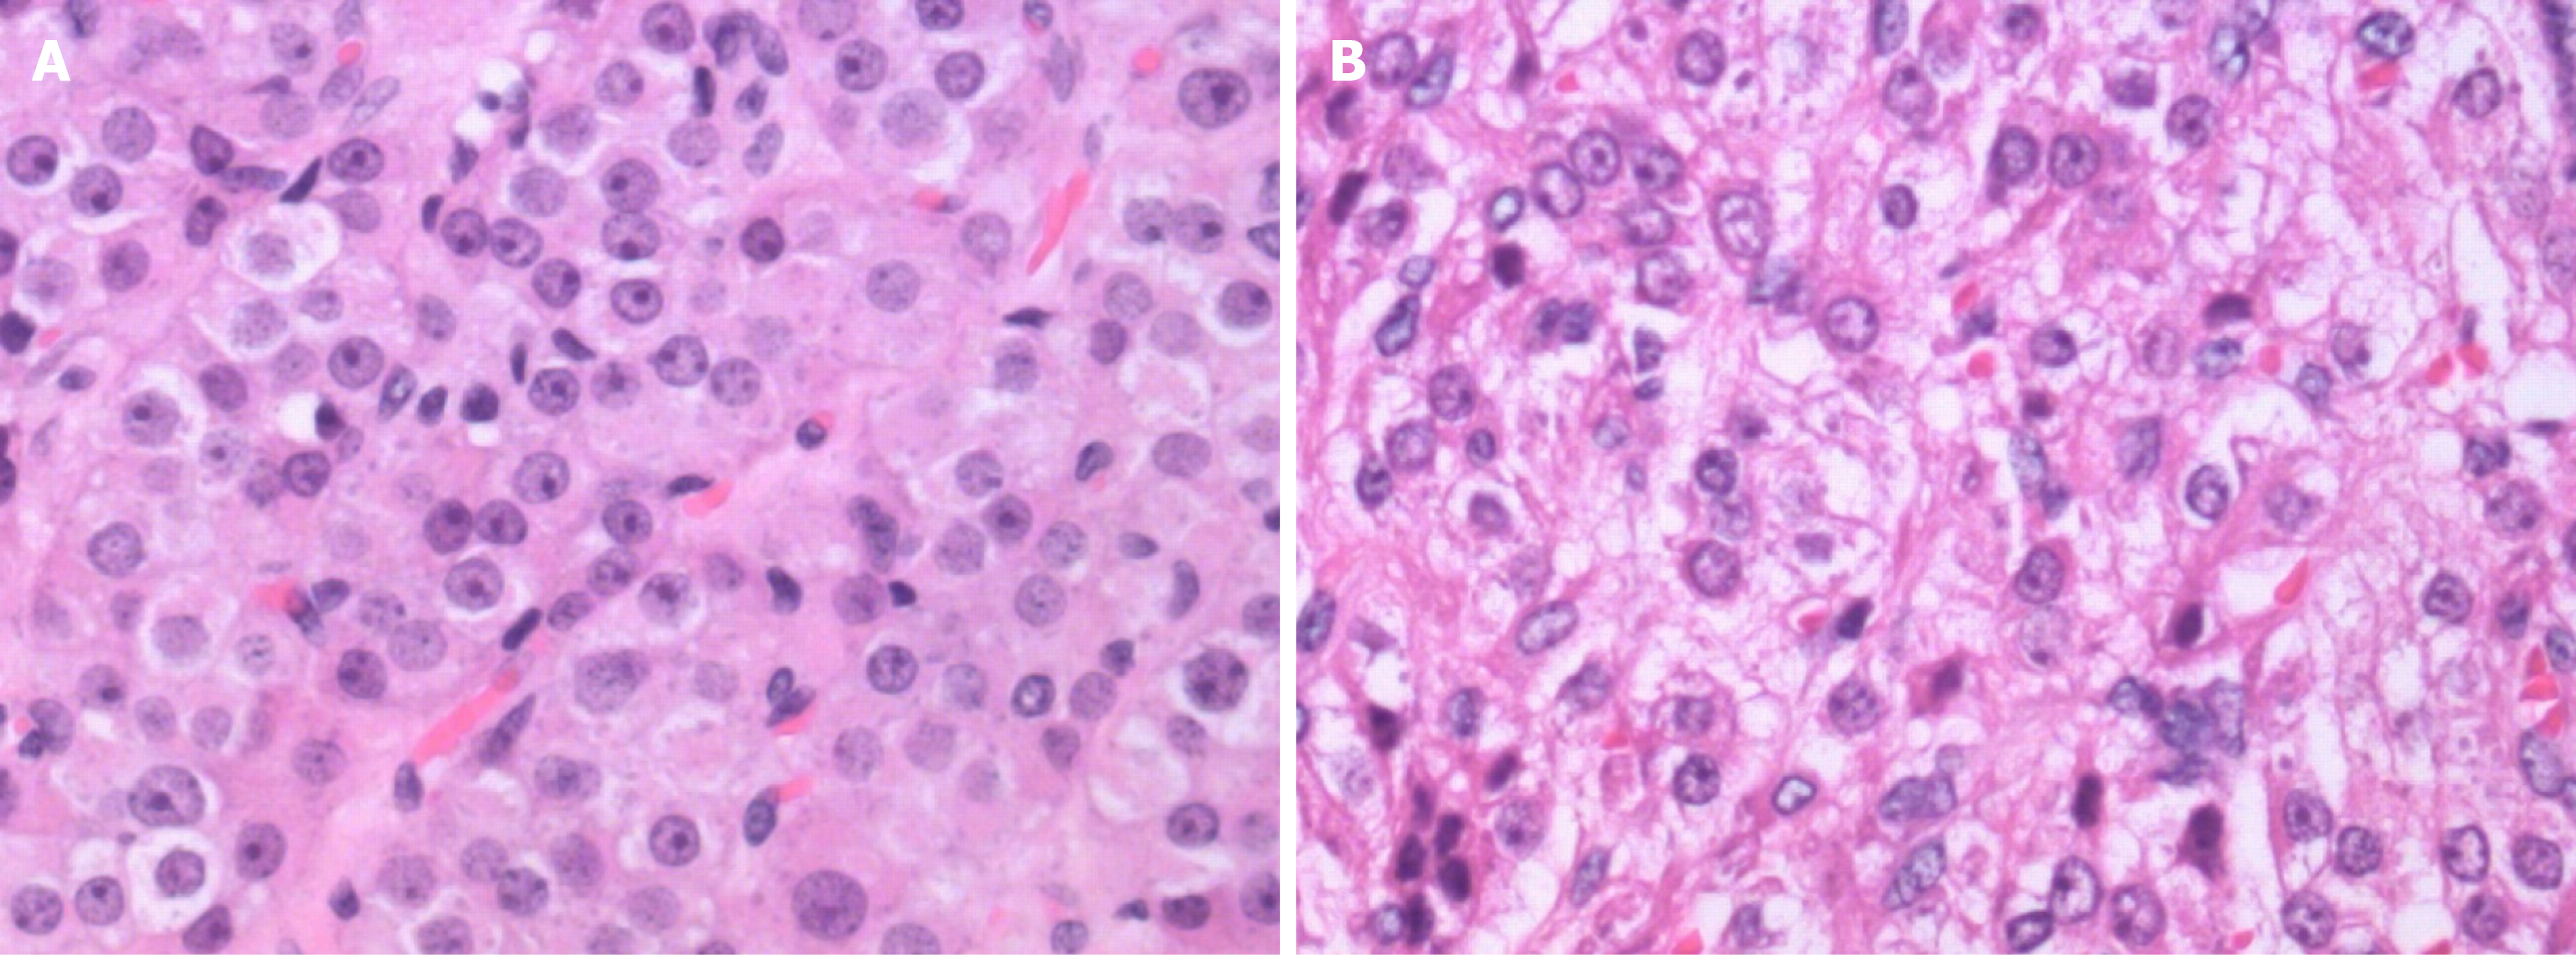
Figure 4 Hematoxylin-eosin staining.
A: Hematoxylin-eosin staining by microscopy, × 400 magnification showed Leydig cell tumor (case 1); B: Hematoxylin-eosin staining by microscopy, × 400 magnification showed steroid cell tumor, not otherwise specified (cases 2 and 3).
- Citation: Zhu XD, Zhou LY, Jiang J, Jiang TA. Postmenopausal women with hyperandrogenemia: Three case reports. World J Clin Cases 2021; 9(28): 8482-8491
- URL: https://www.wjgnet.com/2307-8960/full/v9/i28/8482.htm
- DOI: https://dx.doi.org/10.12998/wjcc.v9.i28.8482


