Copyright
©The Author(s) 2021.
World J Clin Cases. Oct 6, 2021; 9(28): 8441-8452
Published online Oct 6, 2021. doi: 10.12998/wjcc.v9.i28.8441
Published online Oct 6, 2021. doi: 10.12998/wjcc.v9.i28.8441
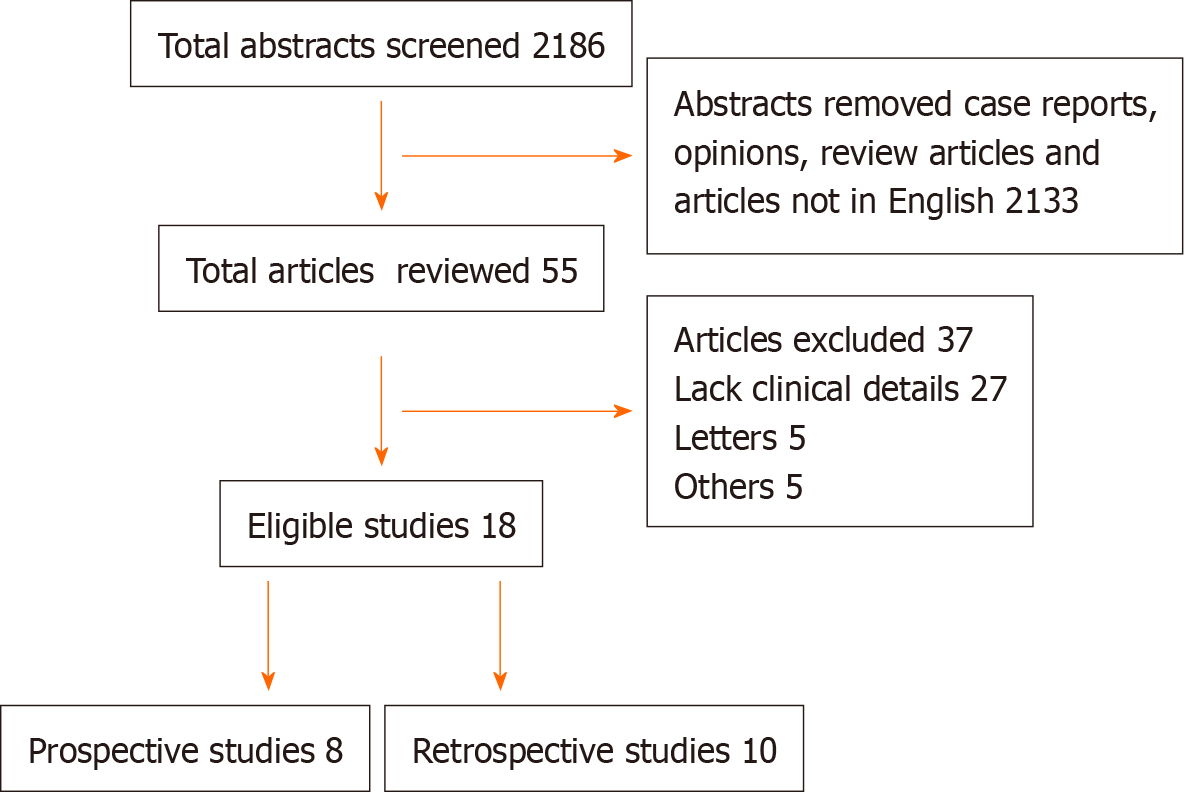
Figure 1 PRISMA diagram showing the details of the study.
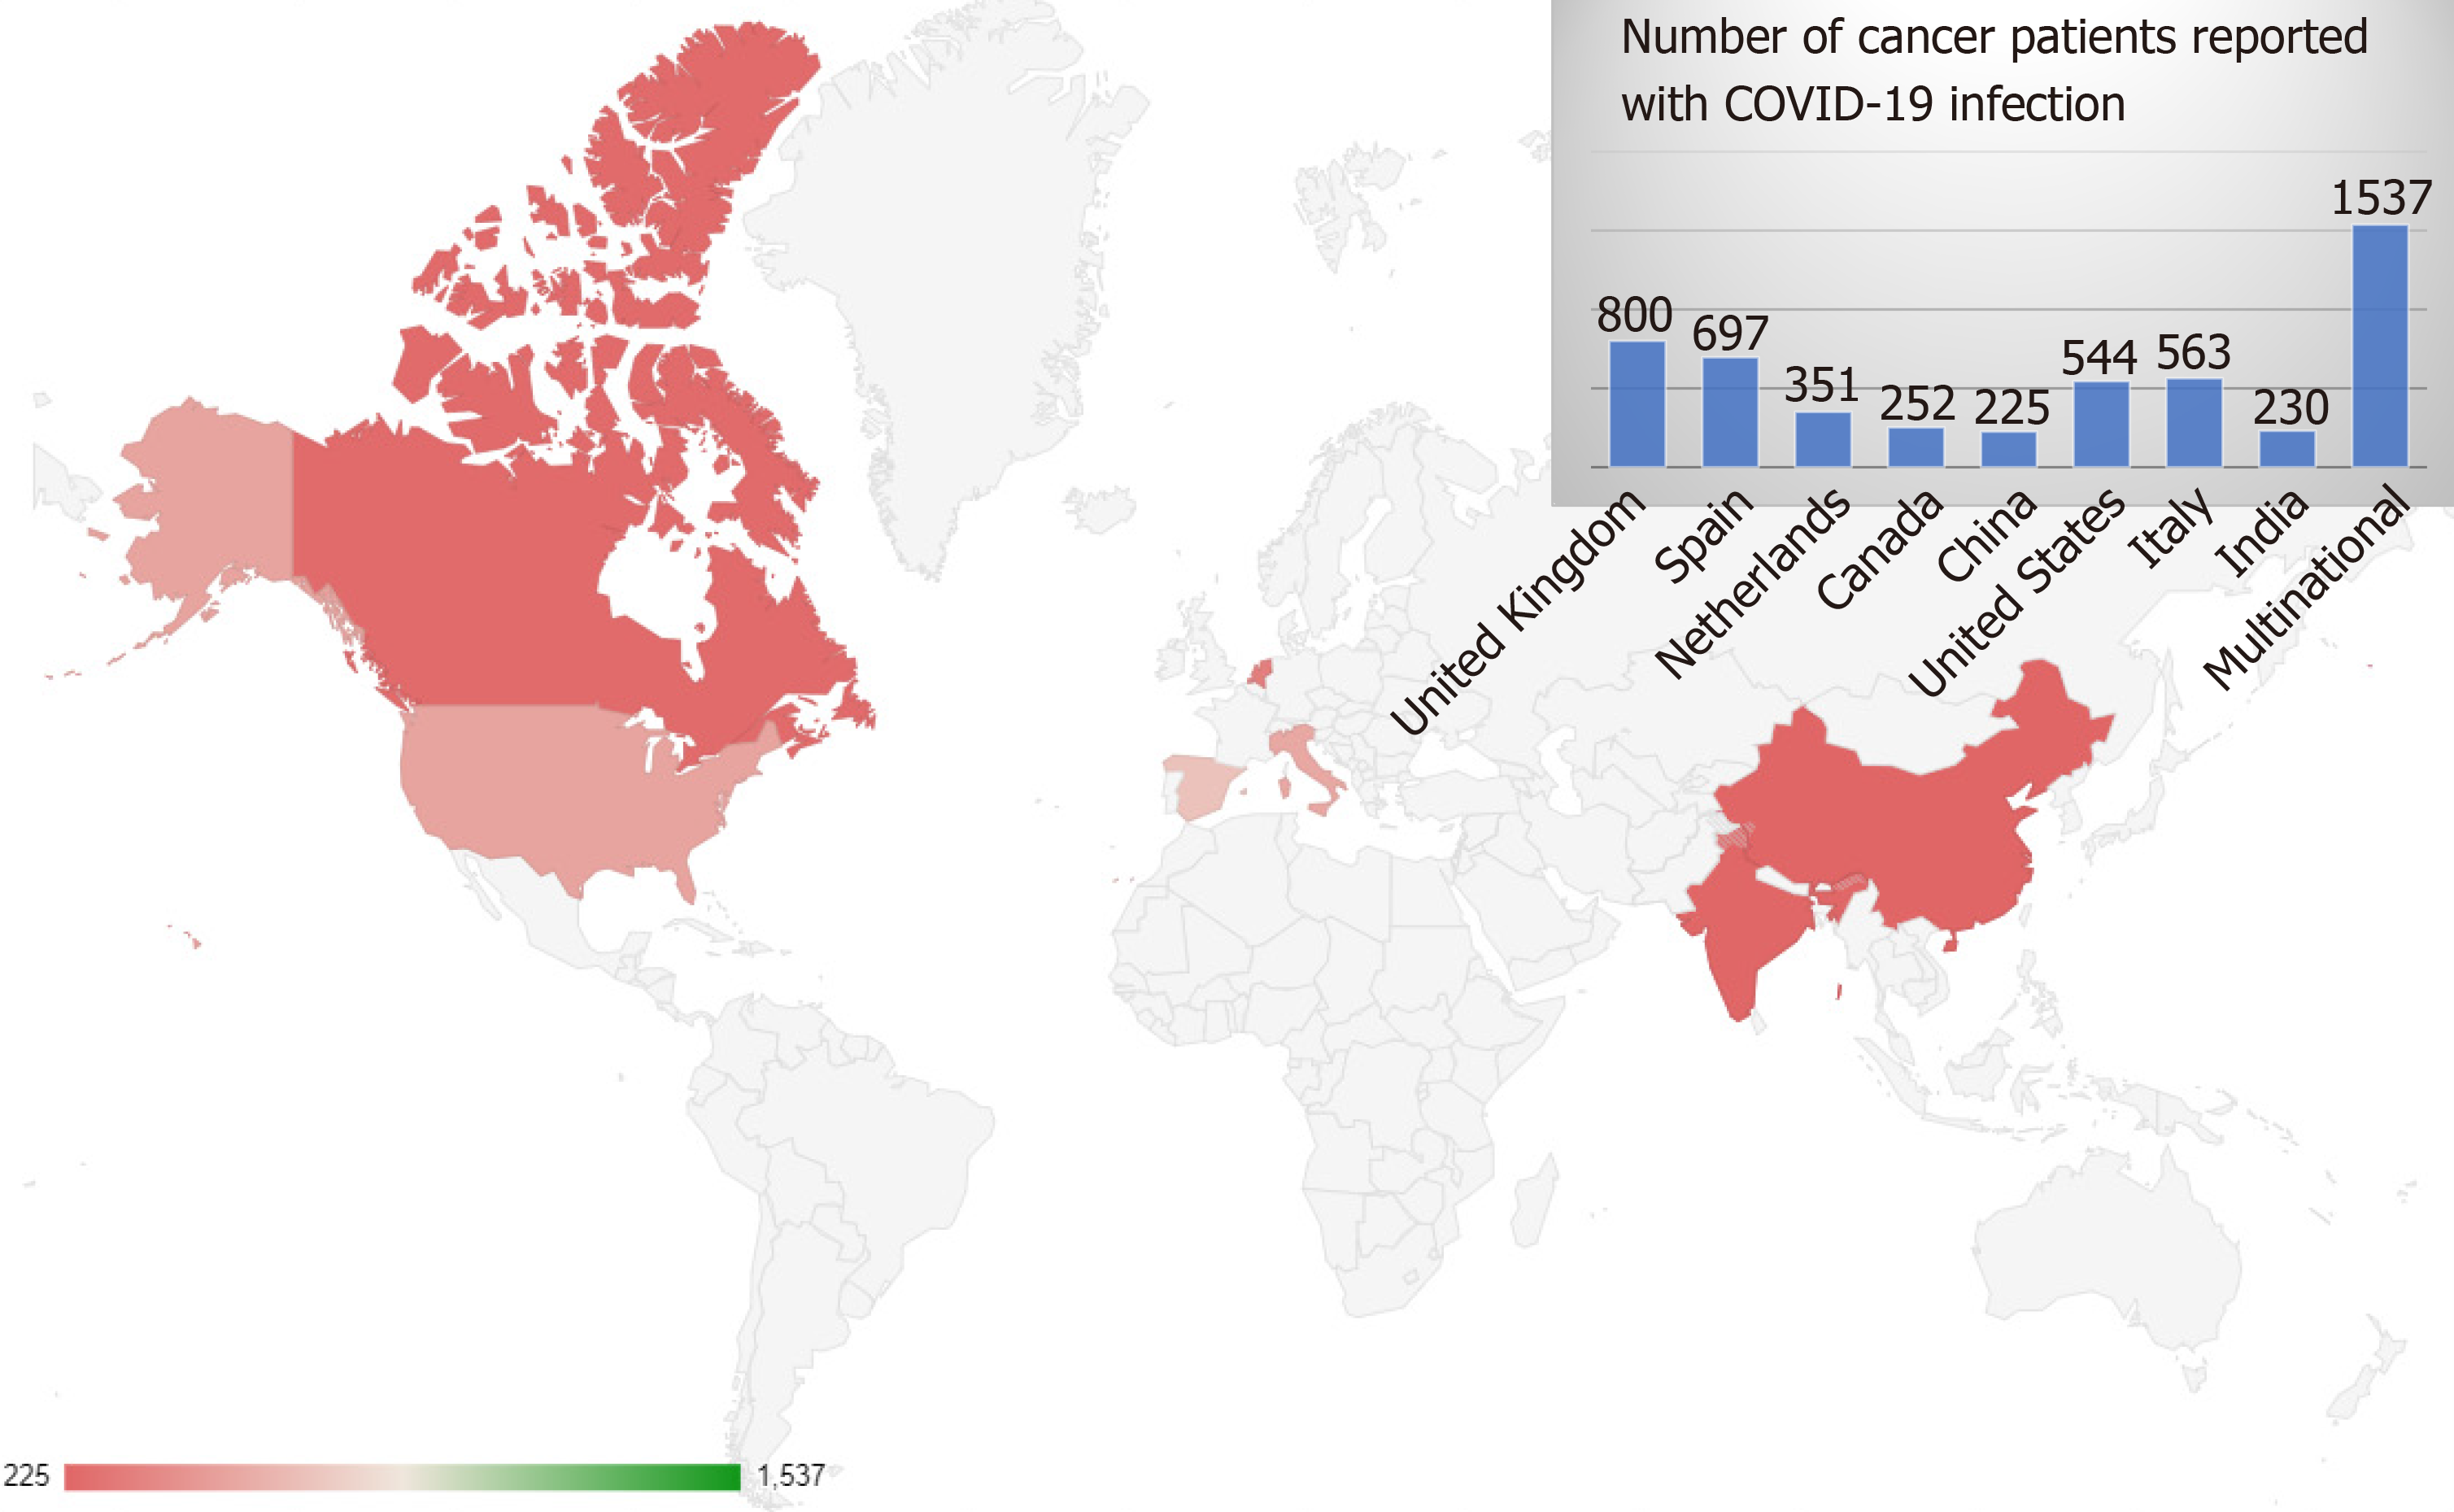
Figure 2 Showing the geographical distribution of reporting of cancer and coronavirus disease 2019 coinfection.
COVID-19: Coronavirus disease 2019.
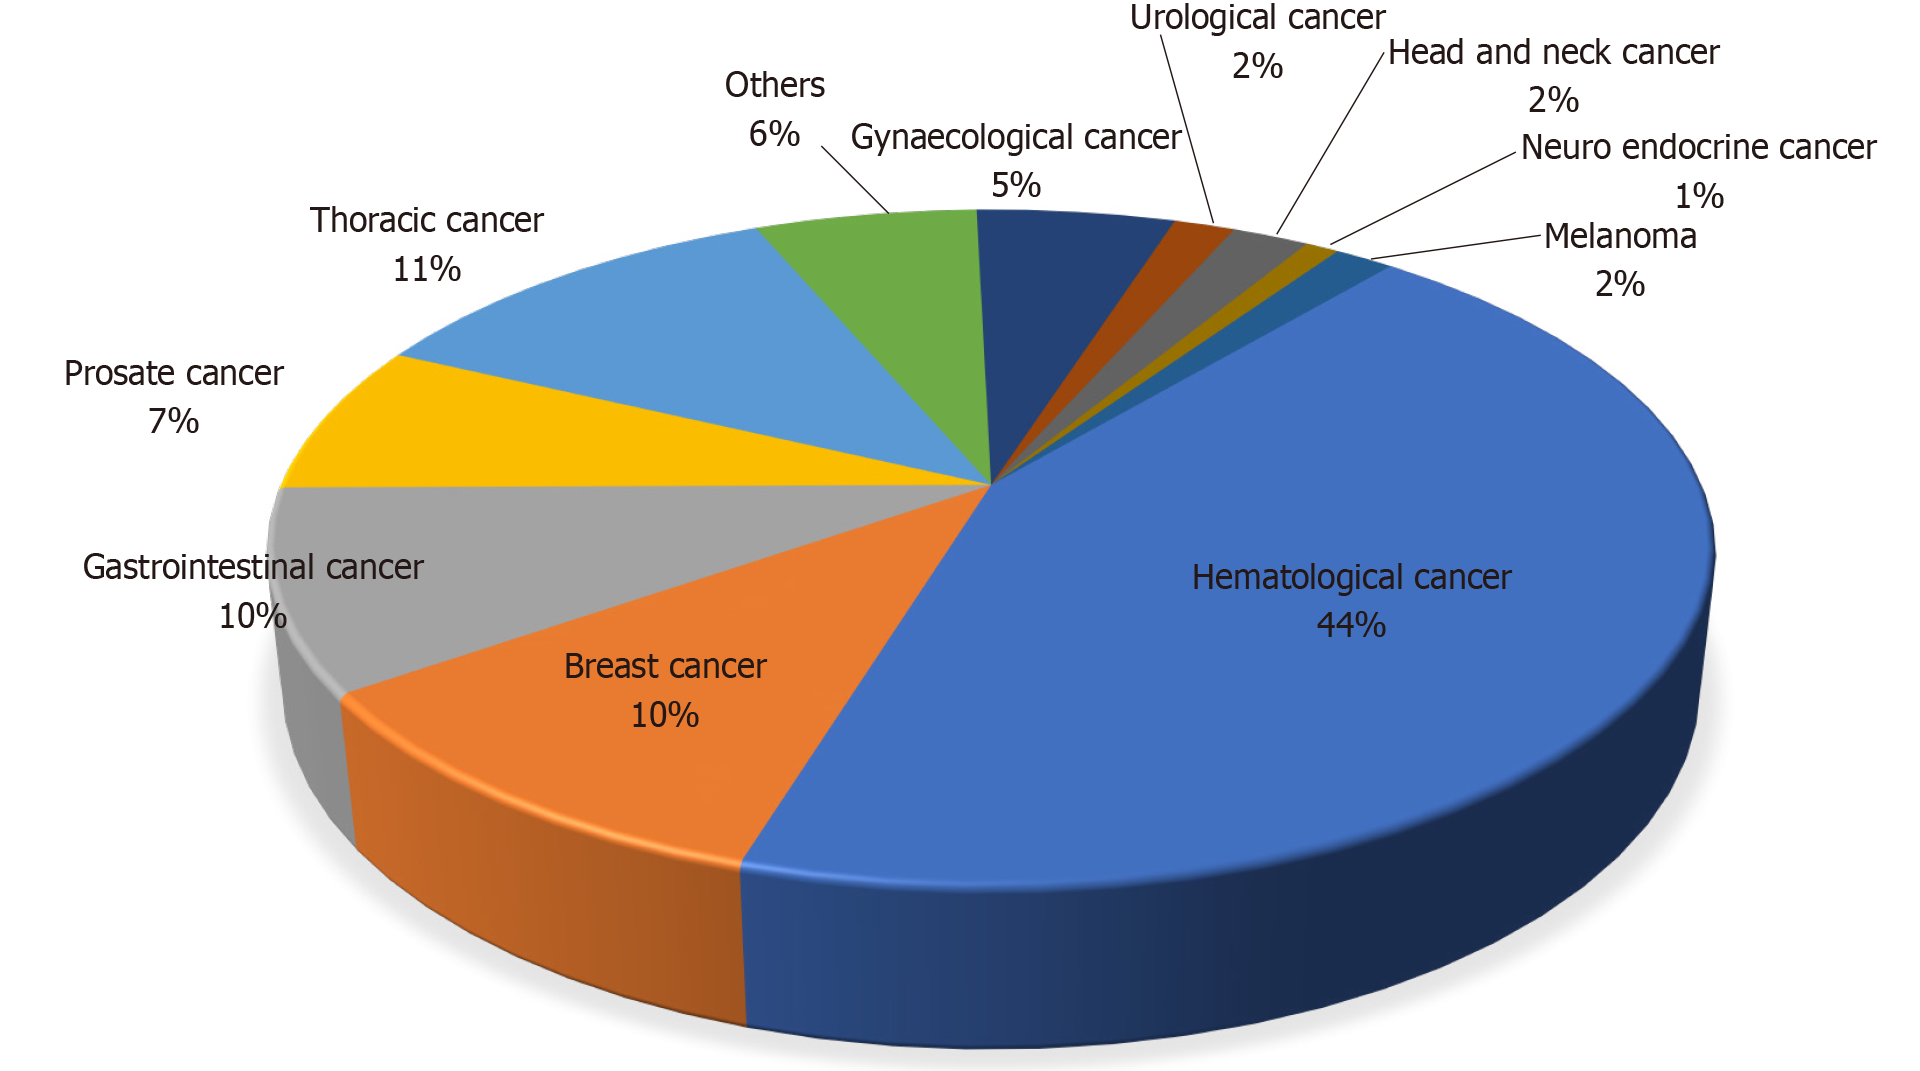
Figure 3 Pie chart showing the reported coronavirus disease 2019 infections among various types of cancers.
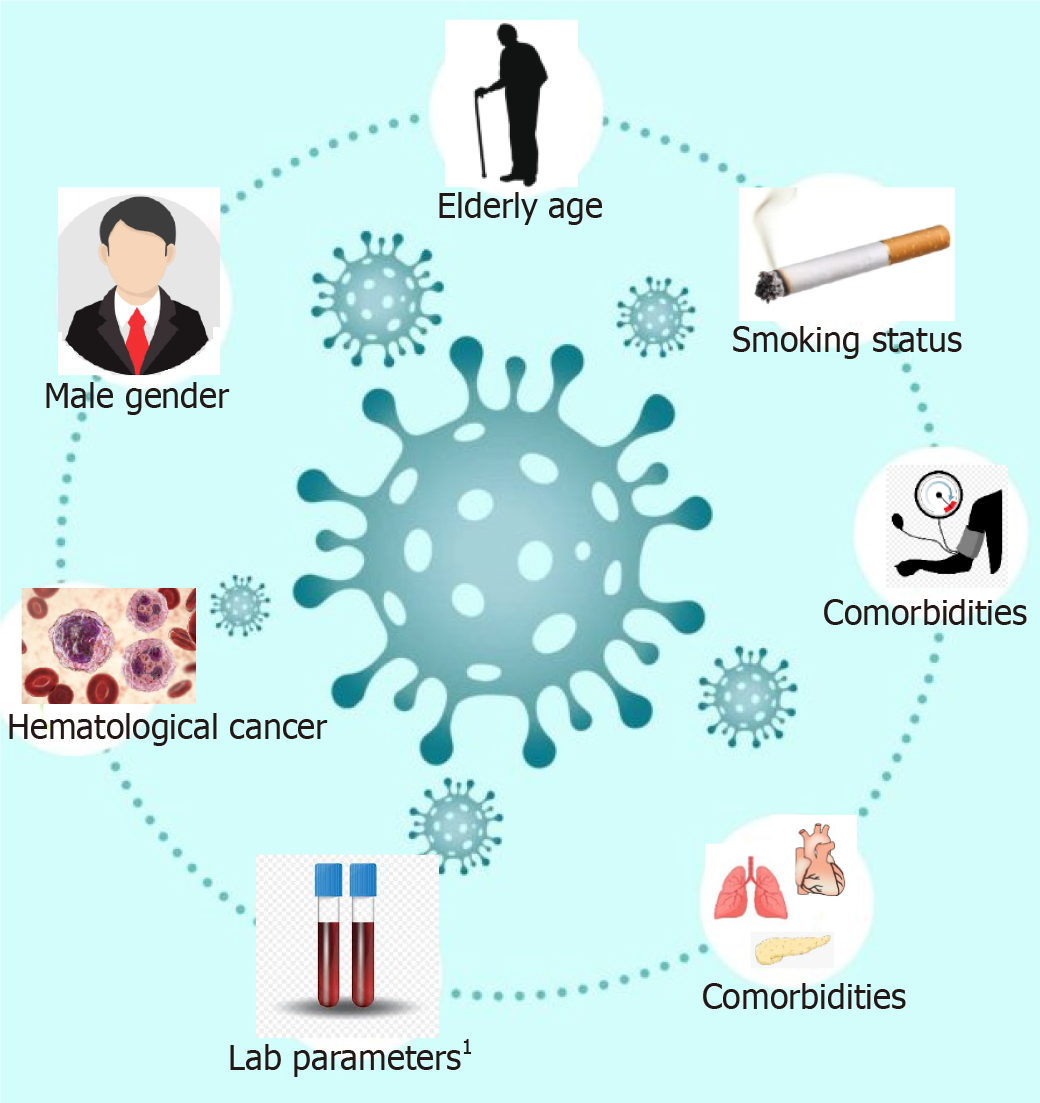
Figure 4 Contributors of worse outcome of among cancer patients with coronavirus disease 2019 infection.
1Higher levels of C-reactive protein, D-dimer, ferritin and procalcitonin.
- Citation: Ramasamy C, Mishra AK, John KJ, Lal A. Clinical considerations for critically ill COVID-19 cancer patients: A systematic review. World J Clin Cases 2021; 9(28): 8441-8452
- URL: https://www.wjgnet.com/2307-8960/full/v9/i28/8441.htm
- DOI: https://dx.doi.org/10.12998/wjcc.v9.i28.8441


