Copyright
©The Author(s) 2021.
World J Clin Cases. Aug 26, 2021; 9(24): 7285-7291
Published online Aug 26, 2021. doi: 10.12998/wjcc.v9.i24.7285
Published online Aug 26, 2021. doi: 10.12998/wjcc.v9.i24.7285
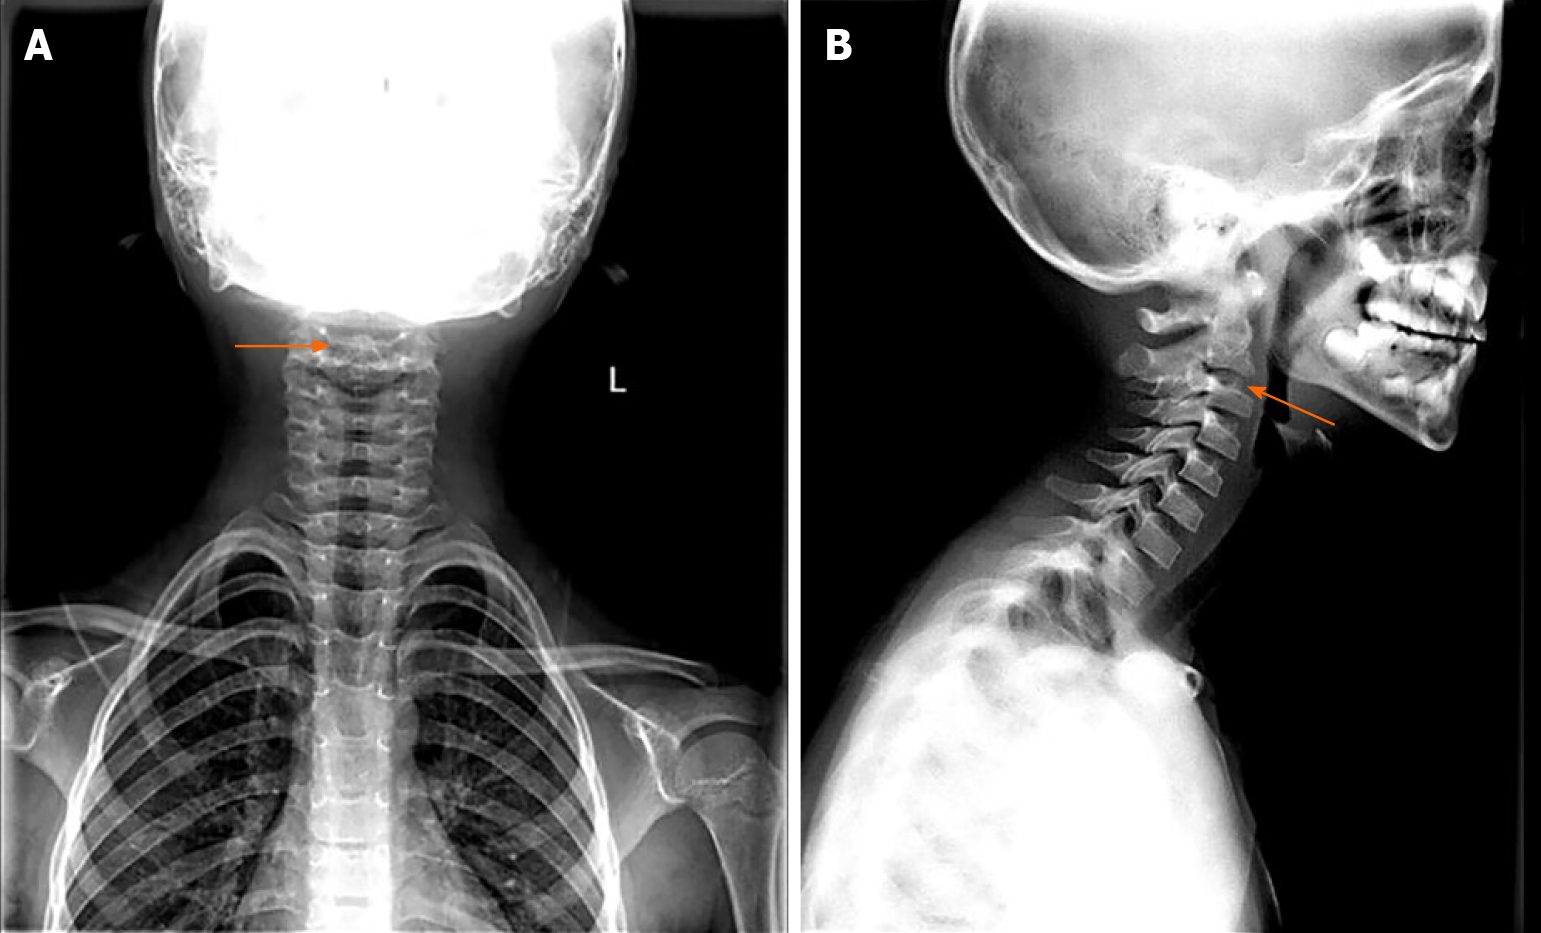
Figure 1 Digital radiography on admission.
A and B: Digital radiography showing a dense projection of the intervertebral disc between the second and third cervical vertebrae.
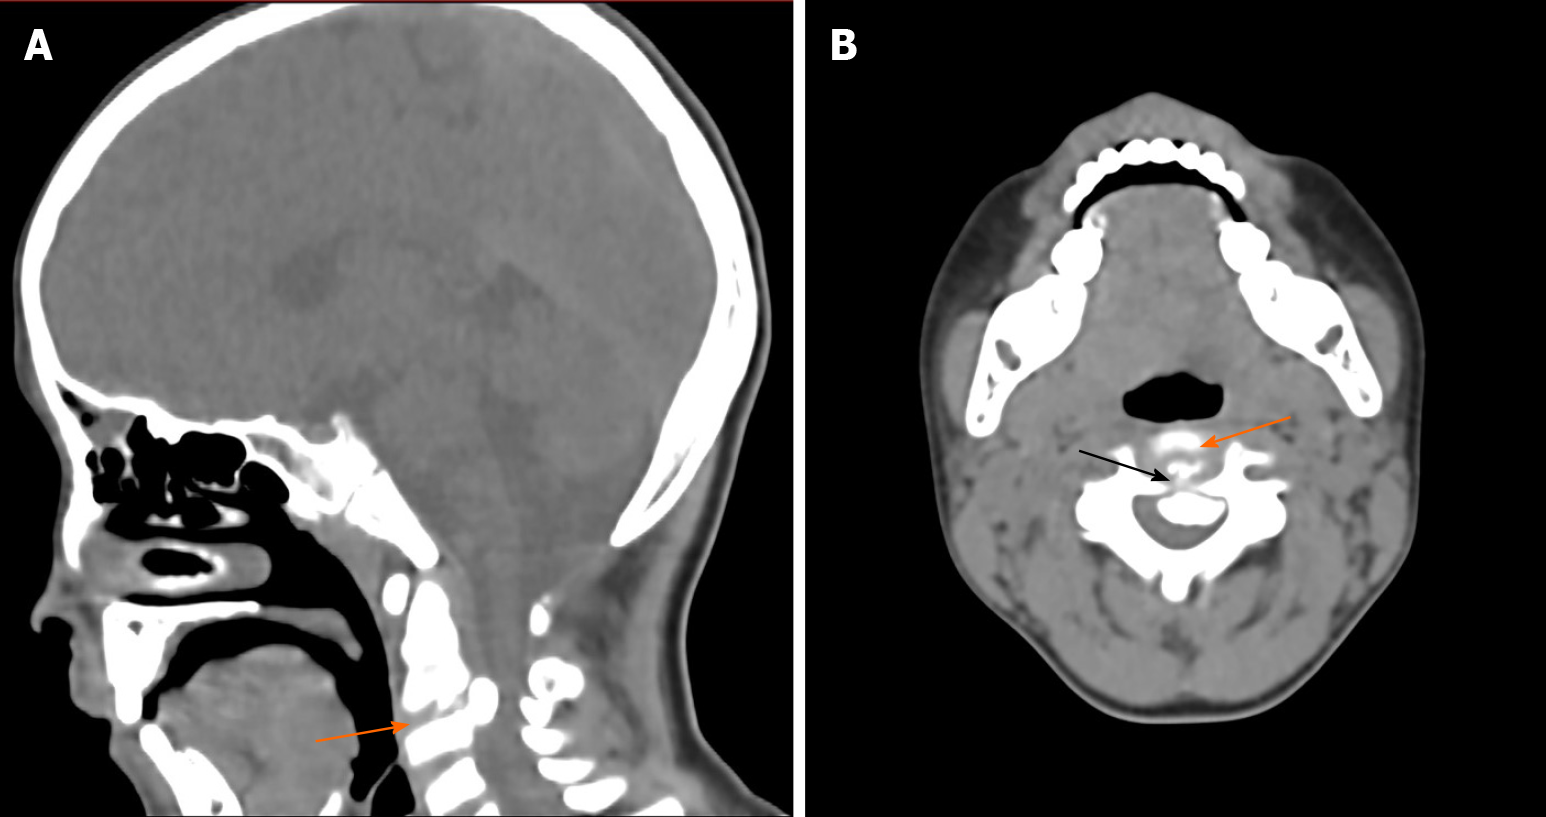
Figure 2 Computed tomography on admission.
A: Sagittal computed tomography revealing cervical disc calcification (orange arrow); B: Axial computed tomography further demonstrating cervical disc calcification (orange arrow) and partial ossification of the posterior longitudinal ligament (black arrow).
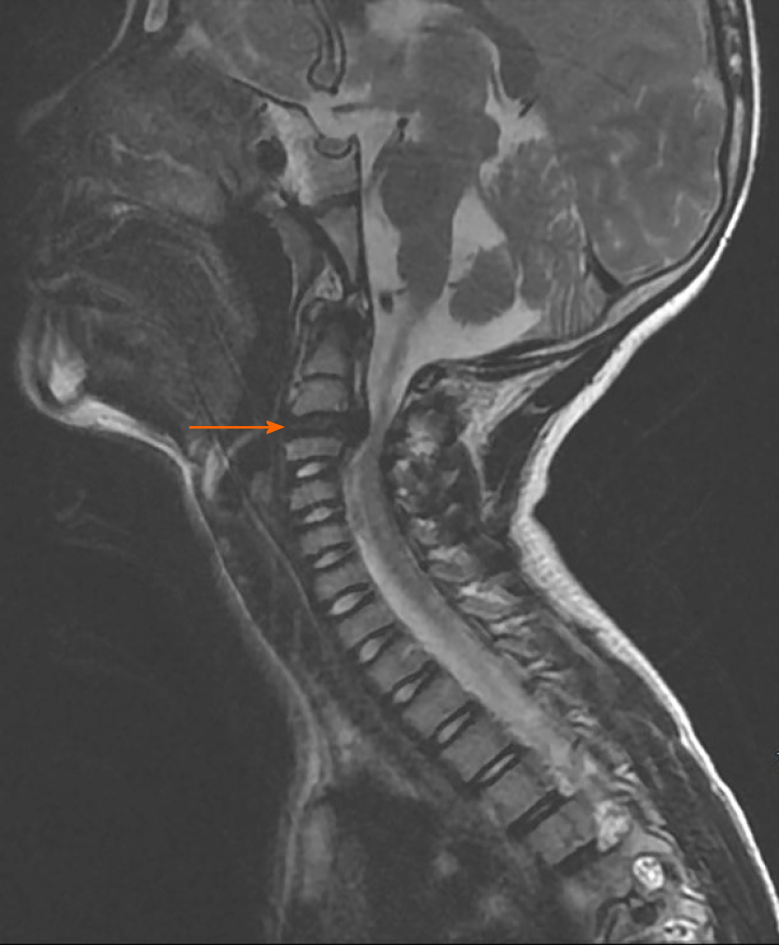
Figure 3 Magnetic resonance imaging on admission.
Magnetic resonance imaging showing substantial spinal stenosis and spinal cord compression (orange arrow).
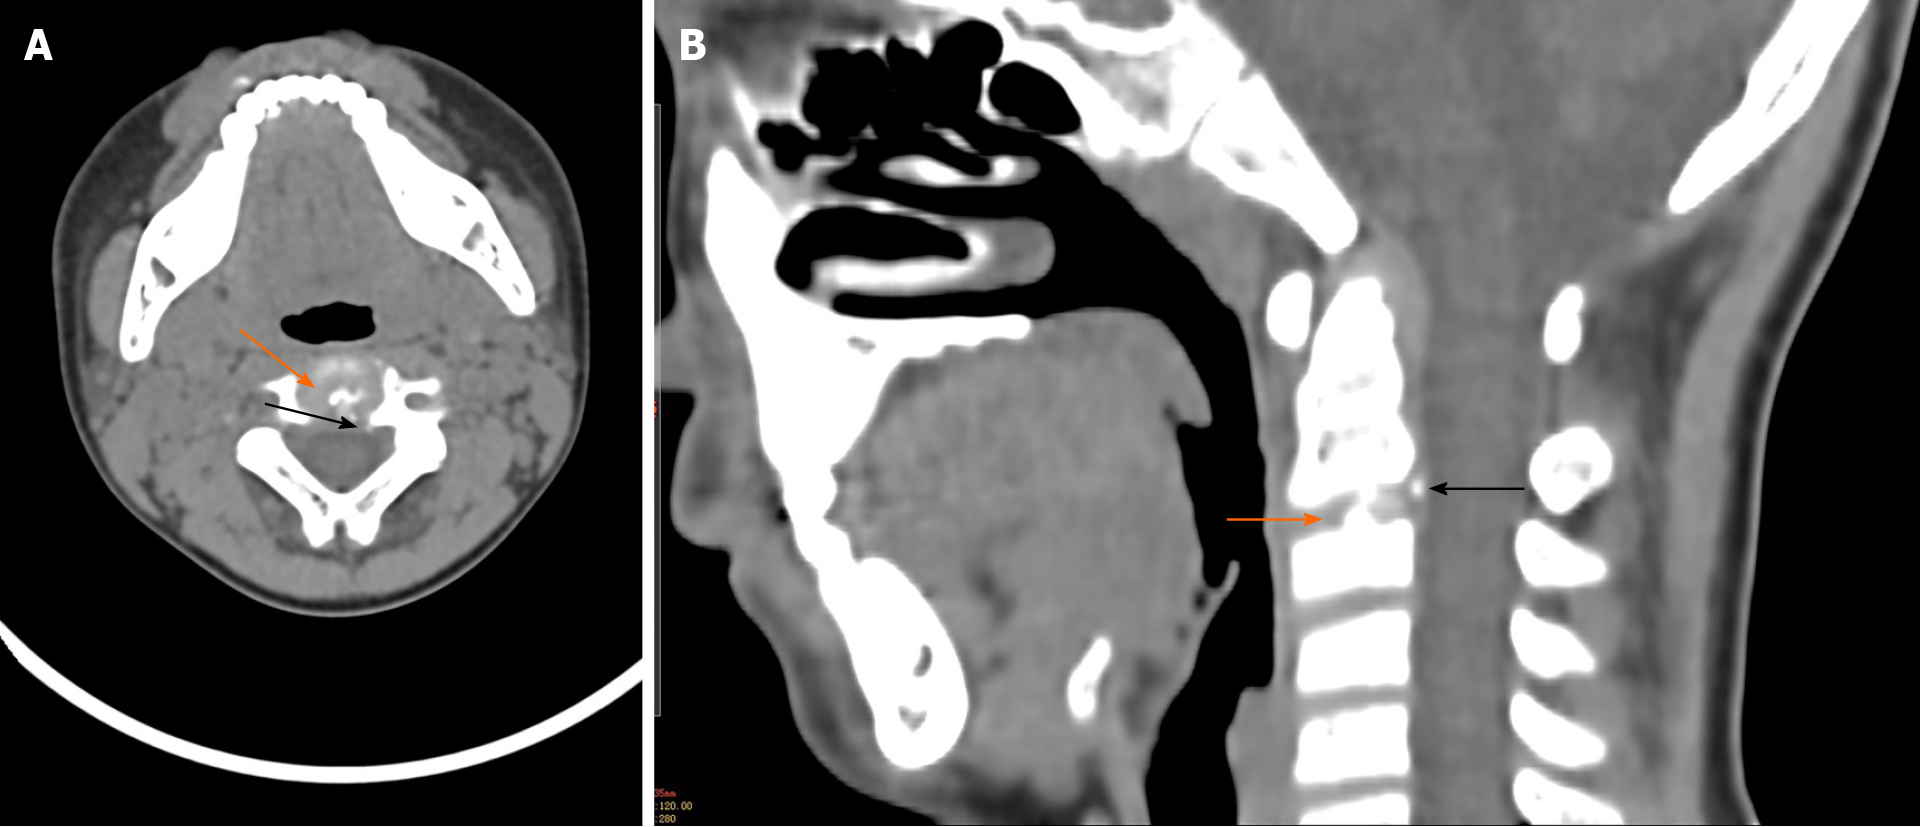
Figure 4 Computed tomography at the 3 mo follow-up.
A and B: Follow-up computed tomography showing that only a small amount of calcification (orange arrow) and slight ossification of the posterior longitudinal ligament (black arrow) remain.
- Citation: Wang XD, Su XJ, Chen YK, Wang WG. Regression of intervertebral disc calcification combined with ossification of the posterior longitudinal ligament: A case report. World J Clin Cases 2021; 9(24): 7285-7291
- URL: https://www.wjgnet.com/2307-8960/full/v9/i24/7285.htm
- DOI: https://dx.doi.org/10.12998/wjcc.v9.i24.7285


