Copyright
©The Author(s) 2021.
World J Clin Cases. Aug 26, 2021; 9(24): 7245-7250
Published online Aug 26, 2021. doi: 10.12998/wjcc.v9.i24.7245
Published online Aug 26, 2021. doi: 10.12998/wjcc.v9.i24.7245
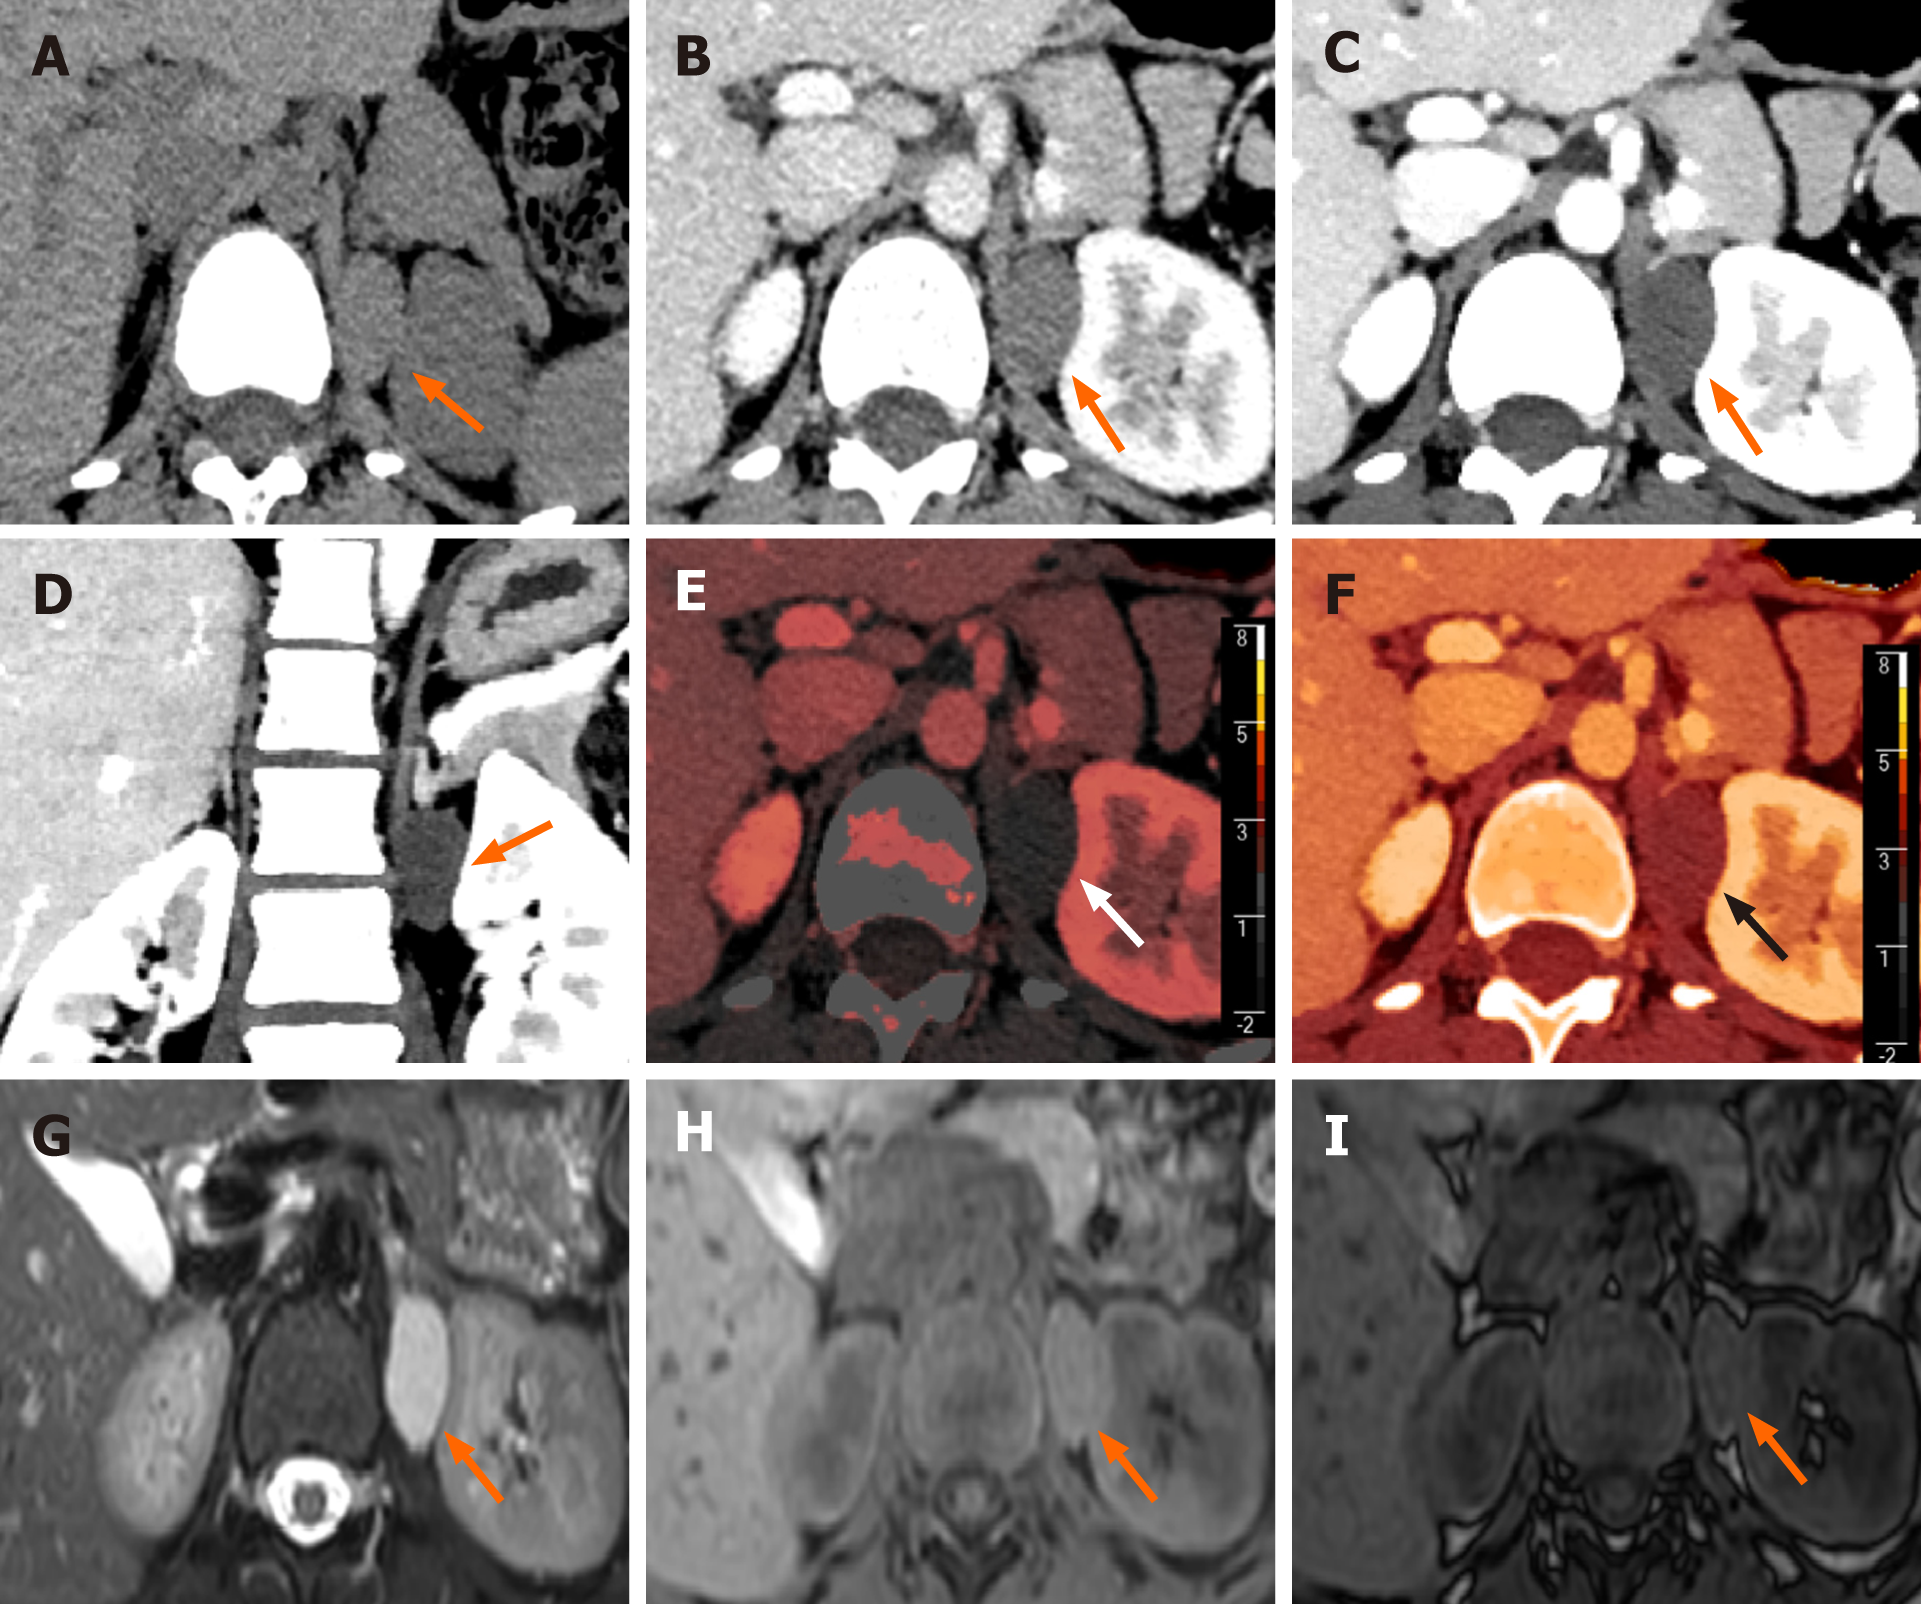
Figure 1 Spectral computed tomography imaging and magnetic resonance imaging in a patient with a bronchogenic cyst in the left suprarenal region.
A: Axial conventional plain image showing a 29 mm × 17 mm × 28 mm well-defined, ovoid, homogeneous lesion in left adrenal area with attenuation of 46 Hounsfield unites (Hu); B: Contrast-enhanced computed tomography (CT) image showing the lesion with slightly enhancement in the venous phase, and CT value was 58 Hu; C: Axial virtual mono-energetic (VMI40KeV) image showing the lesion without enhancement in the venous phase, and CT value was 47 Hu; D: Coronal VMI40KeV image showing an obvious lesion with a clear margin; E and F: Spectral images showing an ovoid lesion, in which iodine density value was less than 0.001 mg/mL and Z-effective value was 7.25; G and H: Axial magnetic resonance imaging images showing a lesion with intermediate signal intensity on T1-weighted imaging (T1WI) and hyperintense signal on T2-weighted imaging; I: Opposed-phase image showing the lesion without obvious signal loss compared to T1WI.
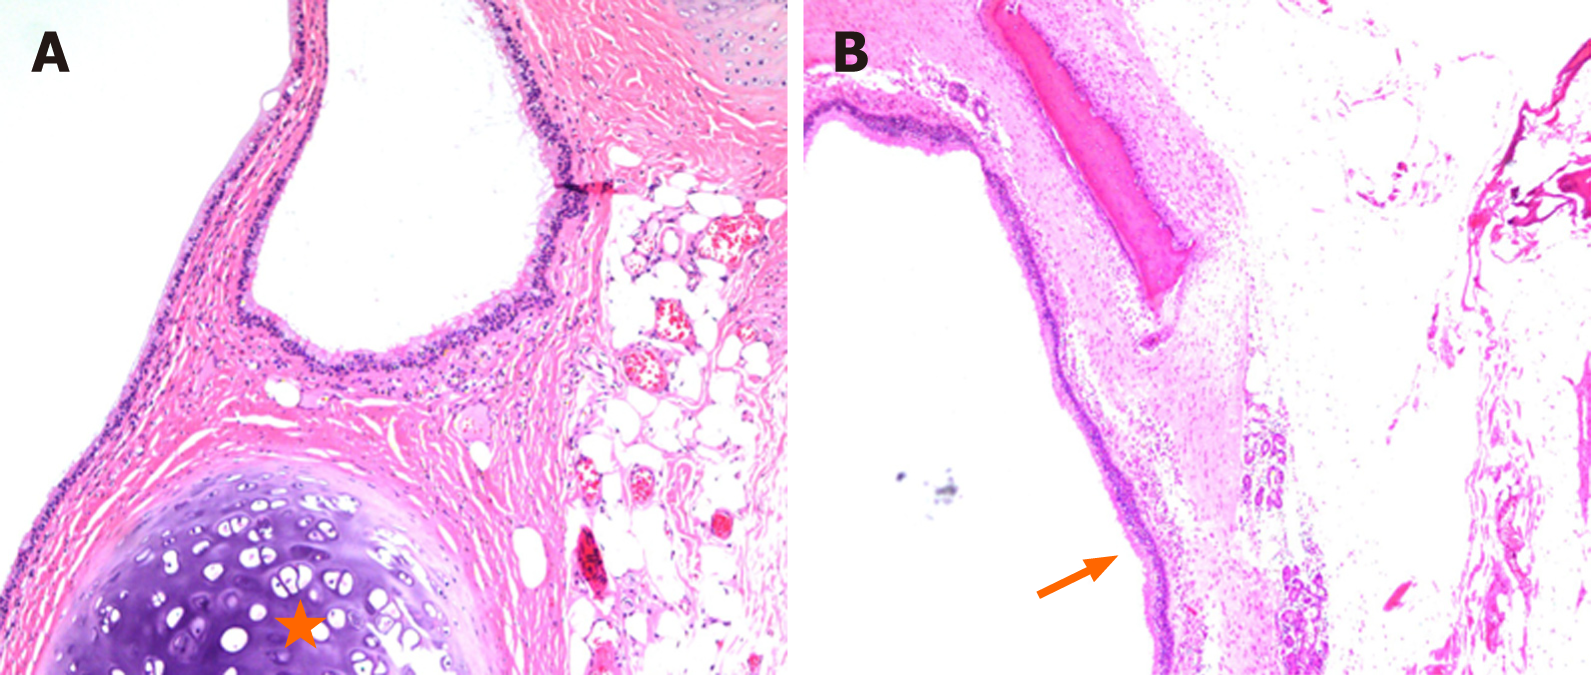
Figure 2 Pathological appearance of a bronchogenic cyst in the left suprarenal region (hematoxylin and eosin).
A: Cystic wall parenchymal portion containing mature hyaline cartilage (asterisk, × 100); B: The cystic lining composing of a thin layer of pseudo-stratified, ciliated, and columnar epithelium (arrow, × 40).
- Citation: Wu LD, Wen K, Cheng ZR, Alwalid O, Han P. Retroperitoneal bronchogenic cyst in suprarenal region treated by laparoscopic resection: A case report. World J Clin Cases 2021; 9(24): 7245-7250
- URL: https://www.wjgnet.com/2307-8960/full/v9/i24/7245.htm
- DOI: https://dx.doi.org/10.12998/wjcc.v9.i24.7245


