Copyright
©The Author(s) 2021.
World J Clin Cases. Aug 26, 2021; 9(24): 7154-7162
Published online Aug 26, 2021. doi: 10.12998/wjcc.v9.i24.7154
Published online Aug 26, 2021. doi: 10.12998/wjcc.v9.i24.7154
Figure 1 Computed tomography suggested a right hepatic hemangioma.
A: Plain; B: Arterial phase; C: Venous phase.
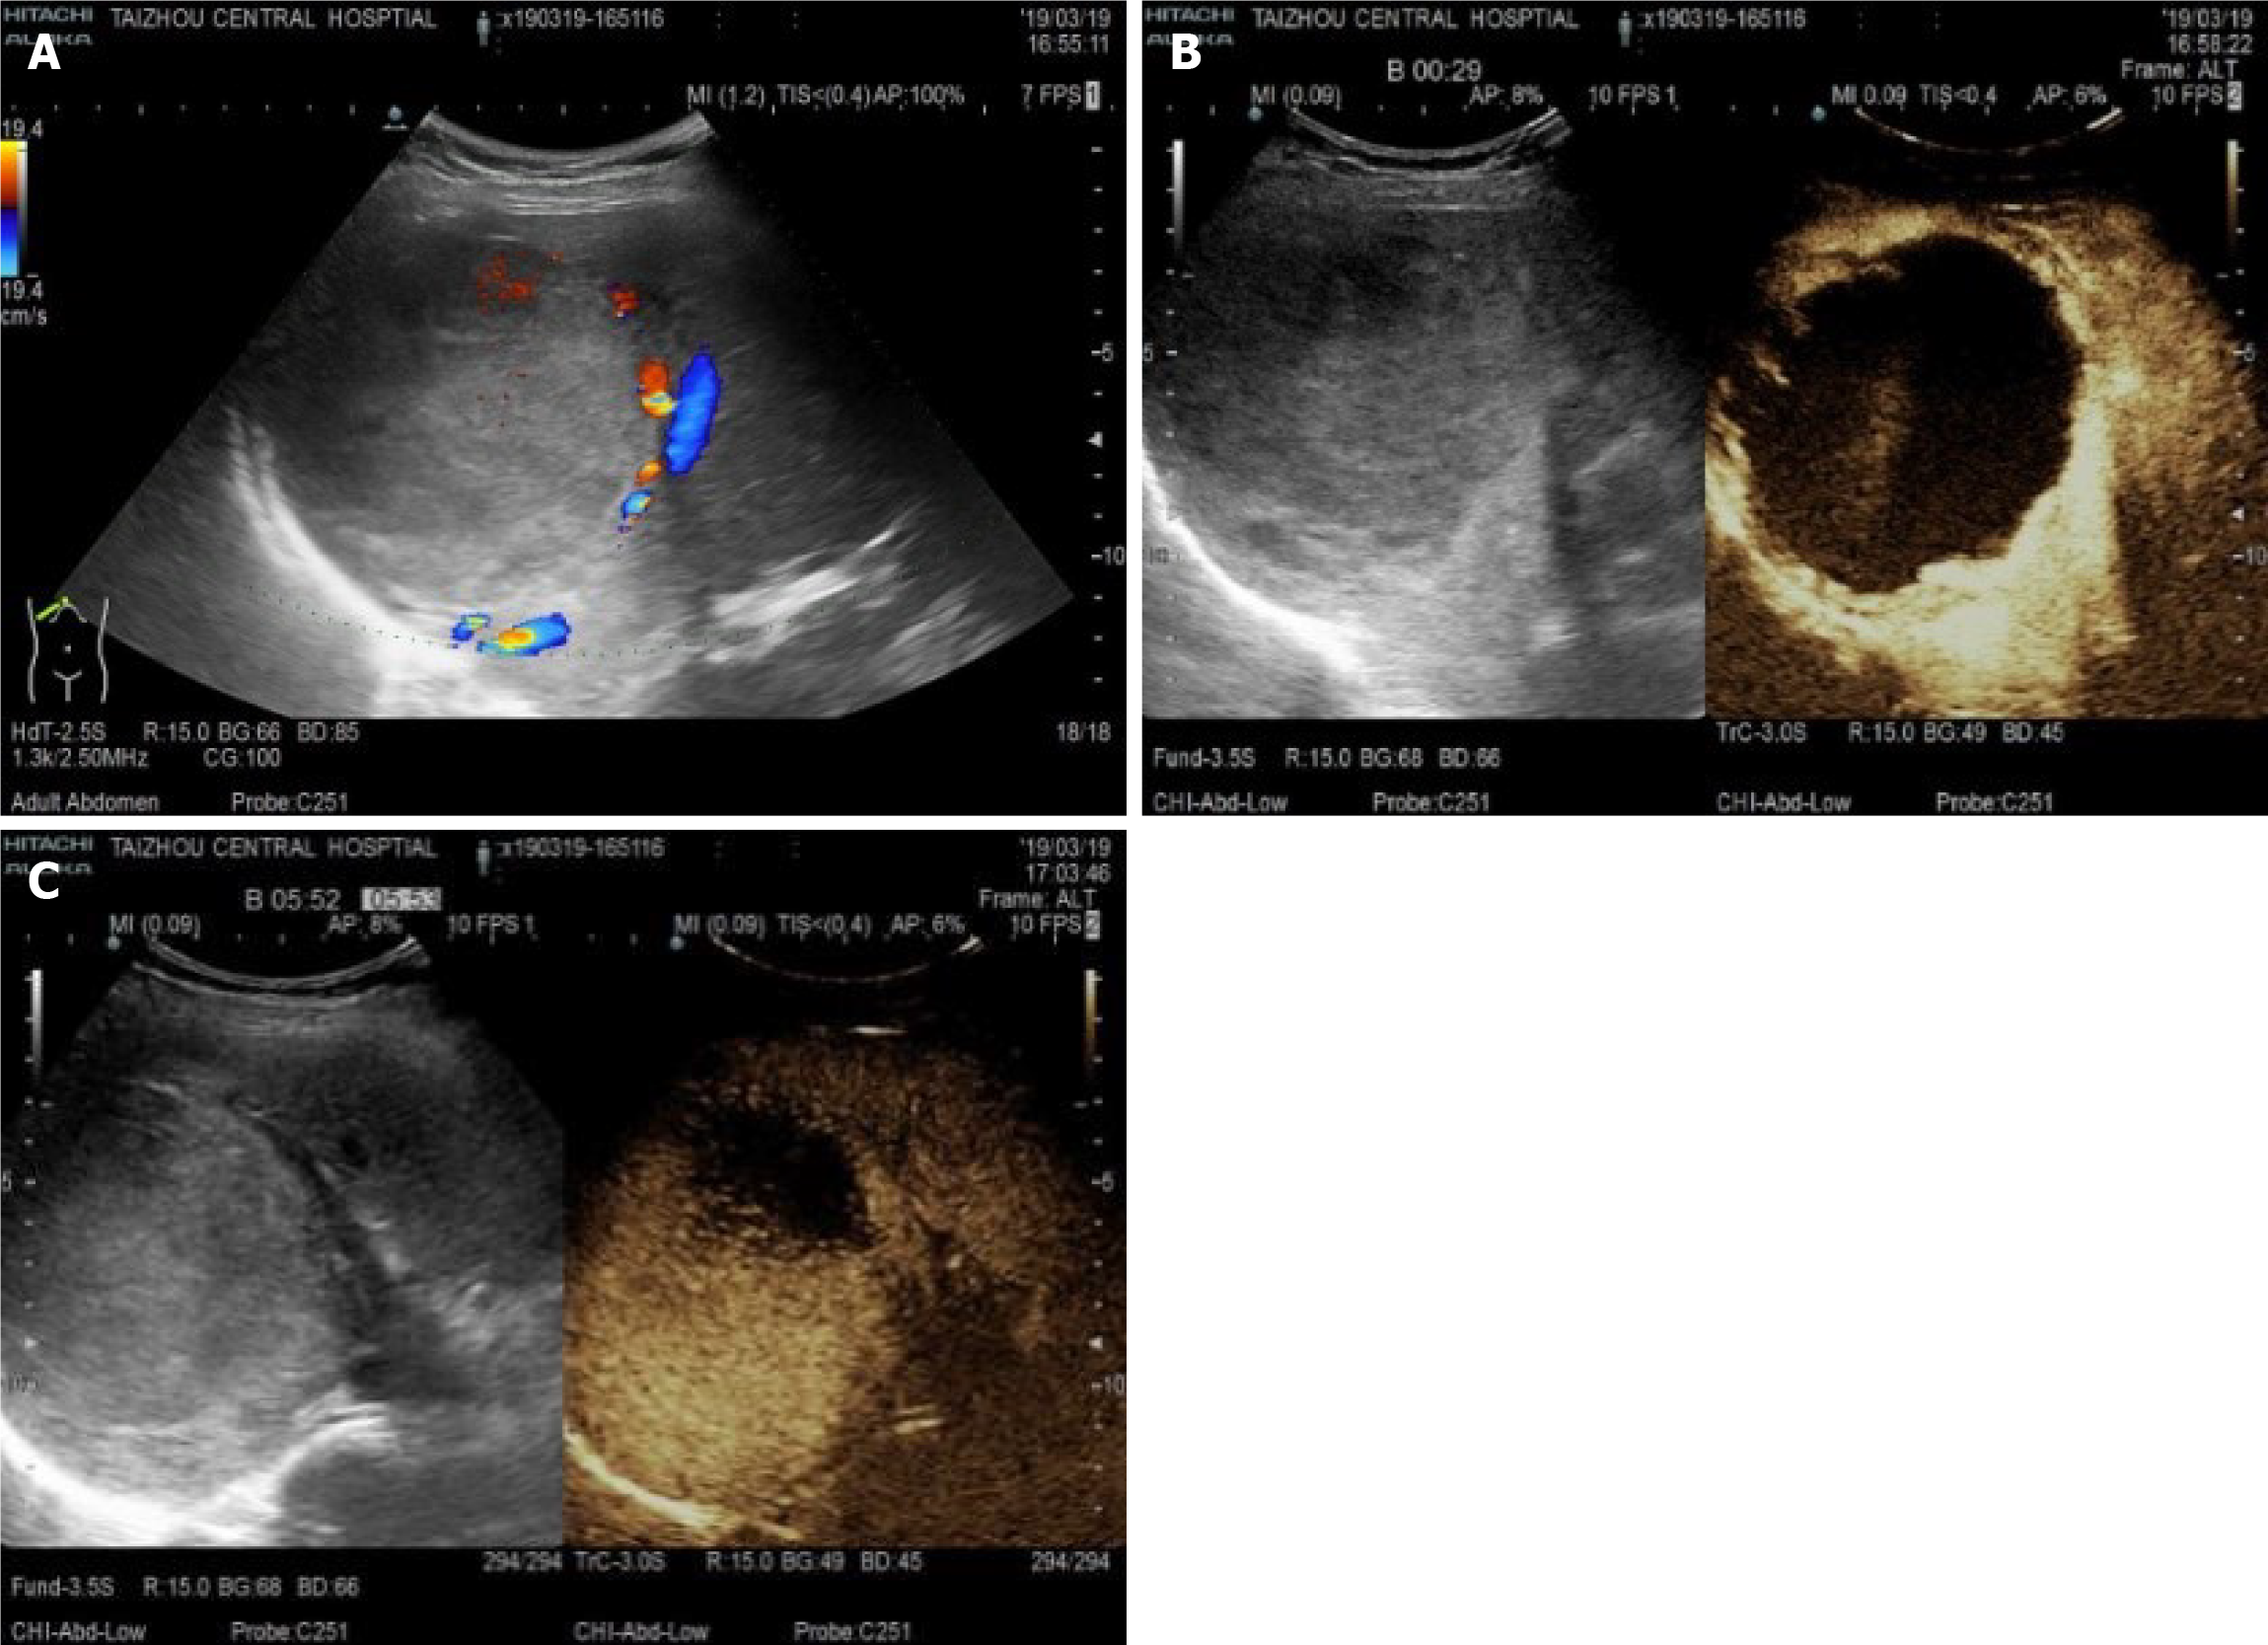
Figure 2 Ultrasound angiography showed that the right posterior hepatic lobe displayed a strong echogenic area with a size of 95 mm × 97 mm × 117 mm.
A: Ultrasound indicated a liver hemangioma; B: In contrast mode, after injection of sulfur hexafluoride microbubbles; C: In contrast mode, the contrast agent filled slowly.
Figure 3 Right liver.
A and B: Large abnormal staining area in the right liver; C: Abnormal staining area disappeared.
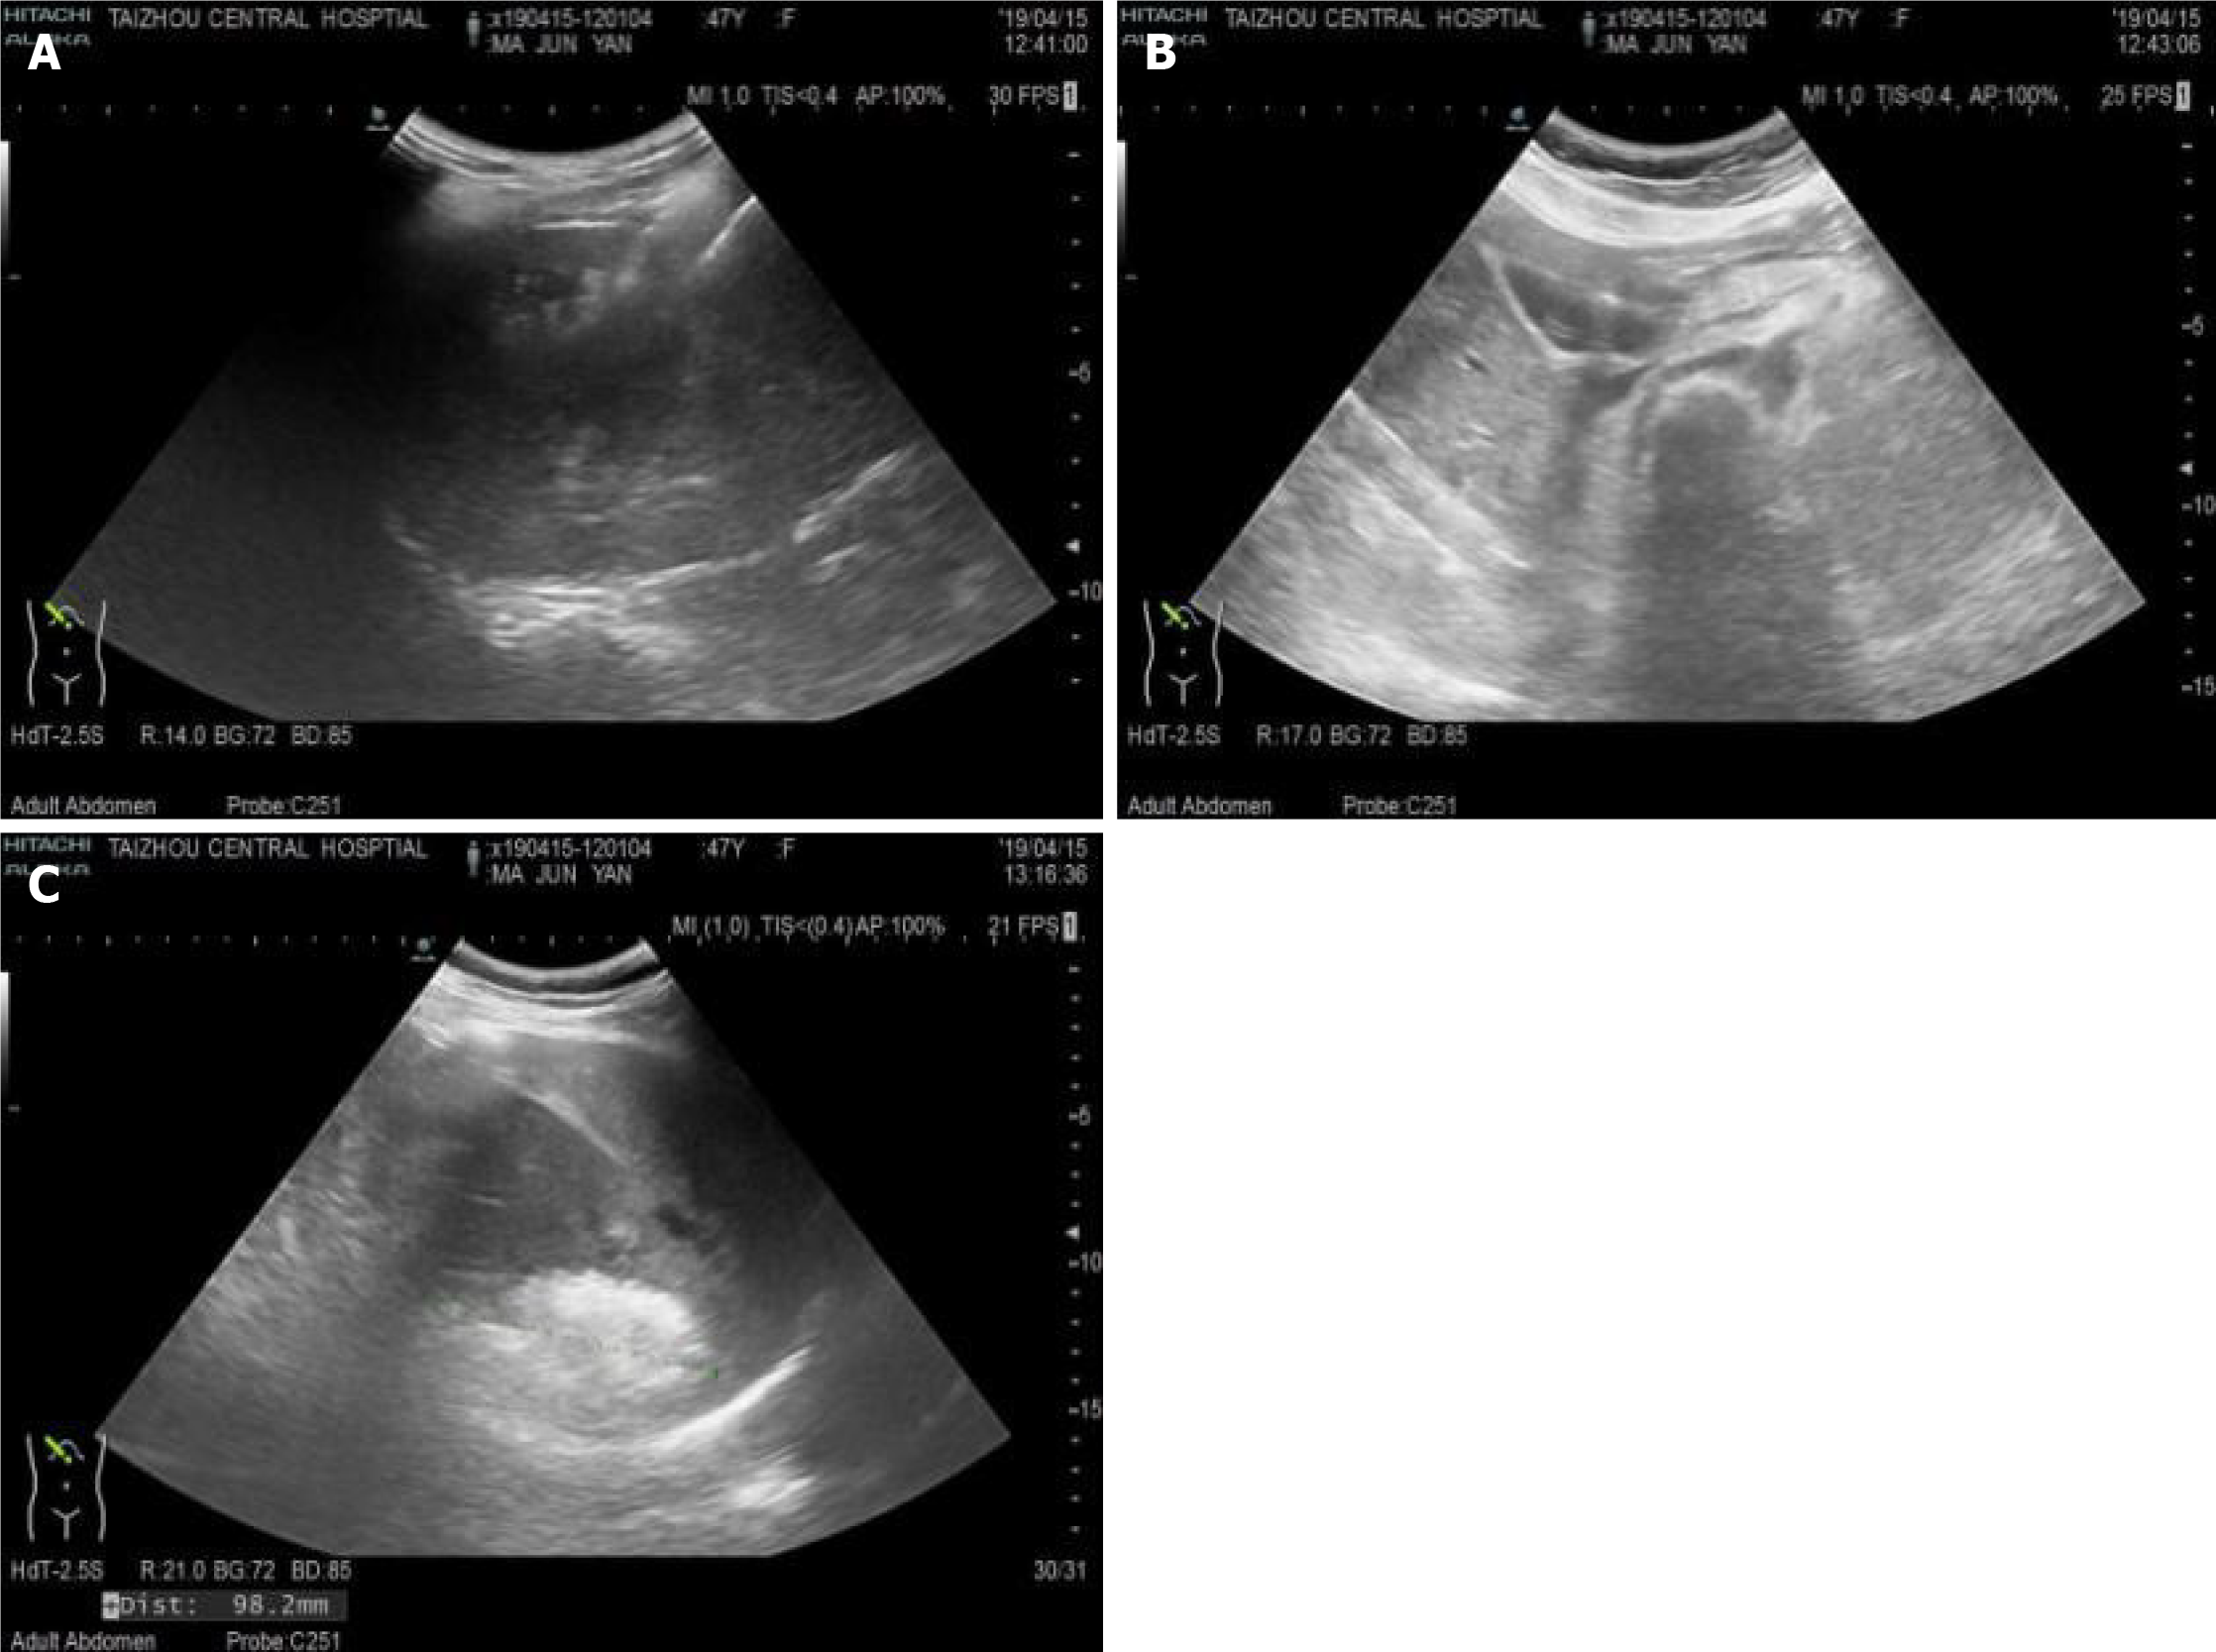
Figure 4 Partial images of radiofrequency ablation guided by ultrasound.
A: Right posterior hepatic lobe lesion in the posterior segment, energy: 55 W × 600 s; B: Right posterior lobe lesion in the middle of the posterior region, energy: 55 W × 600 s; C: The dynamic observation of the mass area was covered by a strong echo.
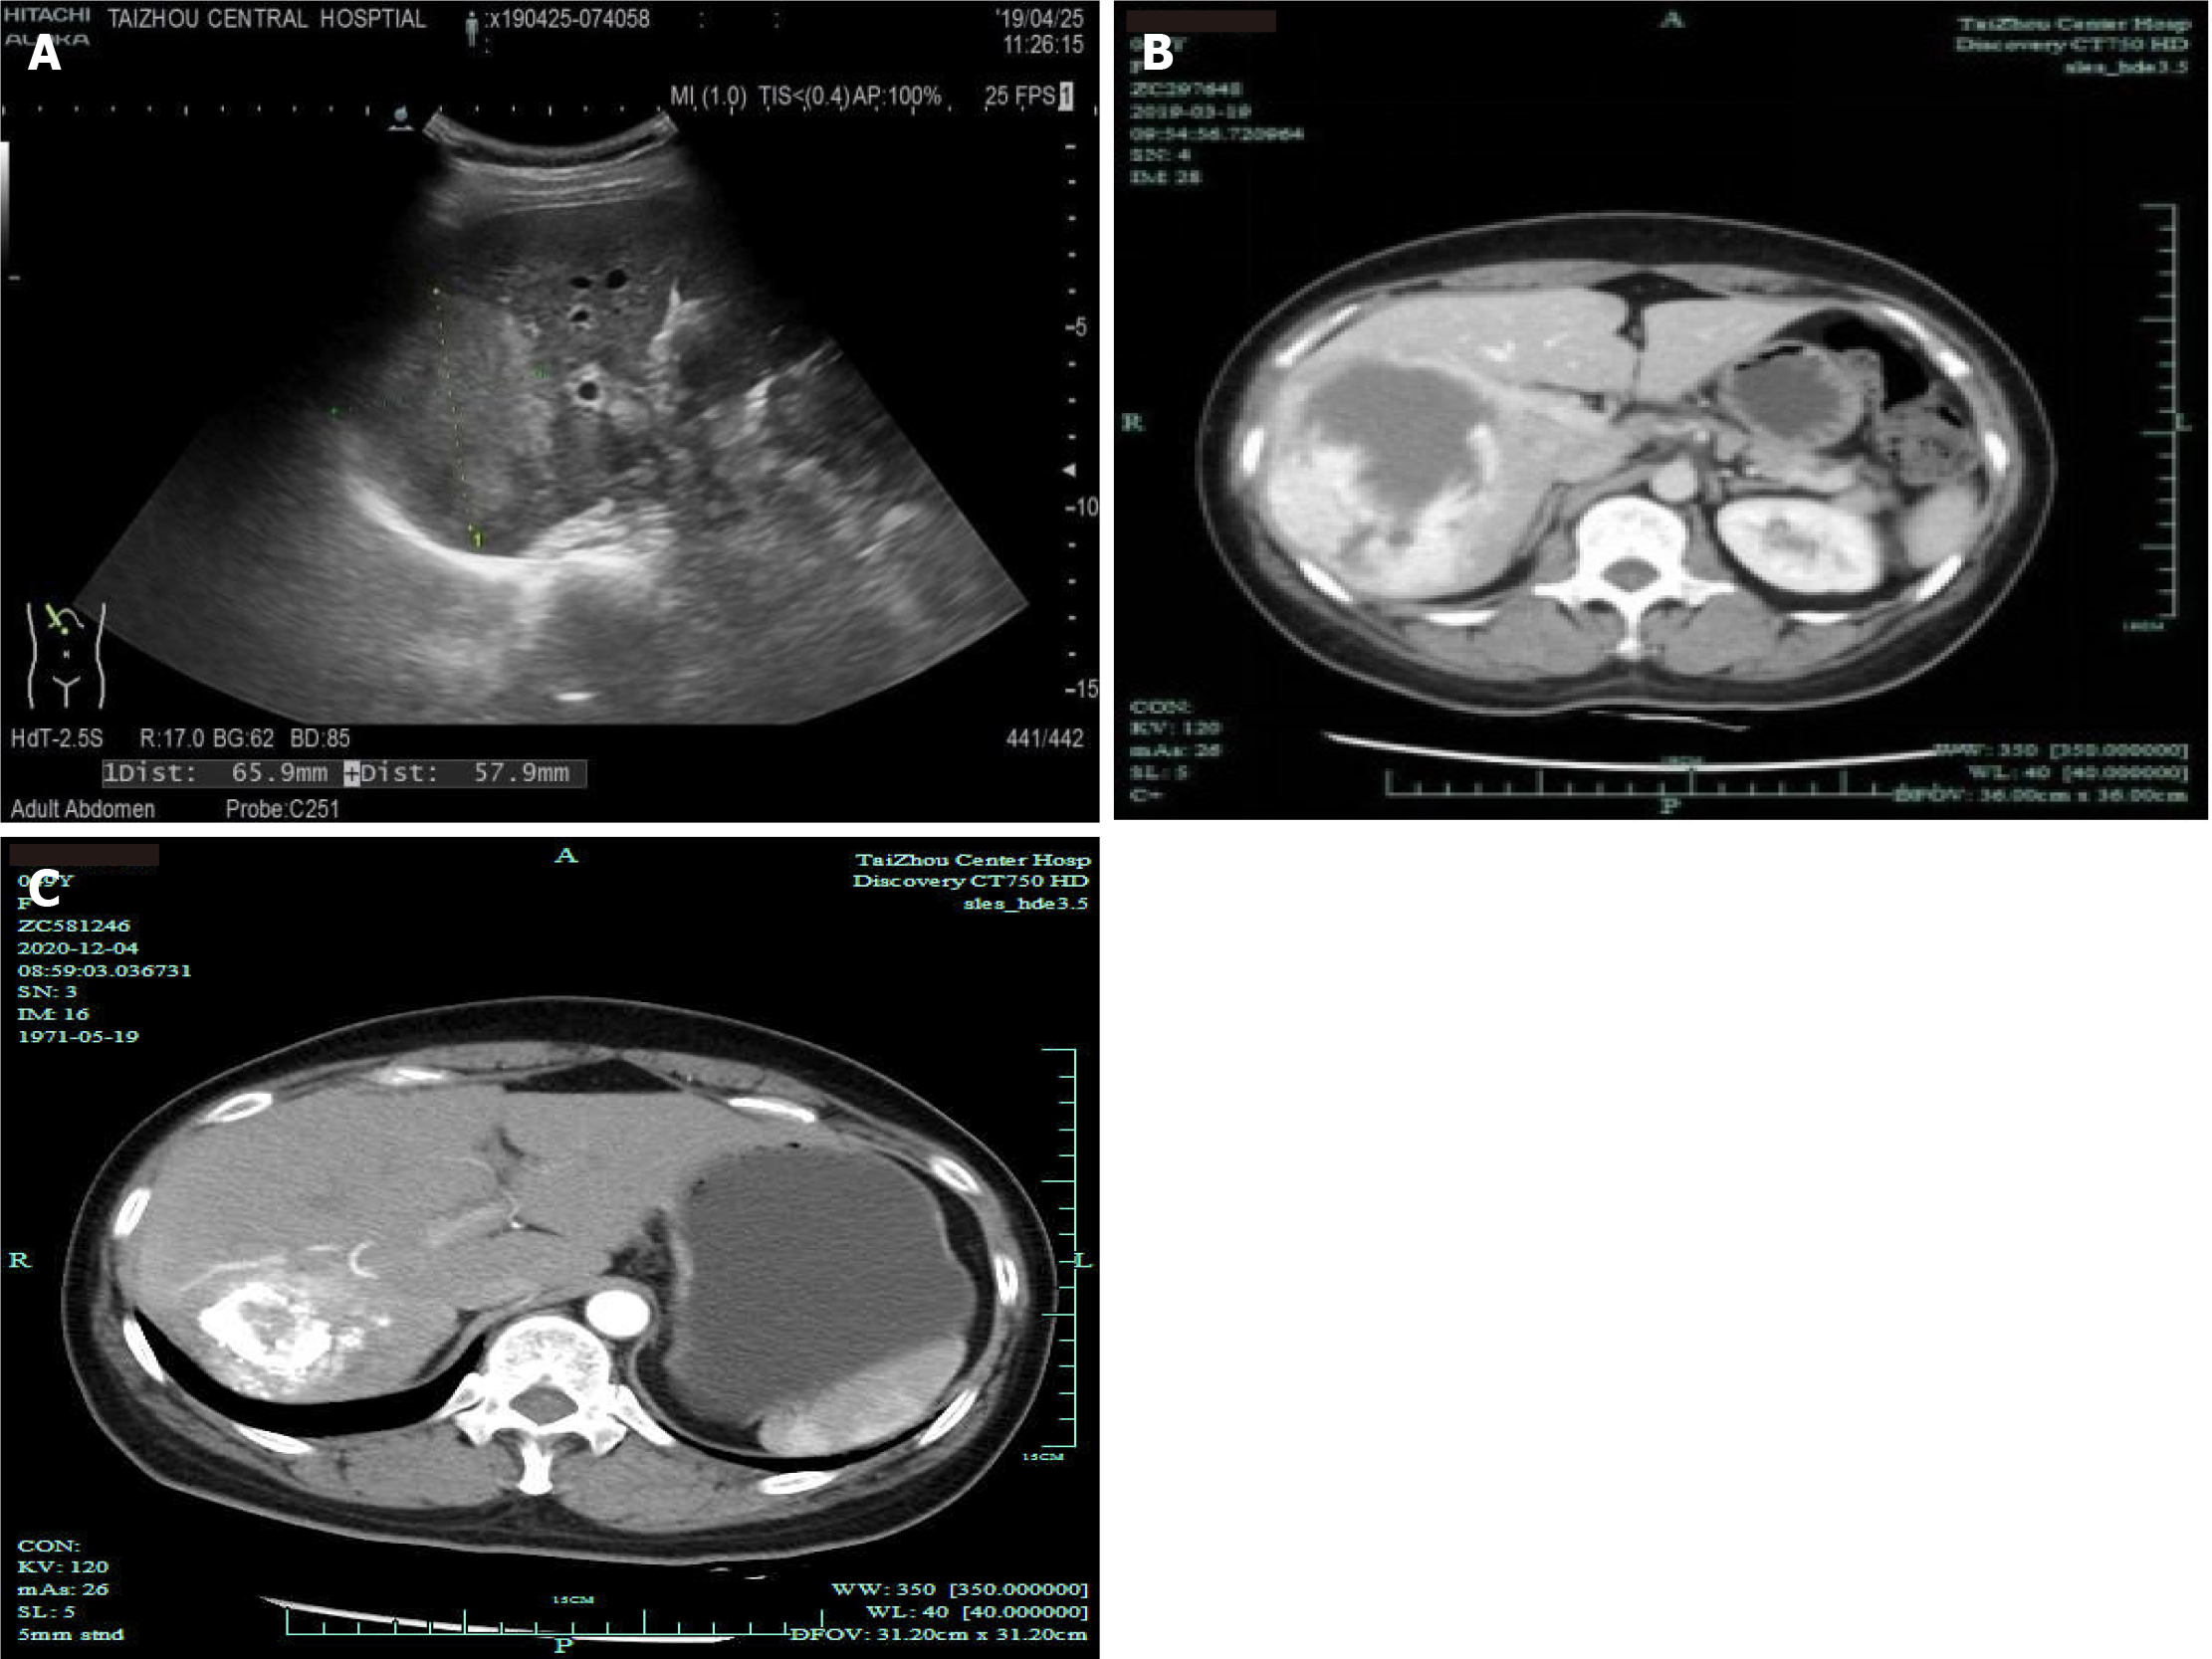
Figure 5 Results of ultrasound and computed tomography reexaminations after treatment.
A: After transcatheter arterial embolization; B: 2 mo after discharge; C: 1 year after discharge.
- Citation: Wang LZ, Wang KP, Mo JG, Wang GY, Jin C, Jiang H, Feng YF. Minimally invasive treatment of hepatic hemangioma by transcatheter arterial embolization combined with microwave ablation: A case report. World J Clin Cases 2021; 9(24): 7154-7162
- URL: https://www.wjgnet.com/2307-8960/full/v9/i24/7154.htm
- DOI: https://dx.doi.org/10.12998/wjcc.v9.i24.7154


