Copyright
©The Author(s) 2021.
World J Clin Cases. Aug 26, 2021; 9(24): 7099-7109
Published online Aug 26, 2021. doi: 10.12998/wjcc.v9.i24.7099
Published online Aug 26, 2021. doi: 10.12998/wjcc.v9.i24.7099
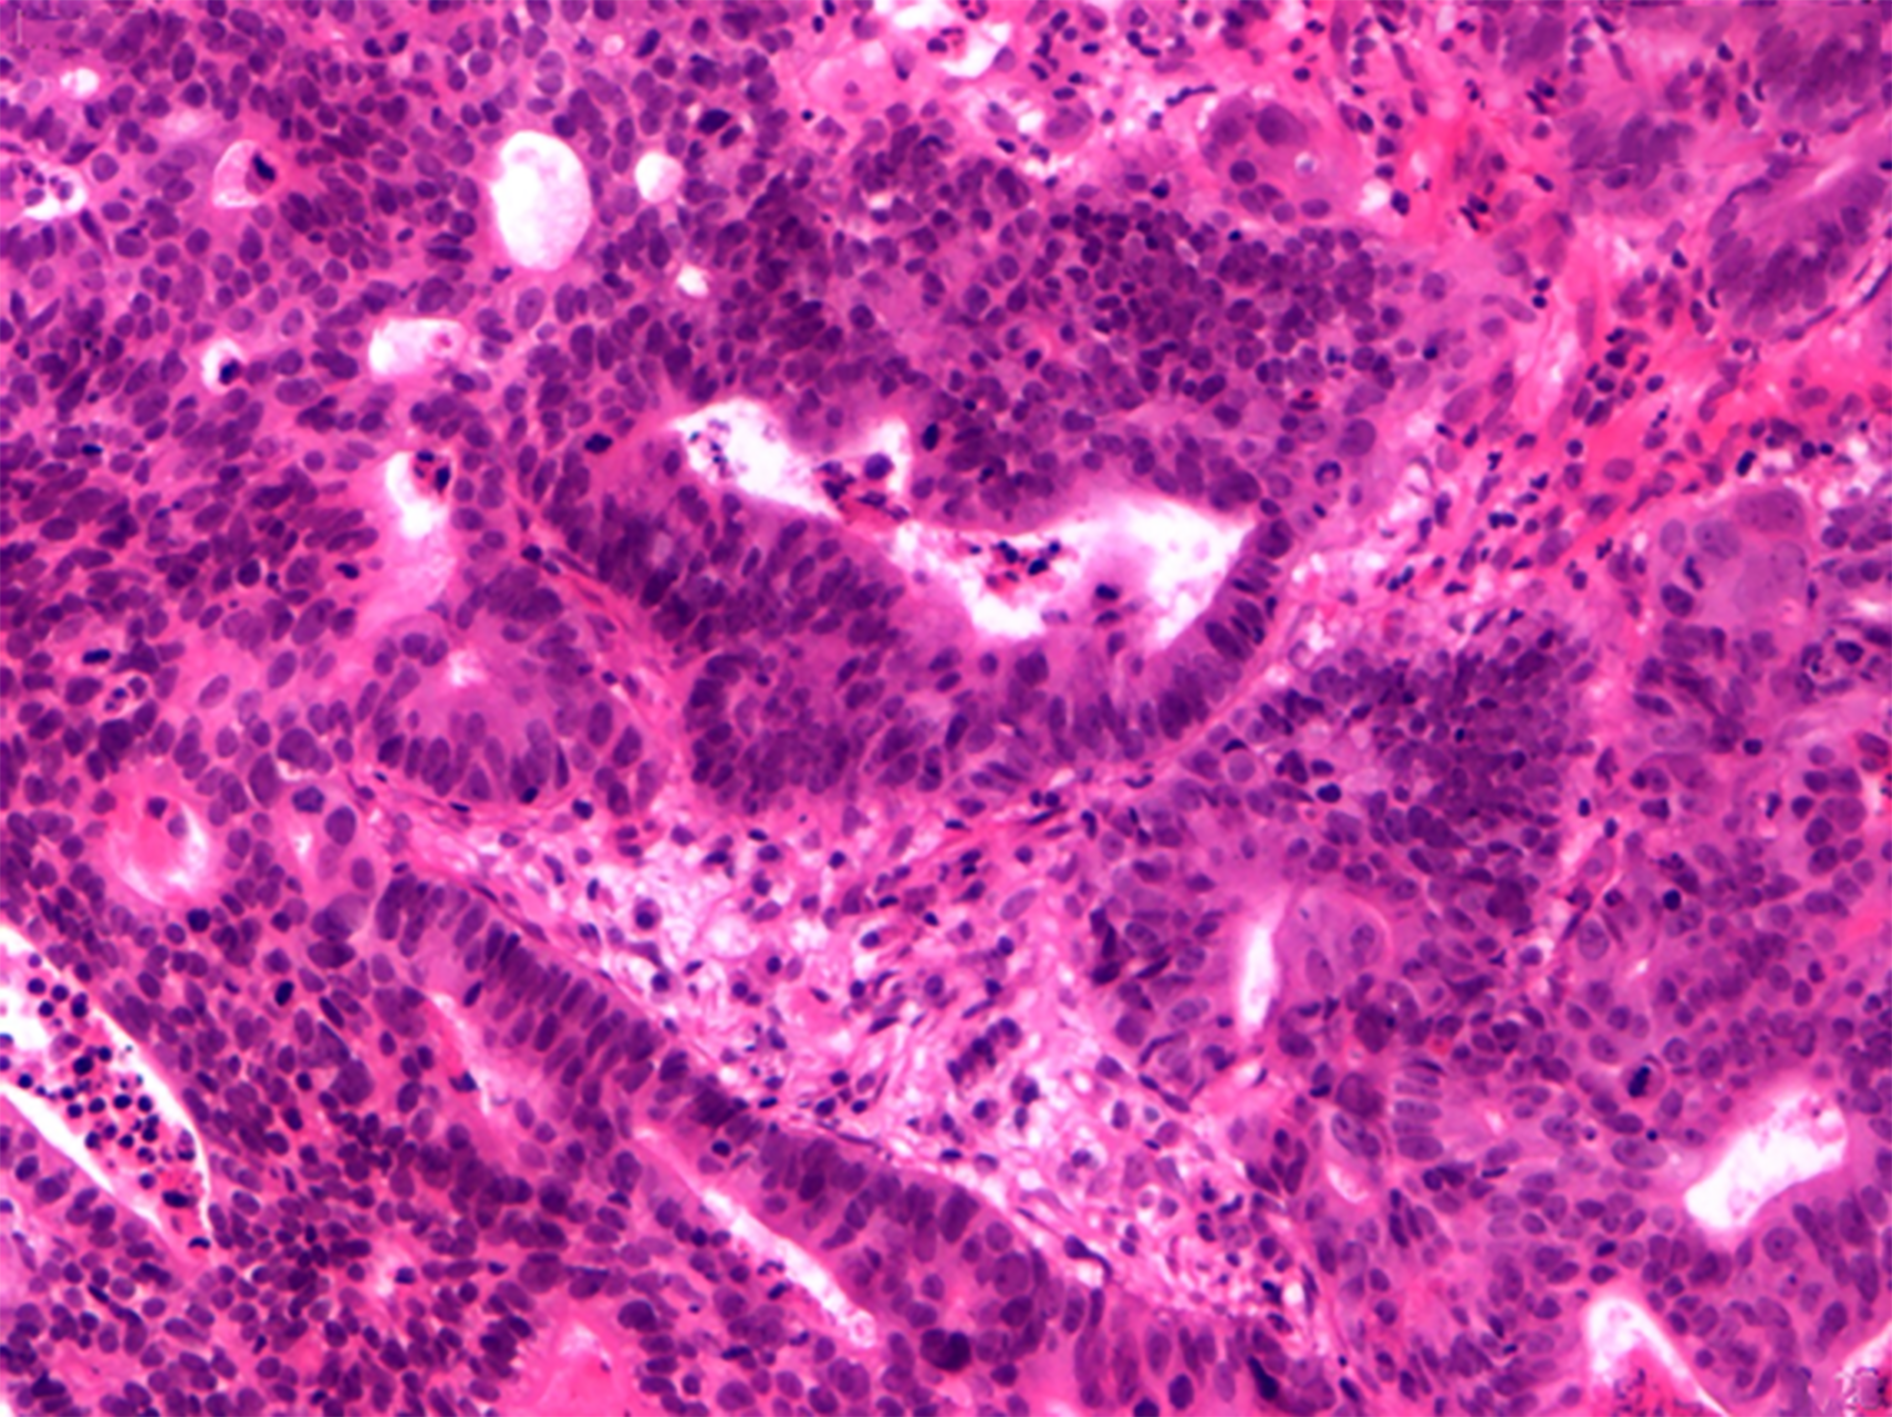
Figure 1 Result of tissue biopsy (× 200, hematoxylin-eosin staining).
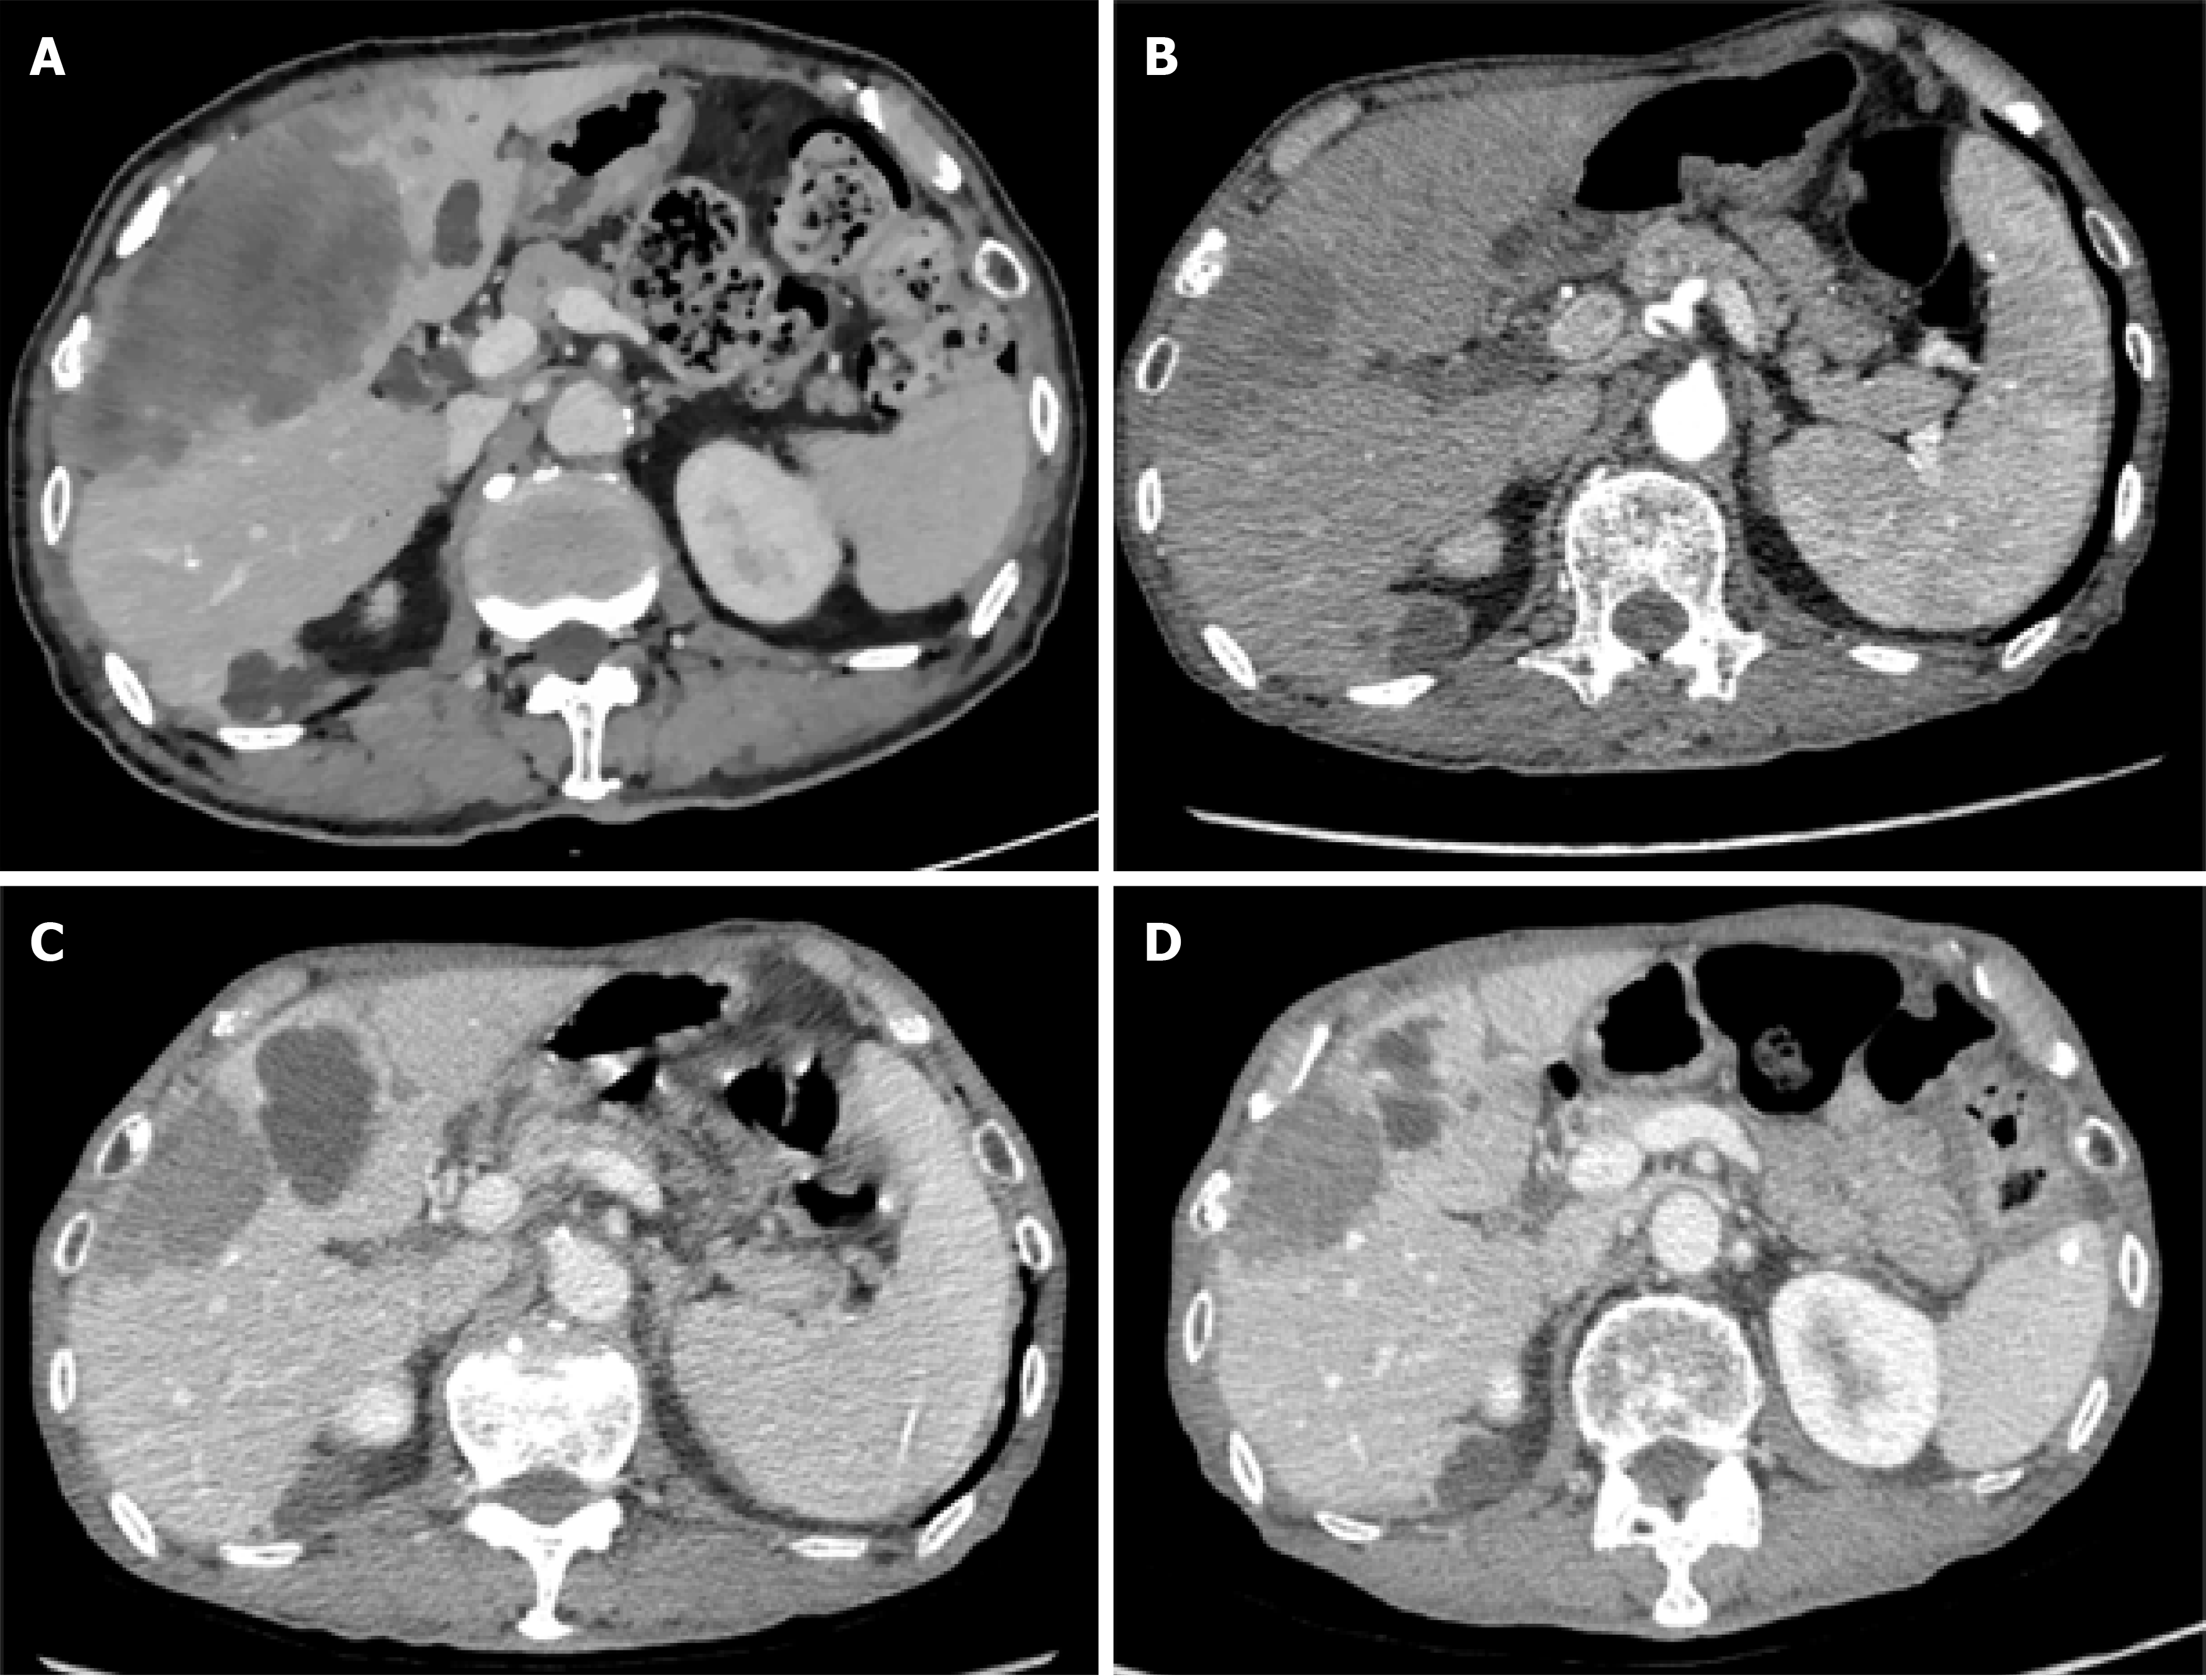
Figure 2 Response after the 12-cycle chemotherapy regimen.
A: Image on January 11, 2019 (before treatment); B: Image on April 13, 2019 (after the third treatment); C: Image on September 15, 2019 (after the sixth treatment); and D: Image on January 10, 2020 (after the twelfth treatment). Note: The spleen enlarged significantly with treatment (B and C).
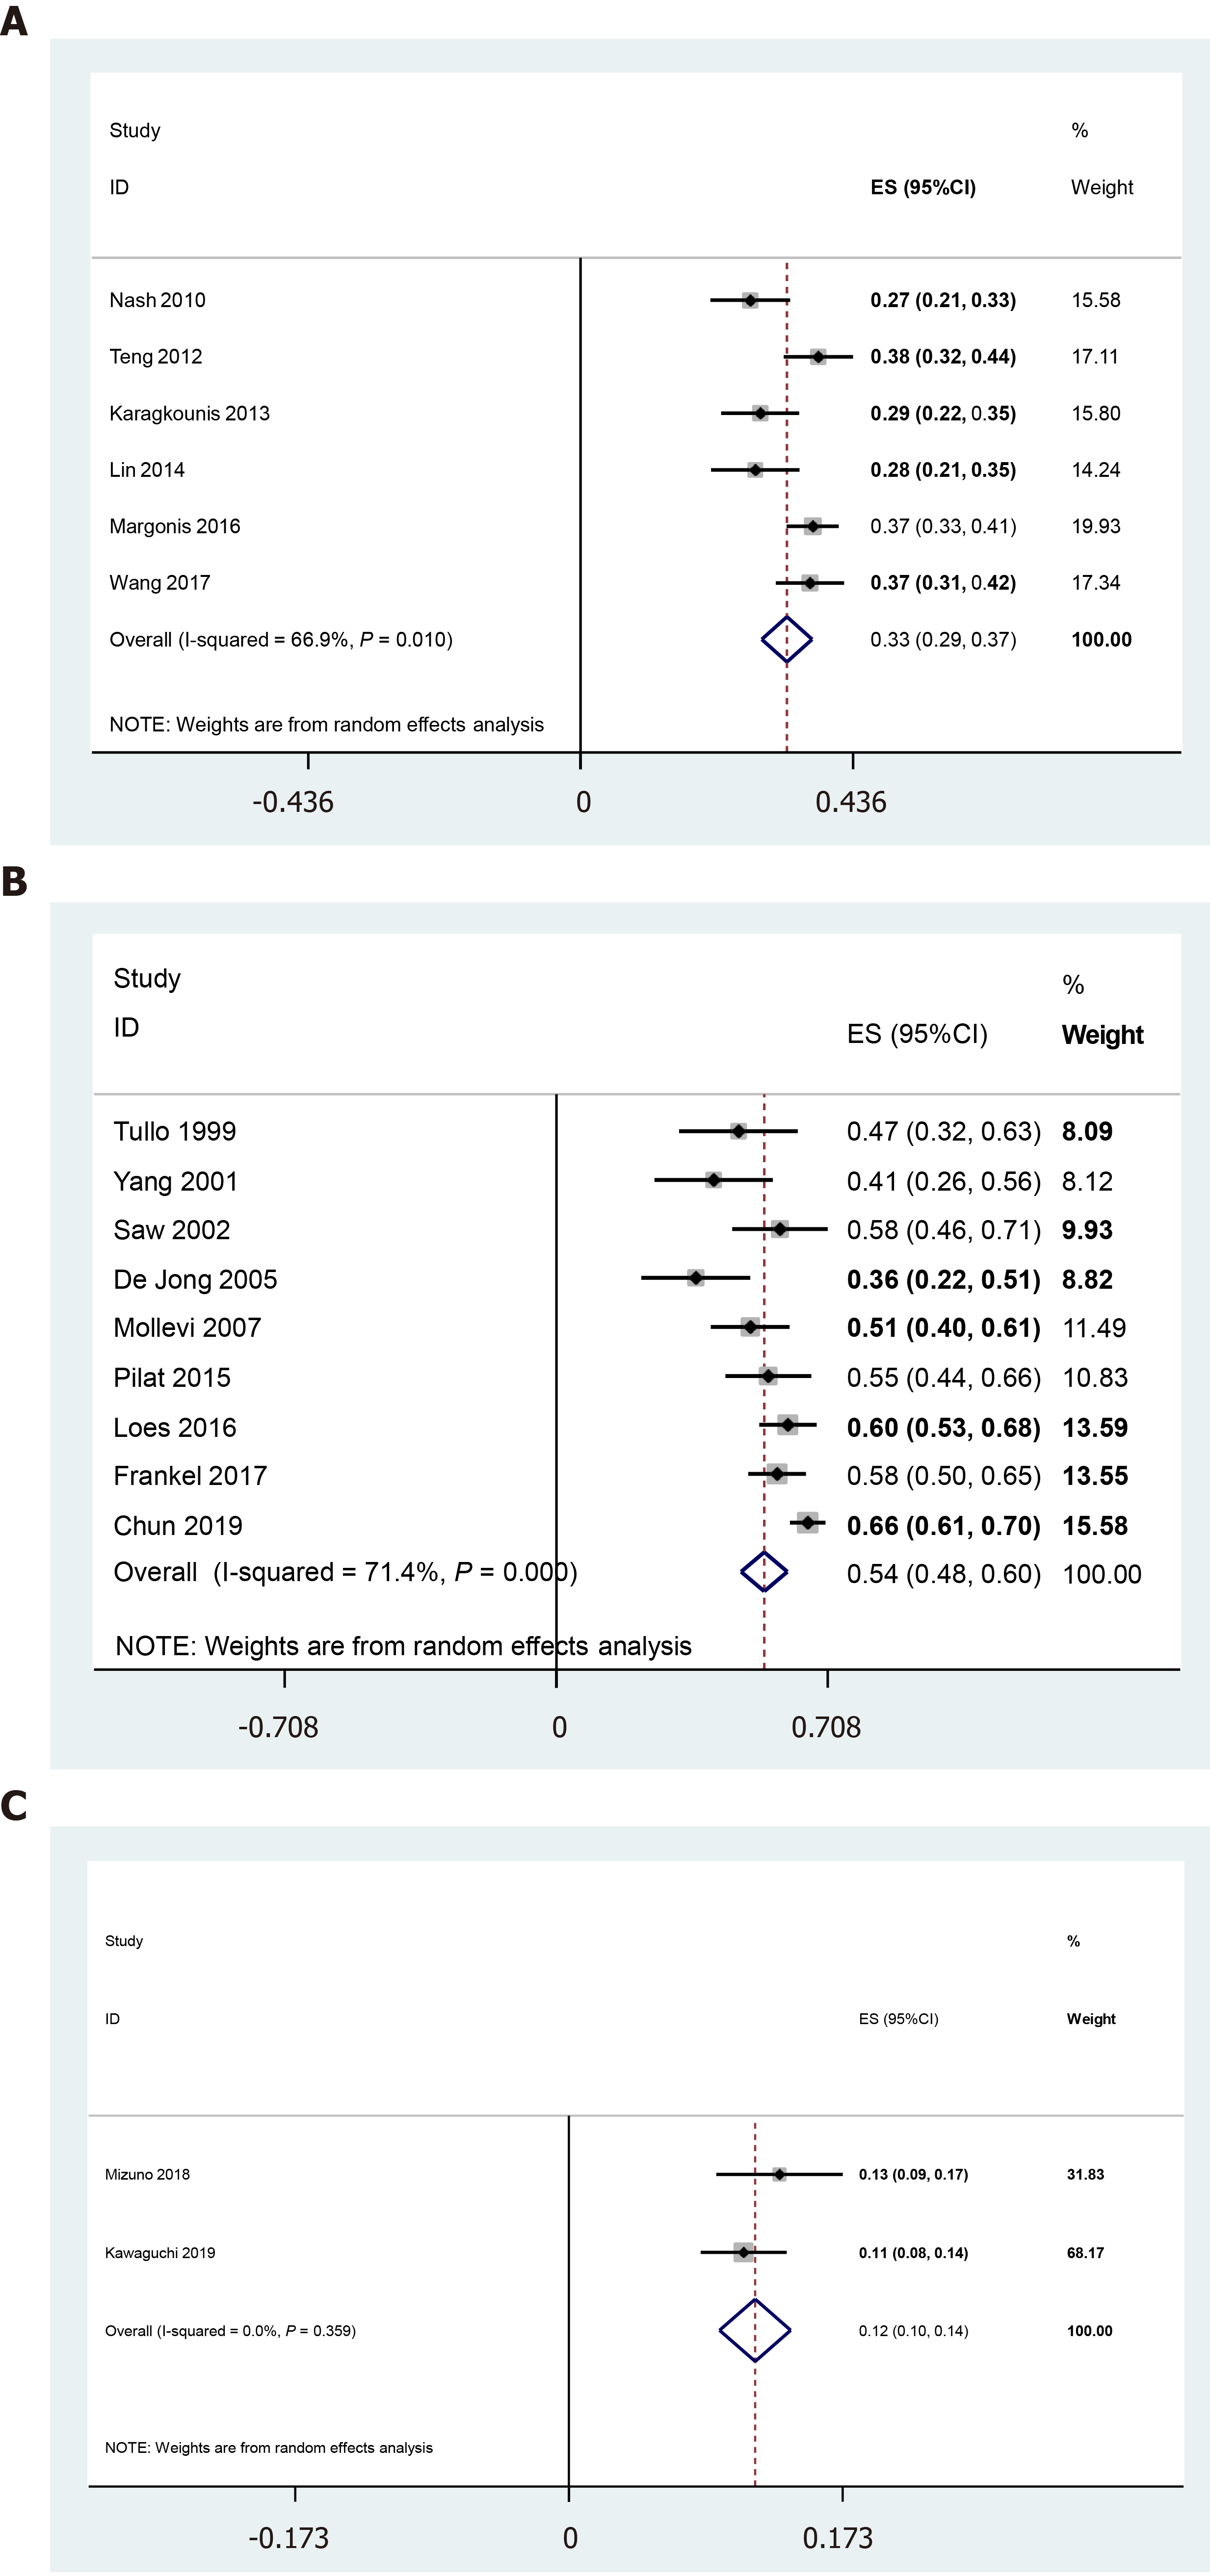
Figure 3 Meta-analysis of KRAS mutation rate.
A: KRAS; B: TP53; C: SMAD4.
- Citation: Zhao L, Wang Q, Zhao SD, Zhou J, Jiang KW, Ye YJ, Wang S, Shen ZL. Genetic mutations associated with sensitivity to neoadjuvant chemotherapy in metastatic colon cancer: A case report and review of literature. World J Clin Cases 2021; 9(24): 7099-7109
- URL: https://www.wjgnet.com/2307-8960/full/v9/i24/7099.htm
- DOI: https://dx.doi.org/10.12998/wjcc.v9.i24.7099


