Copyright
©The Author(s) 2021.
World J Clin Cases. Jan 16, 2021; 9(2): 357-371
Published online Jan 16, 2021. doi: 10.12998/wjcc.v9.i2.357
Published online Jan 16, 2021. doi: 10.12998/wjcc.v9.i2.357
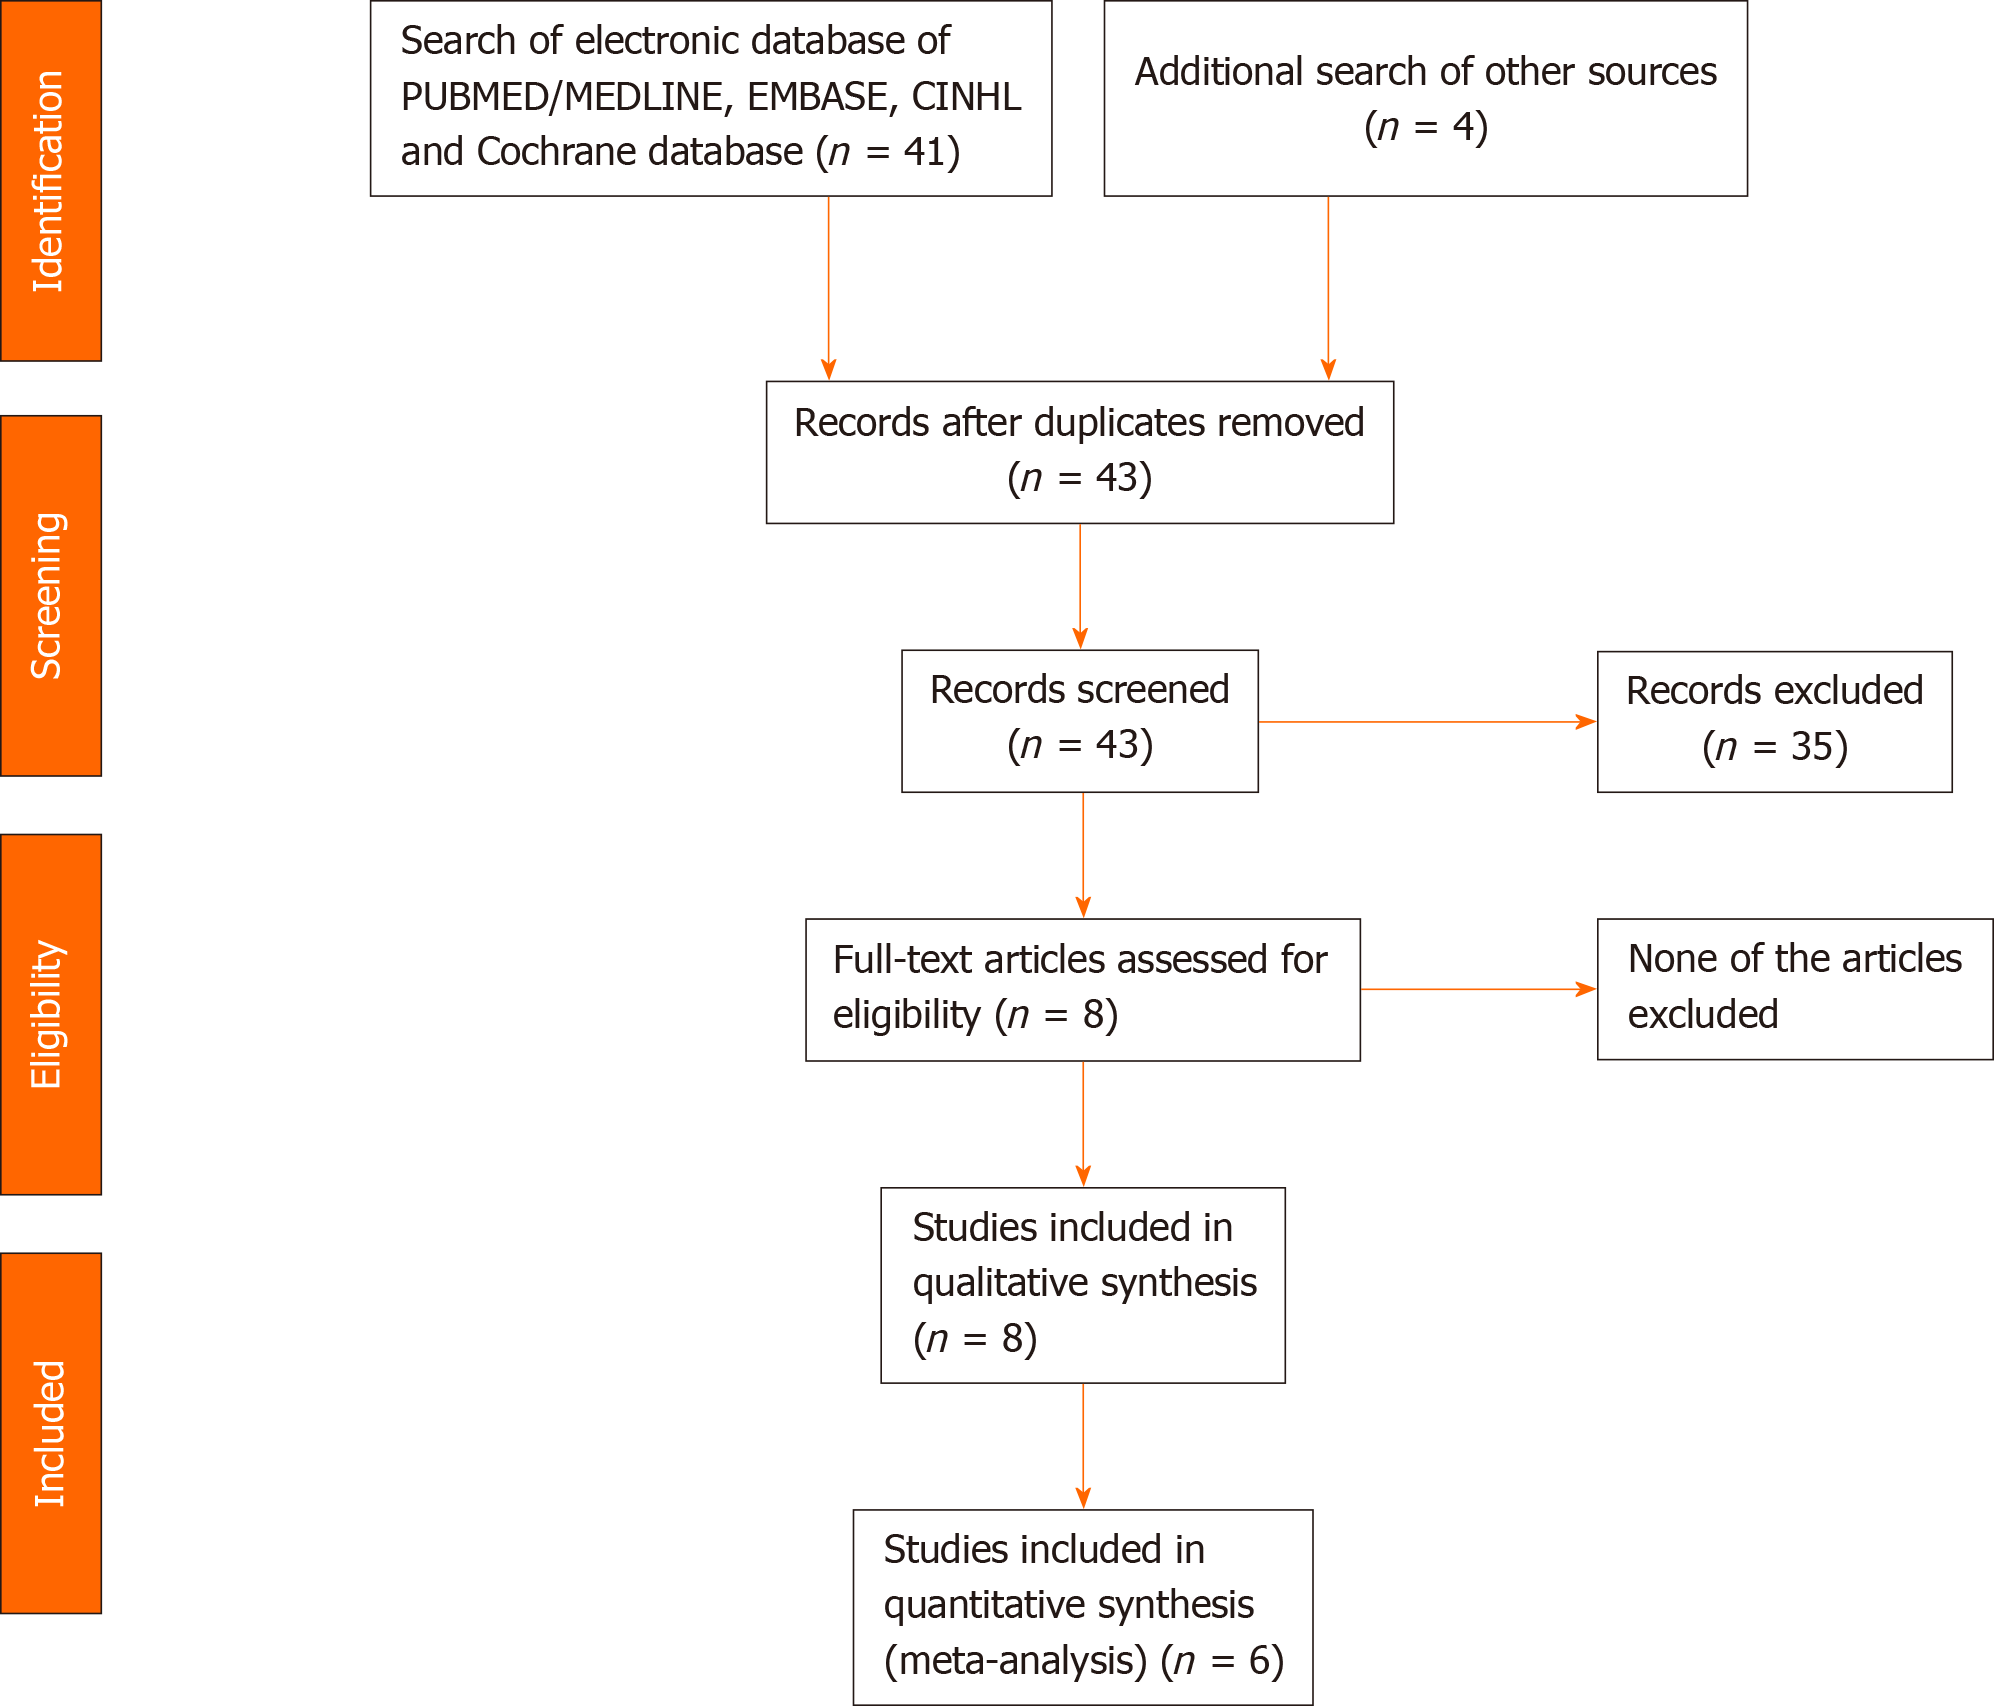
Figure 1 PRISMA Flow Diagram showing methods of study recruitment.
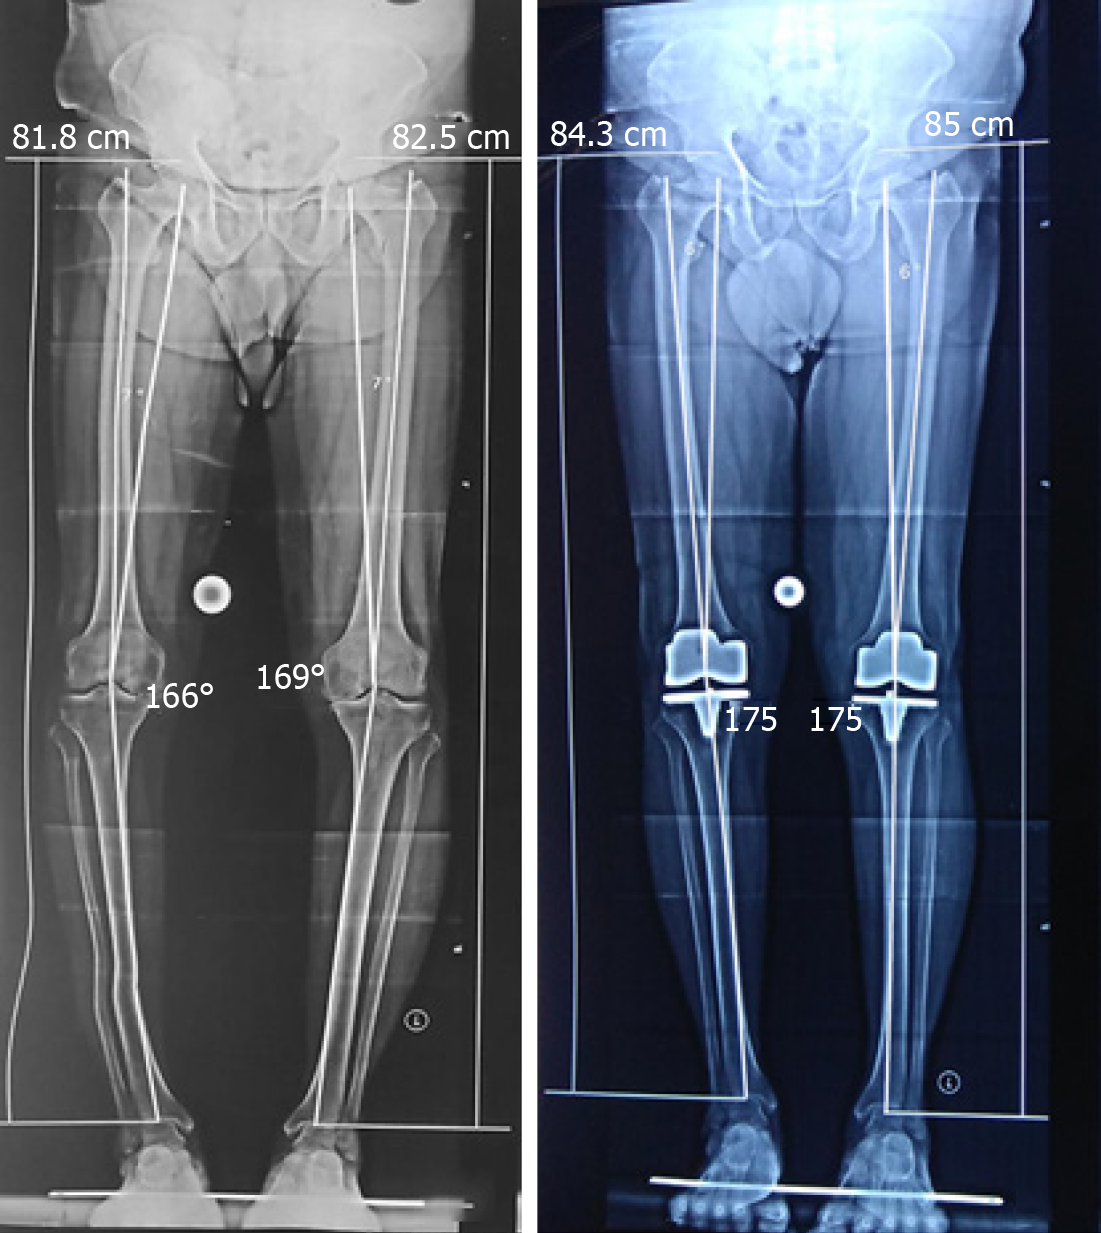
Figure 2 Preoperative and postoperative scanogram showing limb length variations in a 63-year-old male patient.
Preoperative hip—knee—ankle angle (HKA) angle Rt, Lt: 166o, 169o, limb length Rt, Lt: 81.8 cms, 82.5 cms; postoperative HKA angle Rt, Lt: 175o, 178o, limb length Rt, Lt: 84.3 cms, 85 cms.
Figure 3 Forest plot showing limb length discrepancy in the preoperative period and postoperative period.
LLD: Limb length discrepancy.
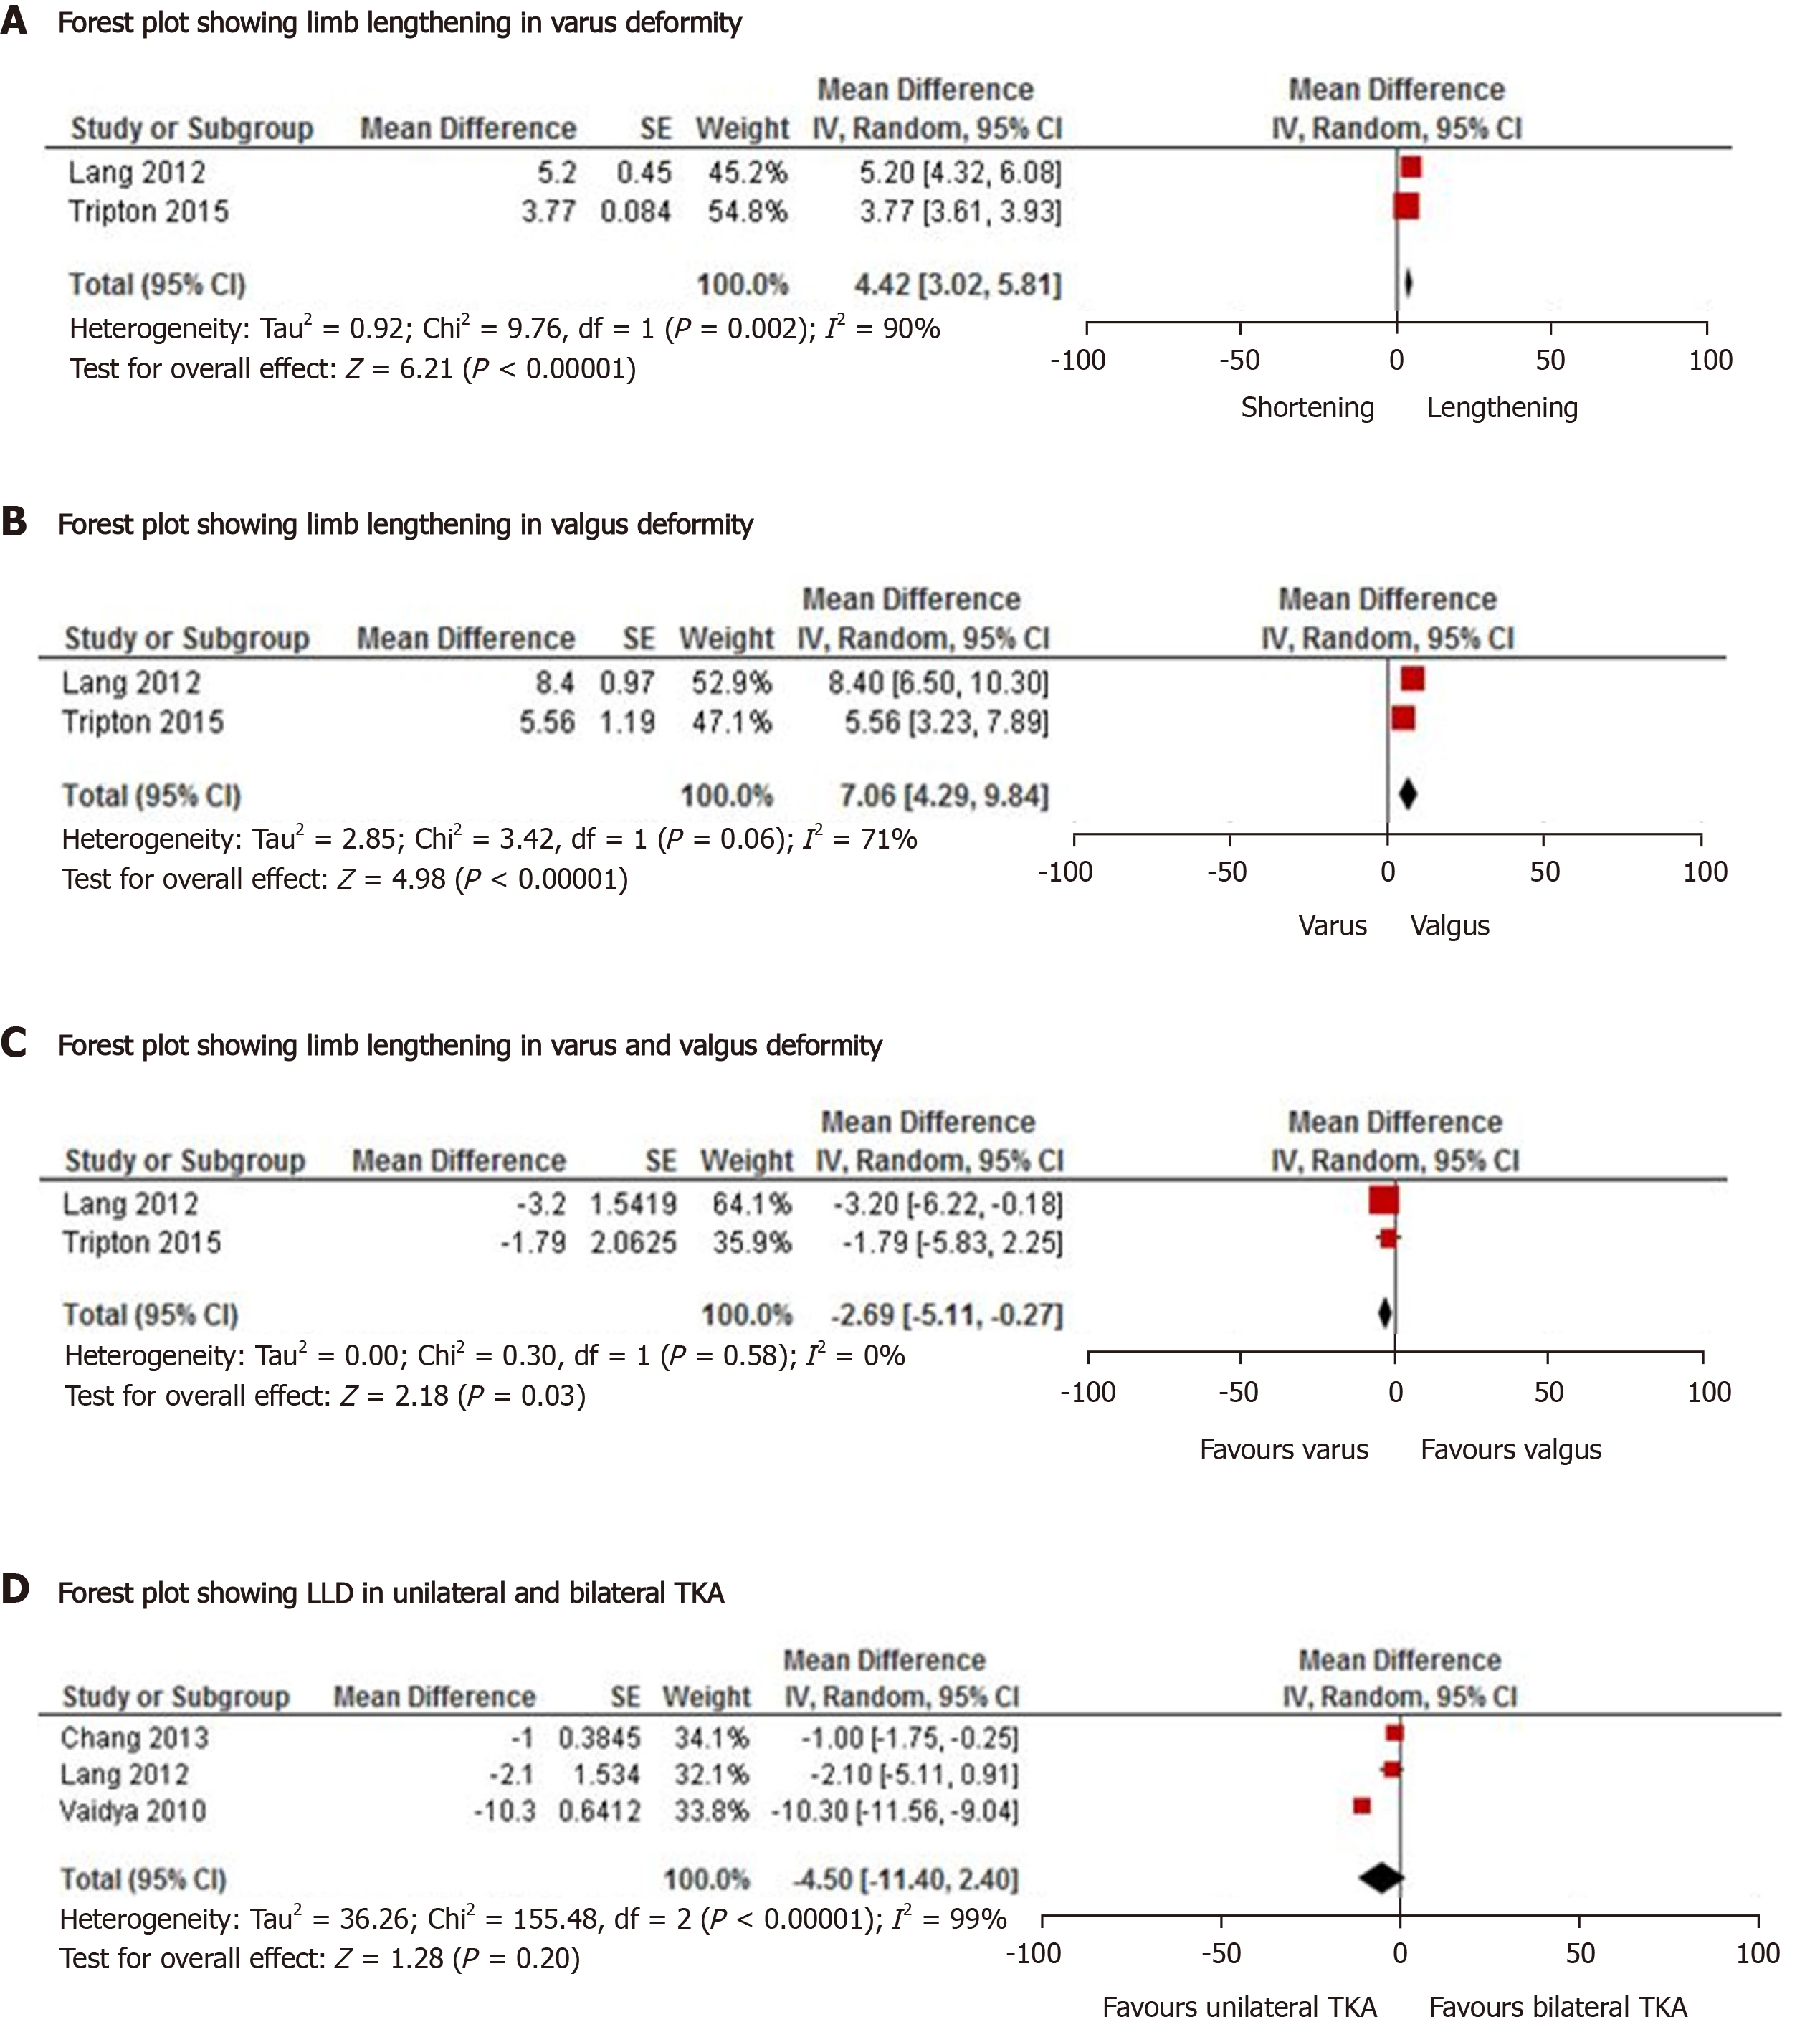
Figure 4 Forest plot showing limb lengthening/limb length discrepancy in varus deformity, valgus deformity and unilateral/ bilateral total knee arthroplasty.
TKA: Total knee arthroplasty; LLD: Limb length discrepancy.
Figure 5 Forest plot showing functional outcome in patients with limb length discrepancy < 10 mm vs ≥ 10 mm.
- Citation: Tripathy SK, Pradhan SS, Varghese P, Purudappa PP, Velagada S, Goyal T, Panda BB, Vanyambadi J. Limb length discrepancy after total knee arthroplasty: A systematic review and meta-analysis. World J Clin Cases 2021; 9(2): 357-371
- URL: https://www.wjgnet.com/2307-8960/full/v9/i2/357.htm
- DOI: https://dx.doi.org/10.12998/wjcc.v9.i2.357


