Copyright
©The Author(s) 2021.
World J Clin Cases. Jun 16, 2021; 9(17): 4453-4459
Published online Jun 16, 2021. doi: 10.12998/wjcc.v9.i17.4453
Published online Jun 16, 2021. doi: 10.12998/wjcc.v9.i17.4453
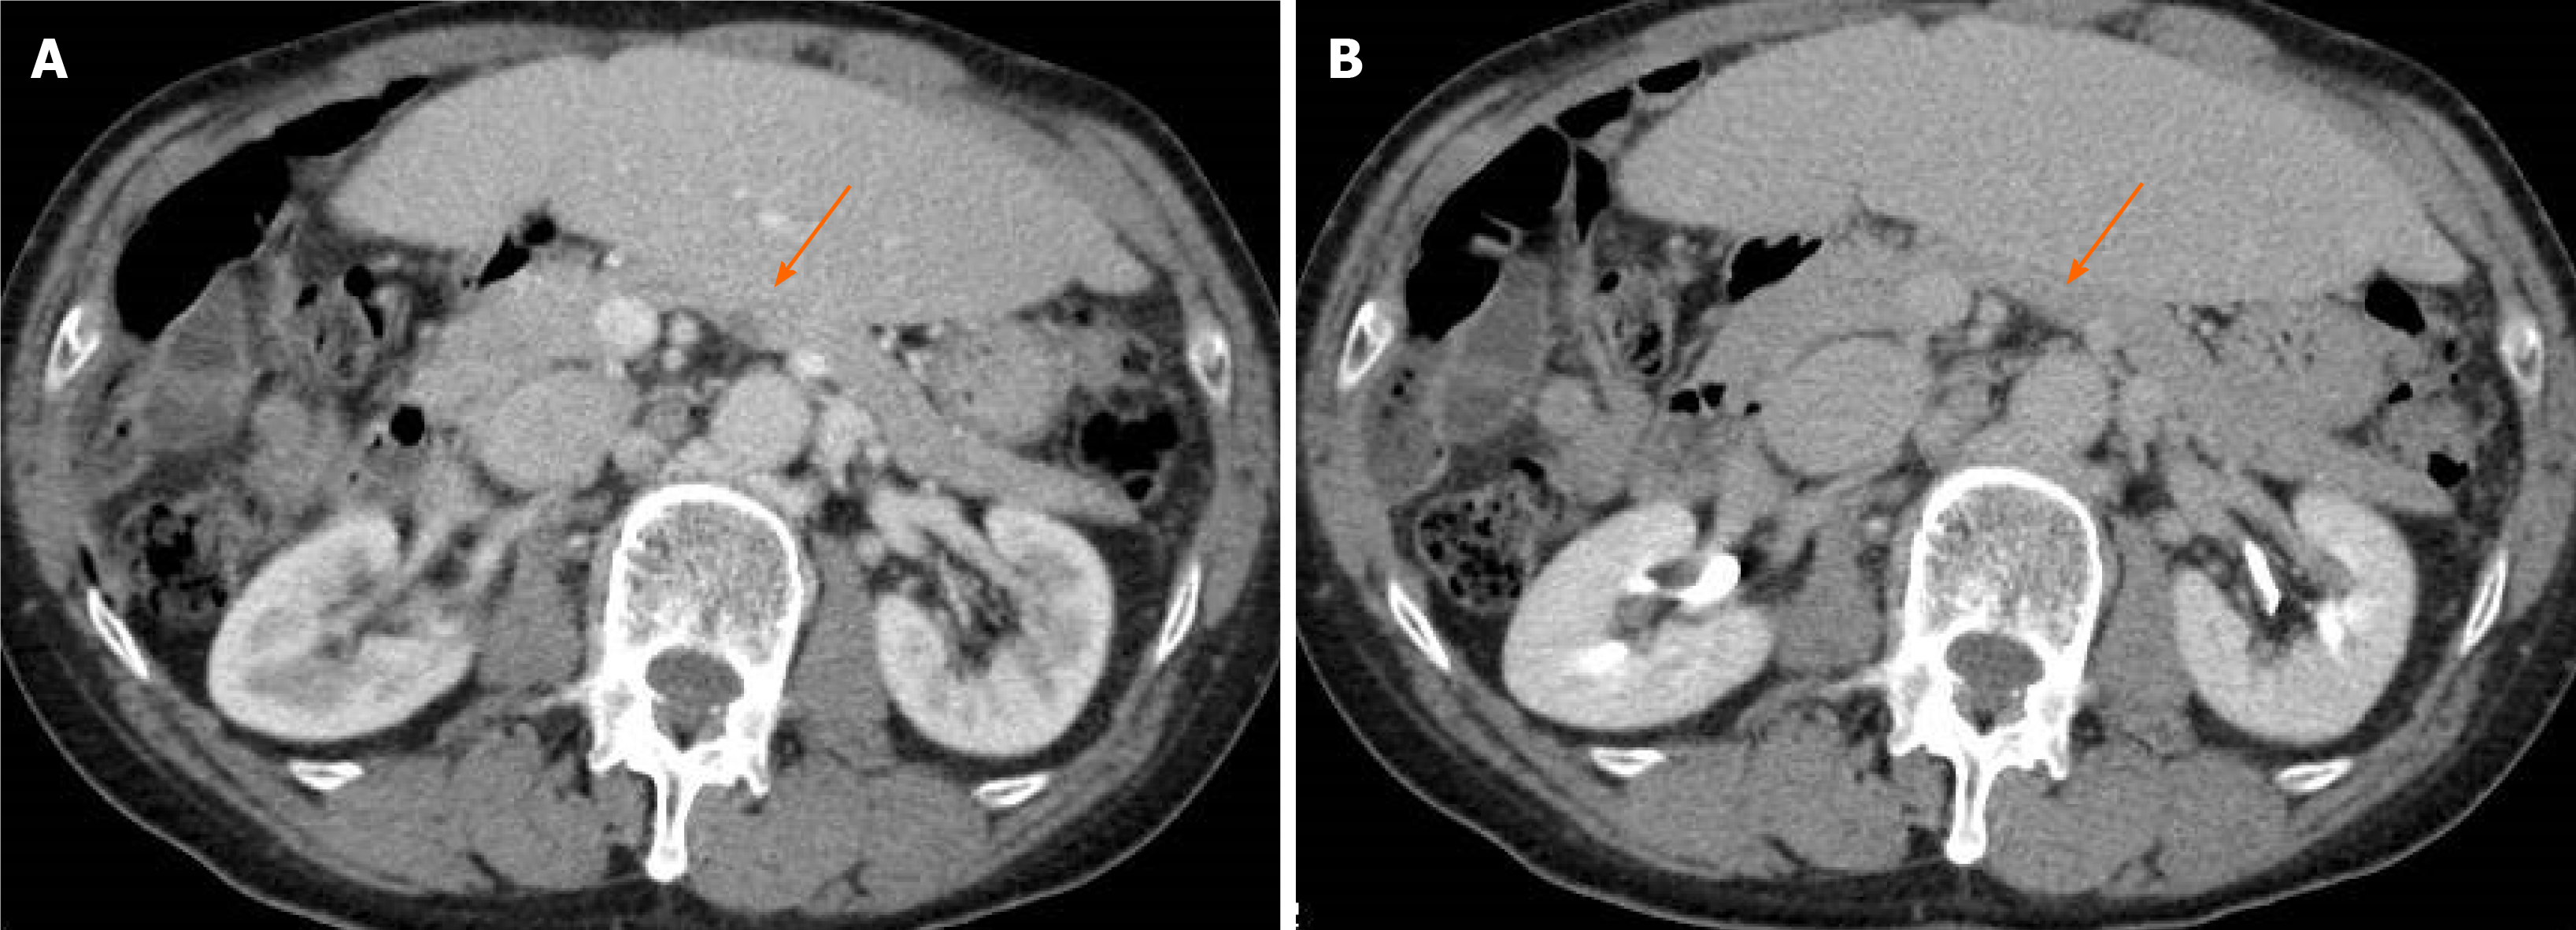
Figure 1 Computed tomography images.
A: A 10 mm tumor that was hyperintense with ischemia in the early phase (orange arrowhead); B: A 10 mm tumor that was isodense with pancreatic parenchyma in late phase (orange arrowhead).
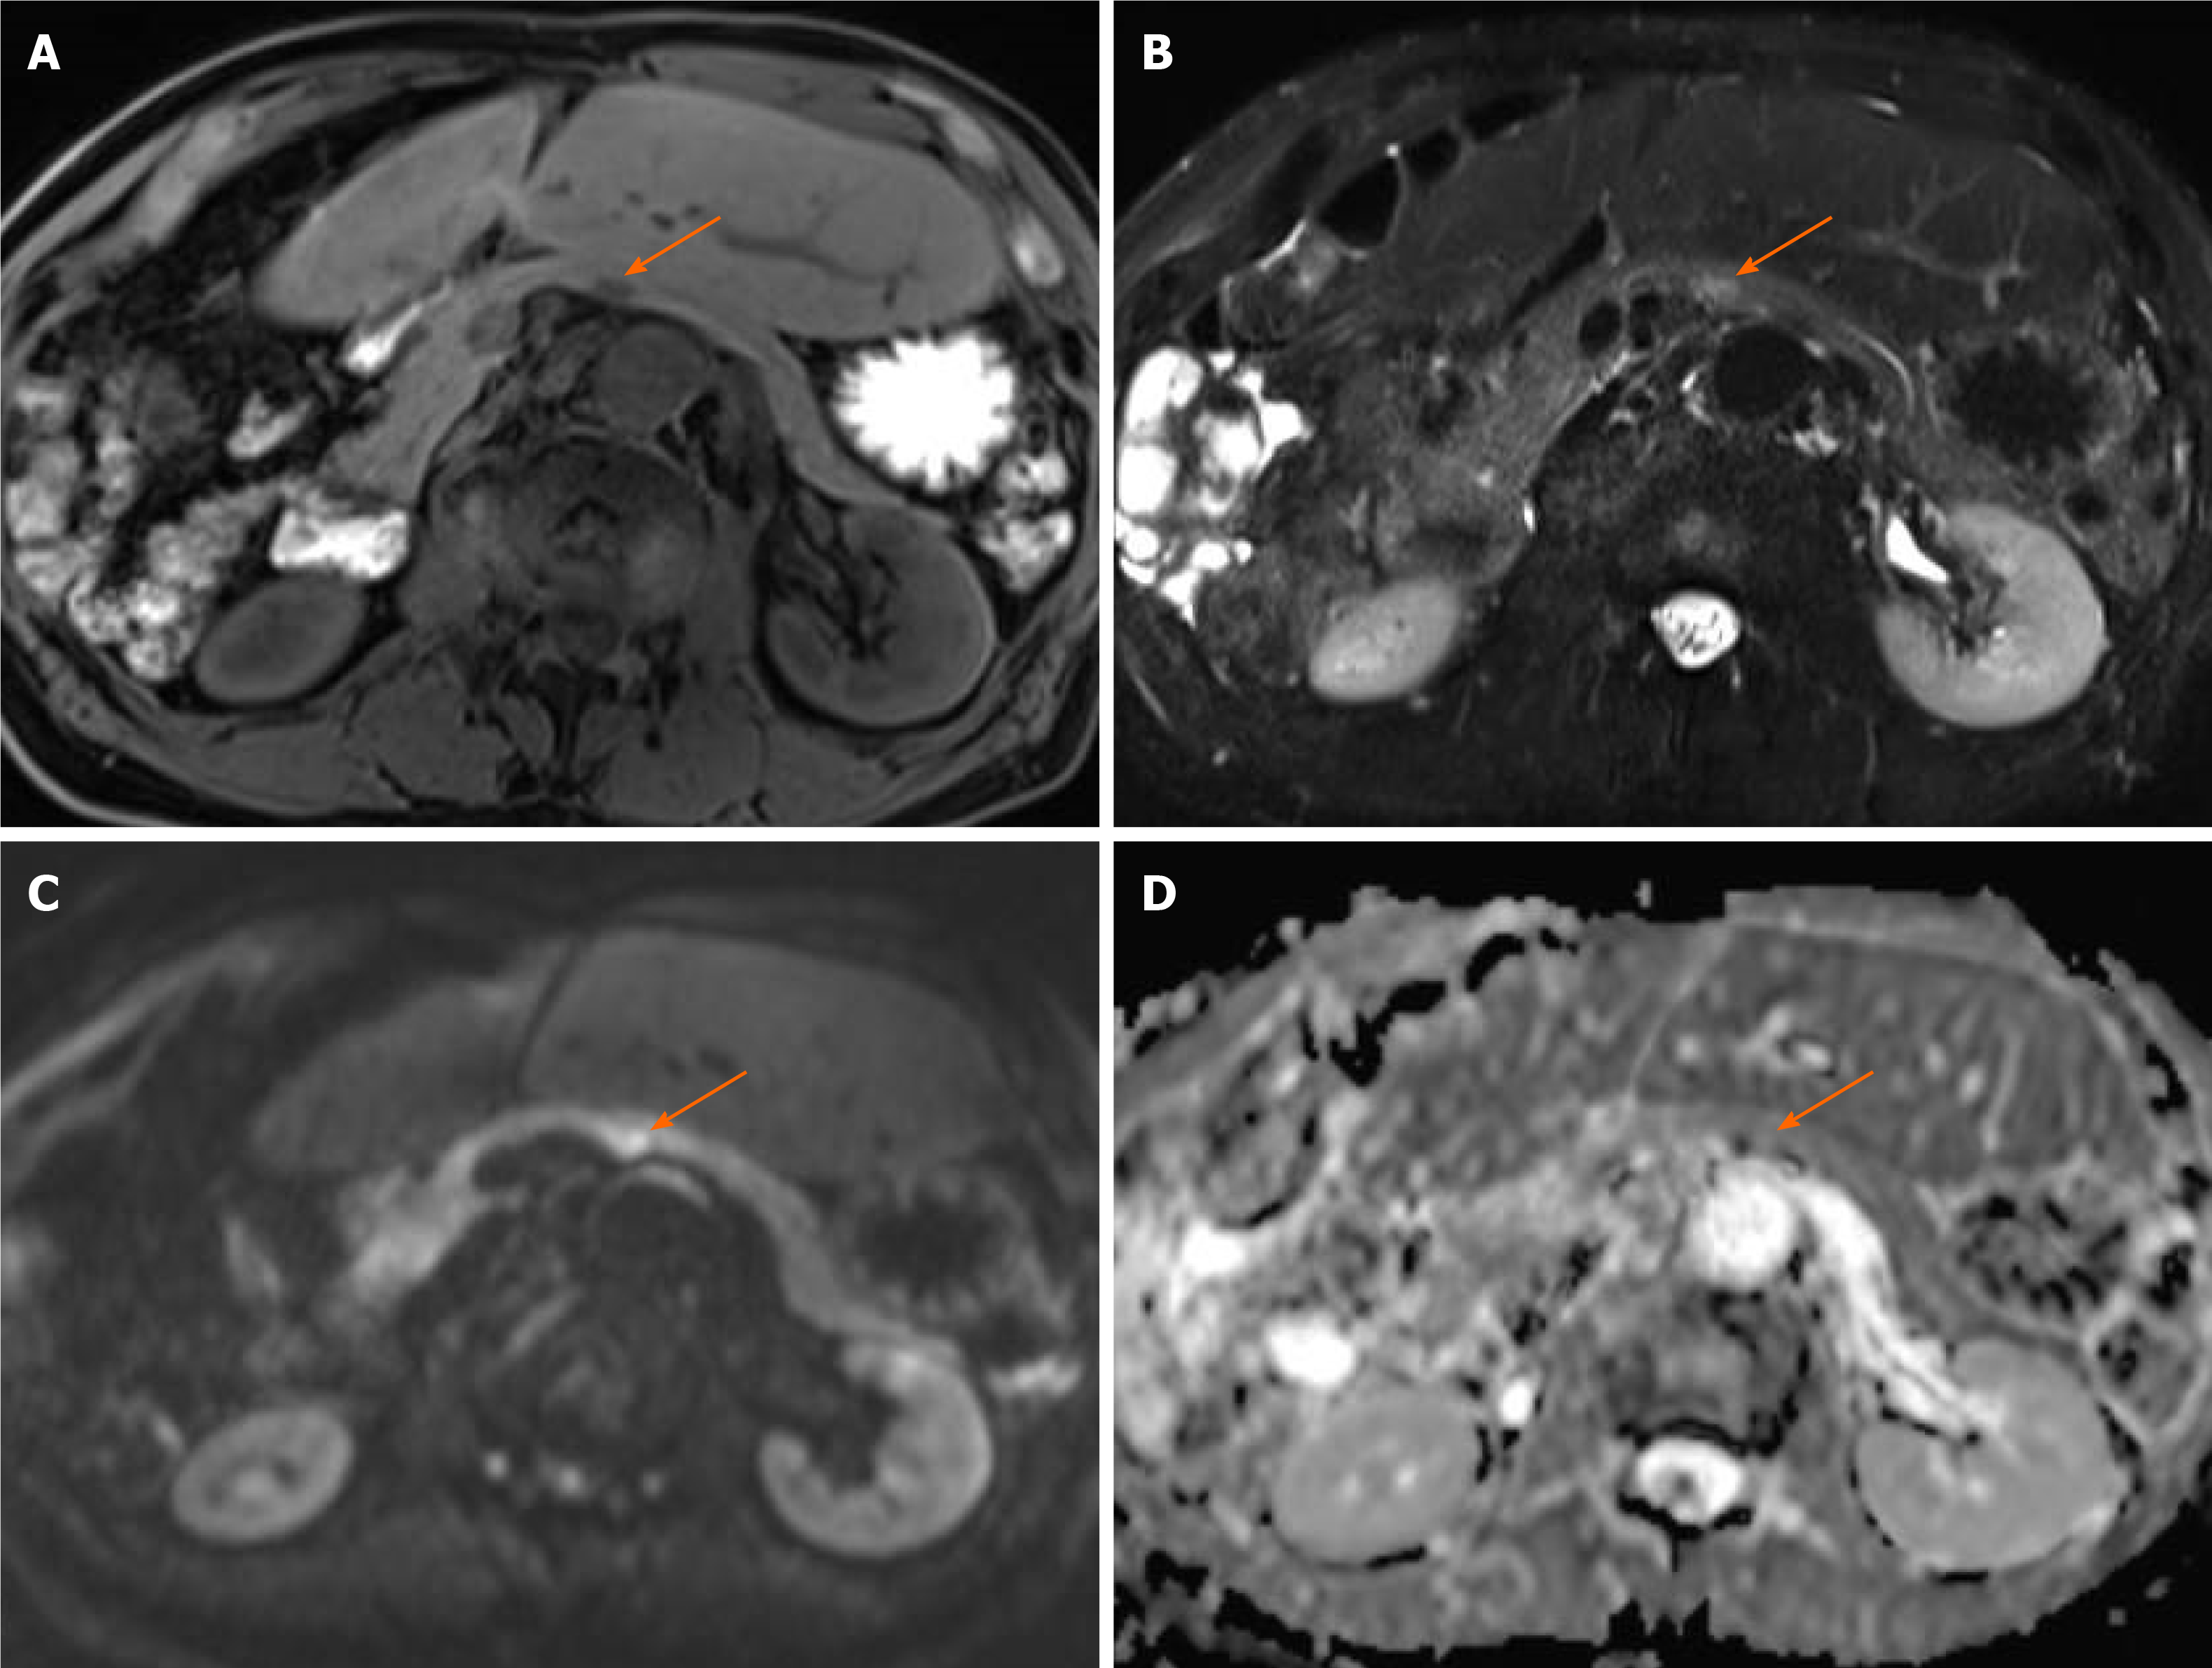
Figure 2 Magnetic resonance cholangiopancreatography images.
A: The tumor showed low intensity in T1-weighted images (orange arrowhead); B: The tumor showed moderately high intensity in T2-weighted images (orange arrowhead); C: The tumor demonstrated high signal in diffusion weighted images (orange arrowhead); D: The tumor showed almost the same isodensity in an apparent diffusion coefficient-map phase (orange arrowhead).
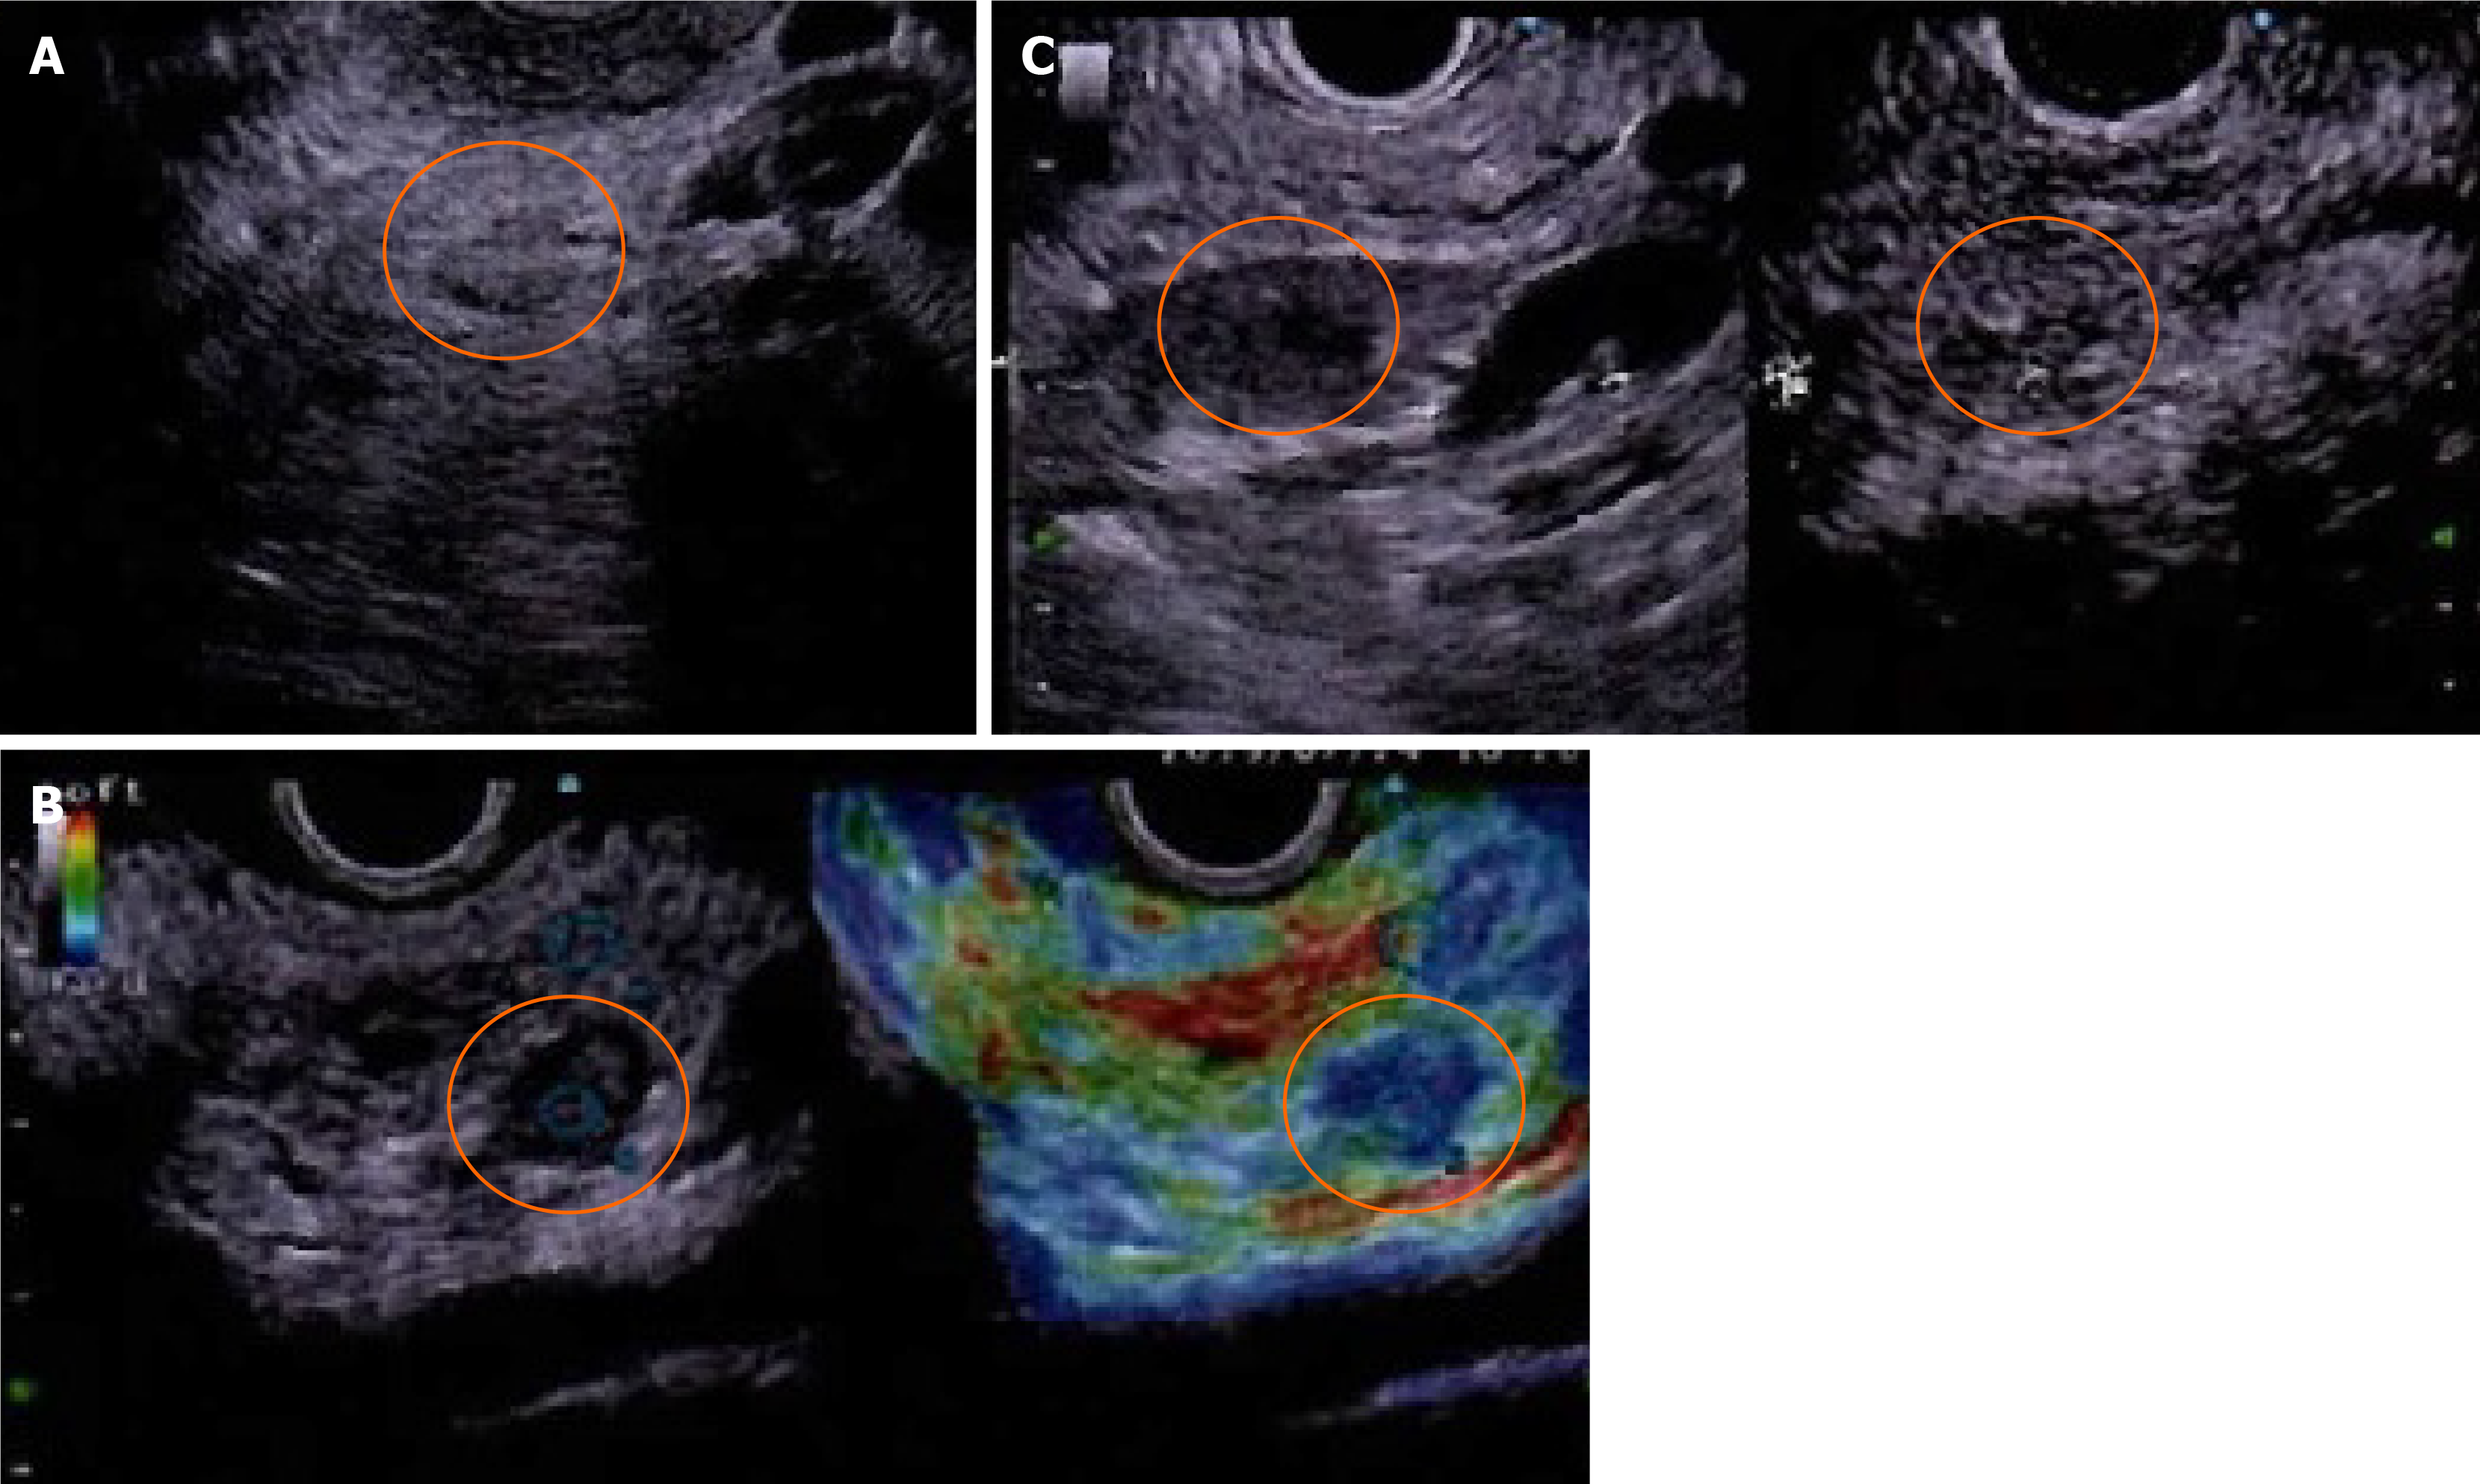
Figure 3 Endoscopic ultrasound images.
A: The tumor showed a 14 mm solid and low echoic mass in the pancreatic body (orange circle); B: Endoscopic ultrasound (EUS) elastography showed a strain ratio < 0.05 (orange circle, right image: Elastography image); C: Contrast enhanced EUS showed short term contrast effects in the early phase and washed out quickly (orange circle, right image: Sonazoid mode of delay phase).
Figure 4 Macroscopic pathological findings of specimen.
A: Specimen pathology; B: orange circle shows tumor.
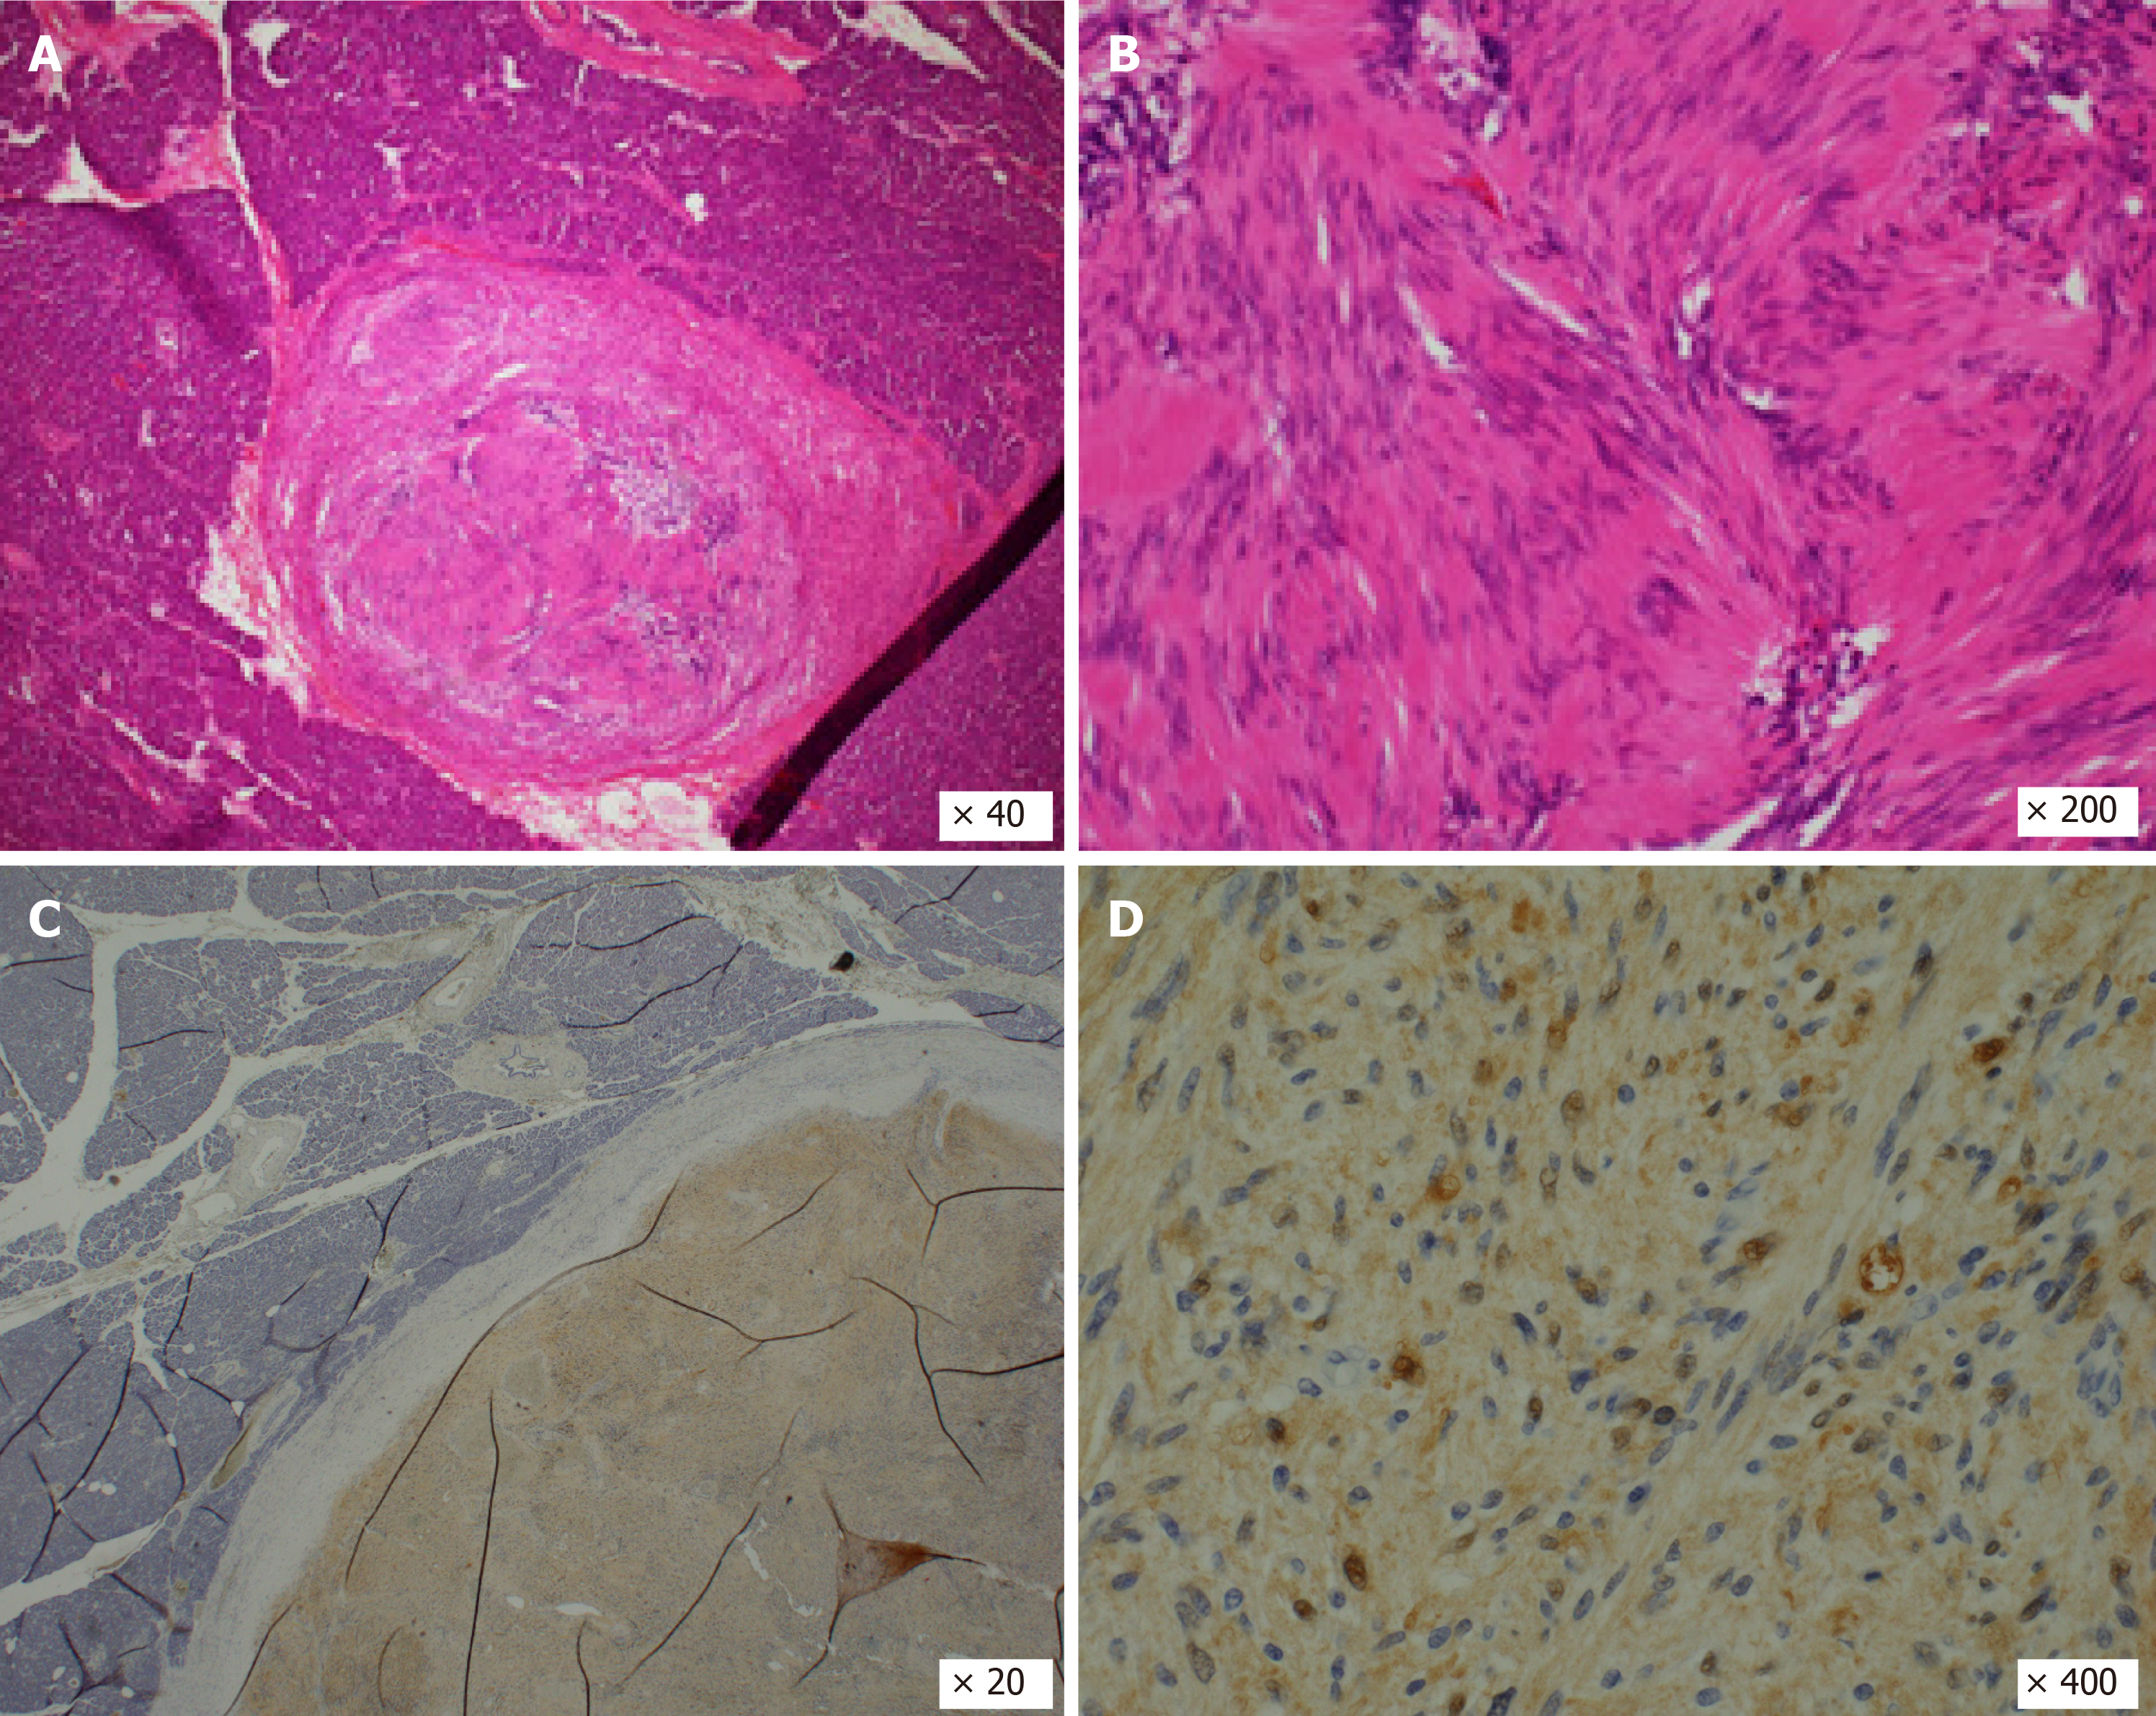
Figure 5 Microscopic histopathological findings.
A and B: Hematoxylin and eosin staining showed a proliferation of spindle-shaped cells in a vague fascicular and haphazard pattern, with palisading arrangement; C and D: Immunohistochemical staining of S100 was positive.
- Citation: Kimura K, Adachi E, Toyohara A, Omori S, Ezaki K, Ihara R, Higashi T, Ohgaki K, Ito S, Maehara SI, Nakamura T, Fushimi F, Maehara Y. Schwannoma mimicking pancreatic carcinoma: A case report. World J Clin Cases 2021; 9(17): 4453-4459
- URL: https://www.wjgnet.com/2307-8960/full/v9/i17/4453.htm
- DOI: https://dx.doi.org/10.12998/wjcc.v9.i17.4453


