Copyright
©The Author(s) 2021.
World J Clin Cases. Jun 16, 2021; 9(17): 4441-4452
Published online Jun 16, 2021. doi: 10.12998/wjcc.v9.i17.4441
Published online Jun 16, 2021. doi: 10.12998/wjcc.v9.i17.4441
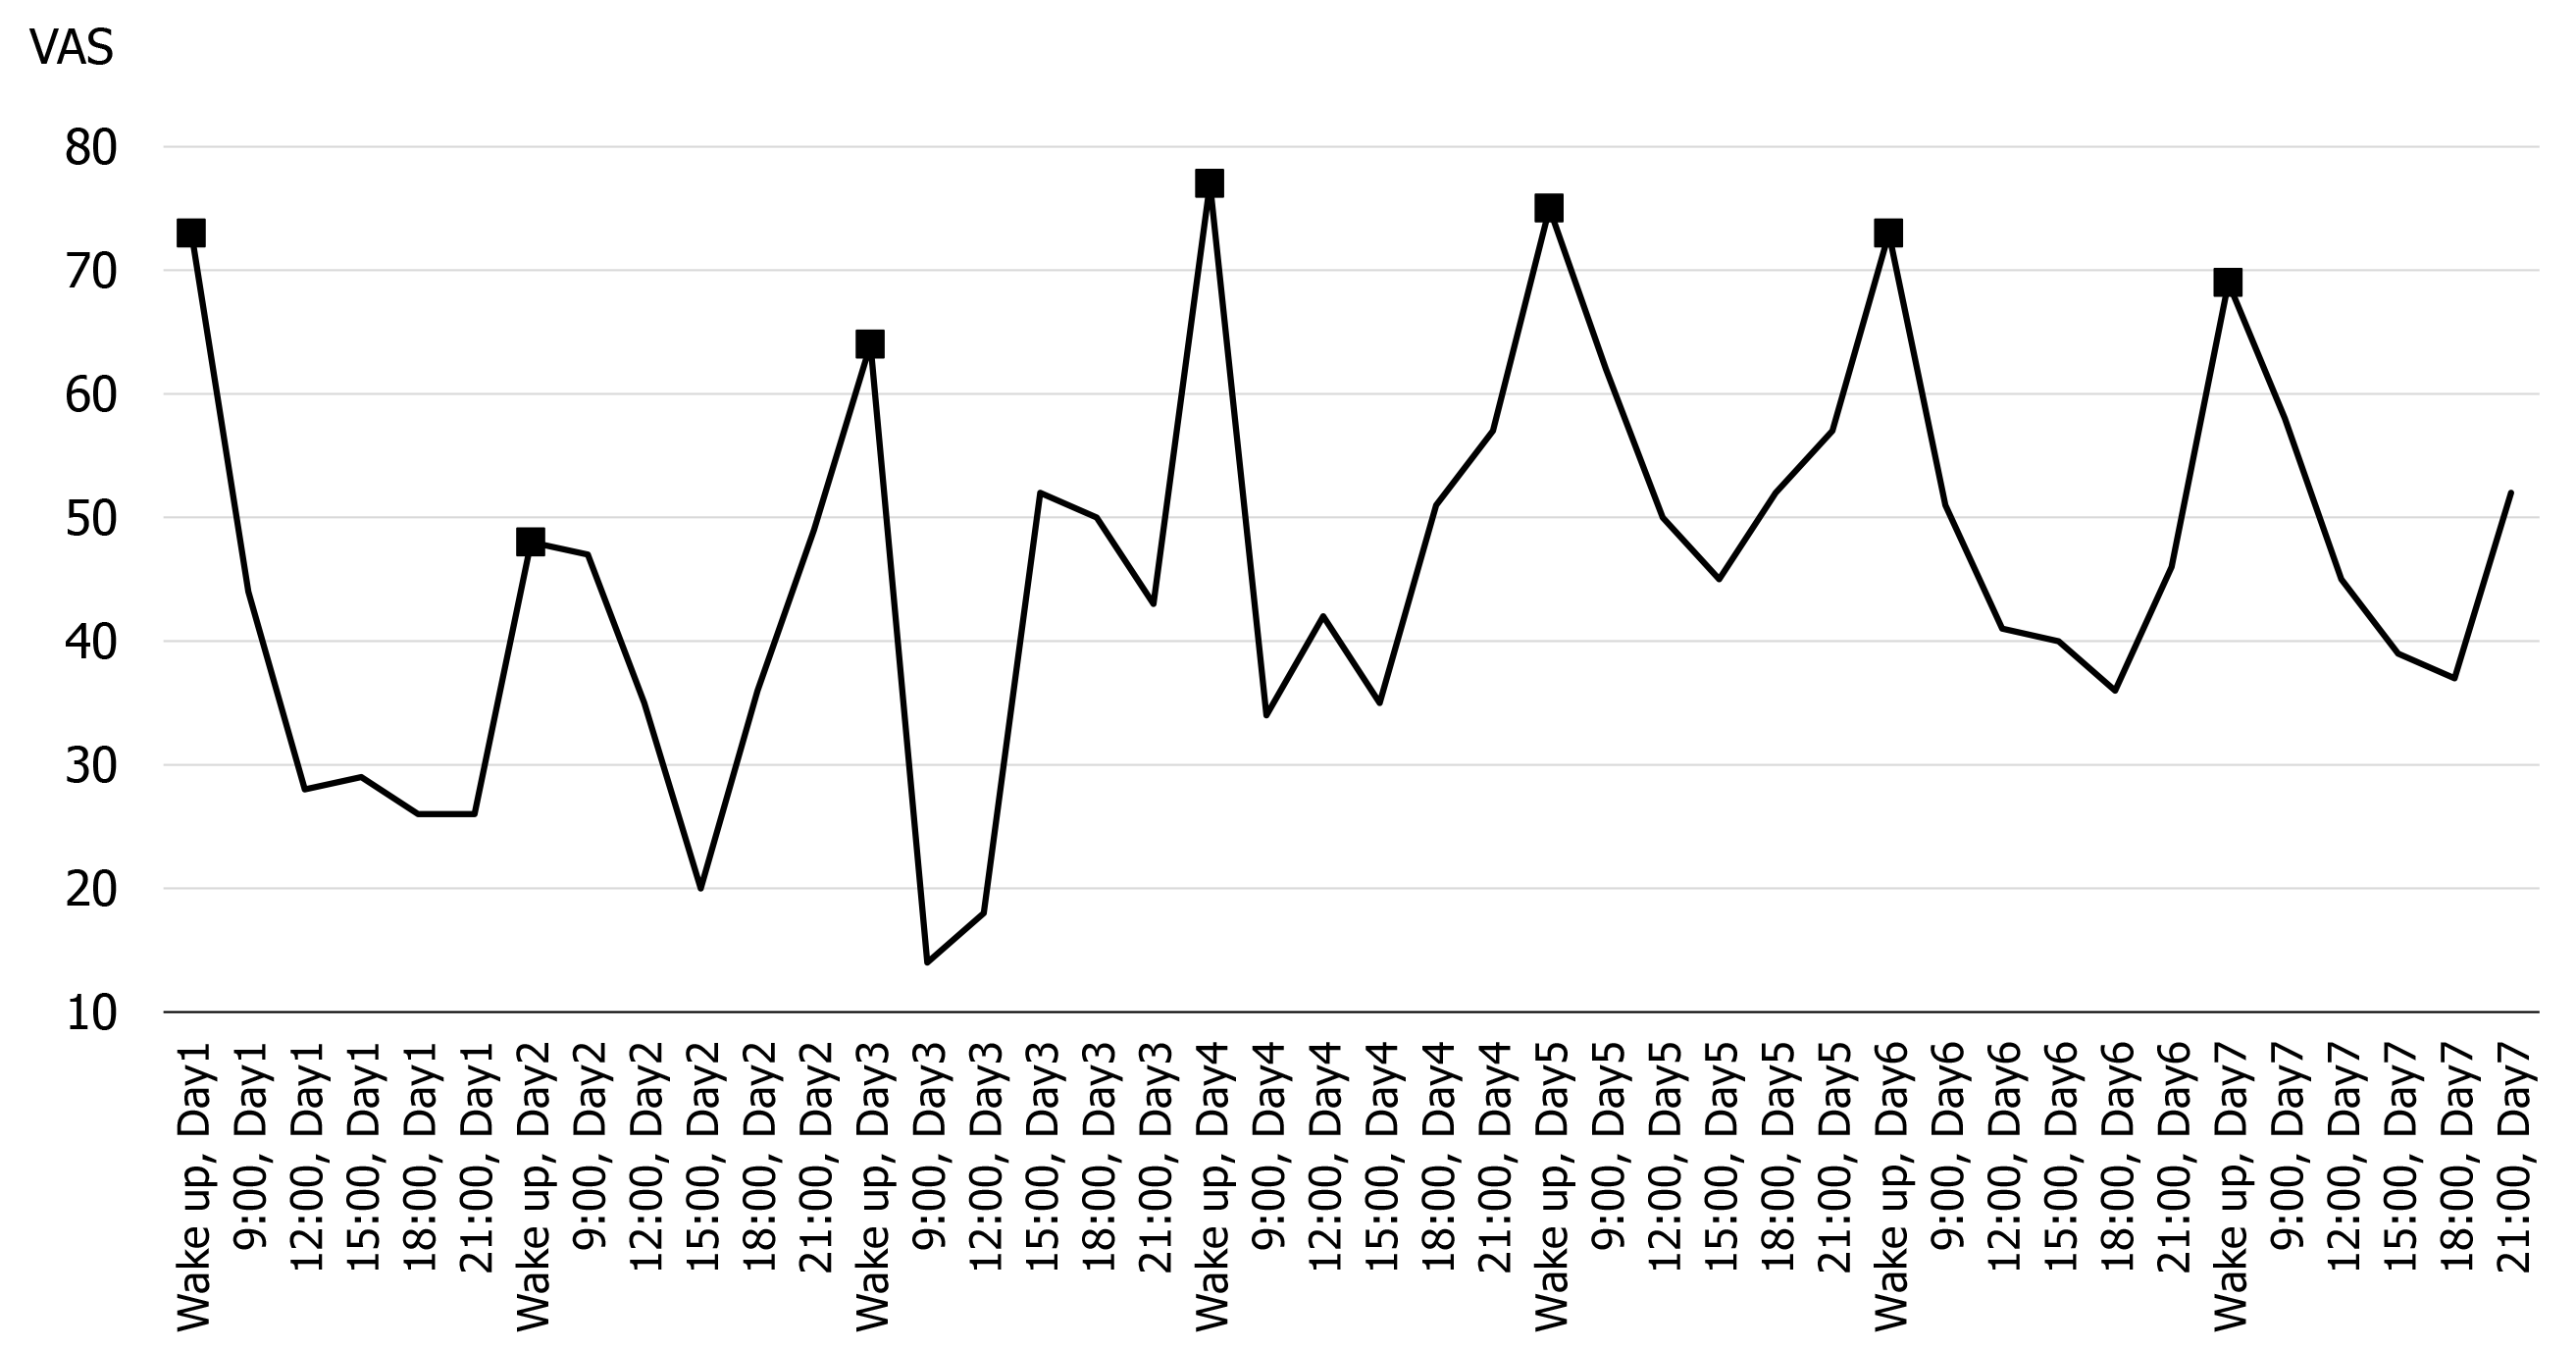
Figure 1 Early assessment of the pain circadian rhythm (all observation points).
The black square indicates the values when the patient woke up in the morning. VAS: Visual analogue scale.
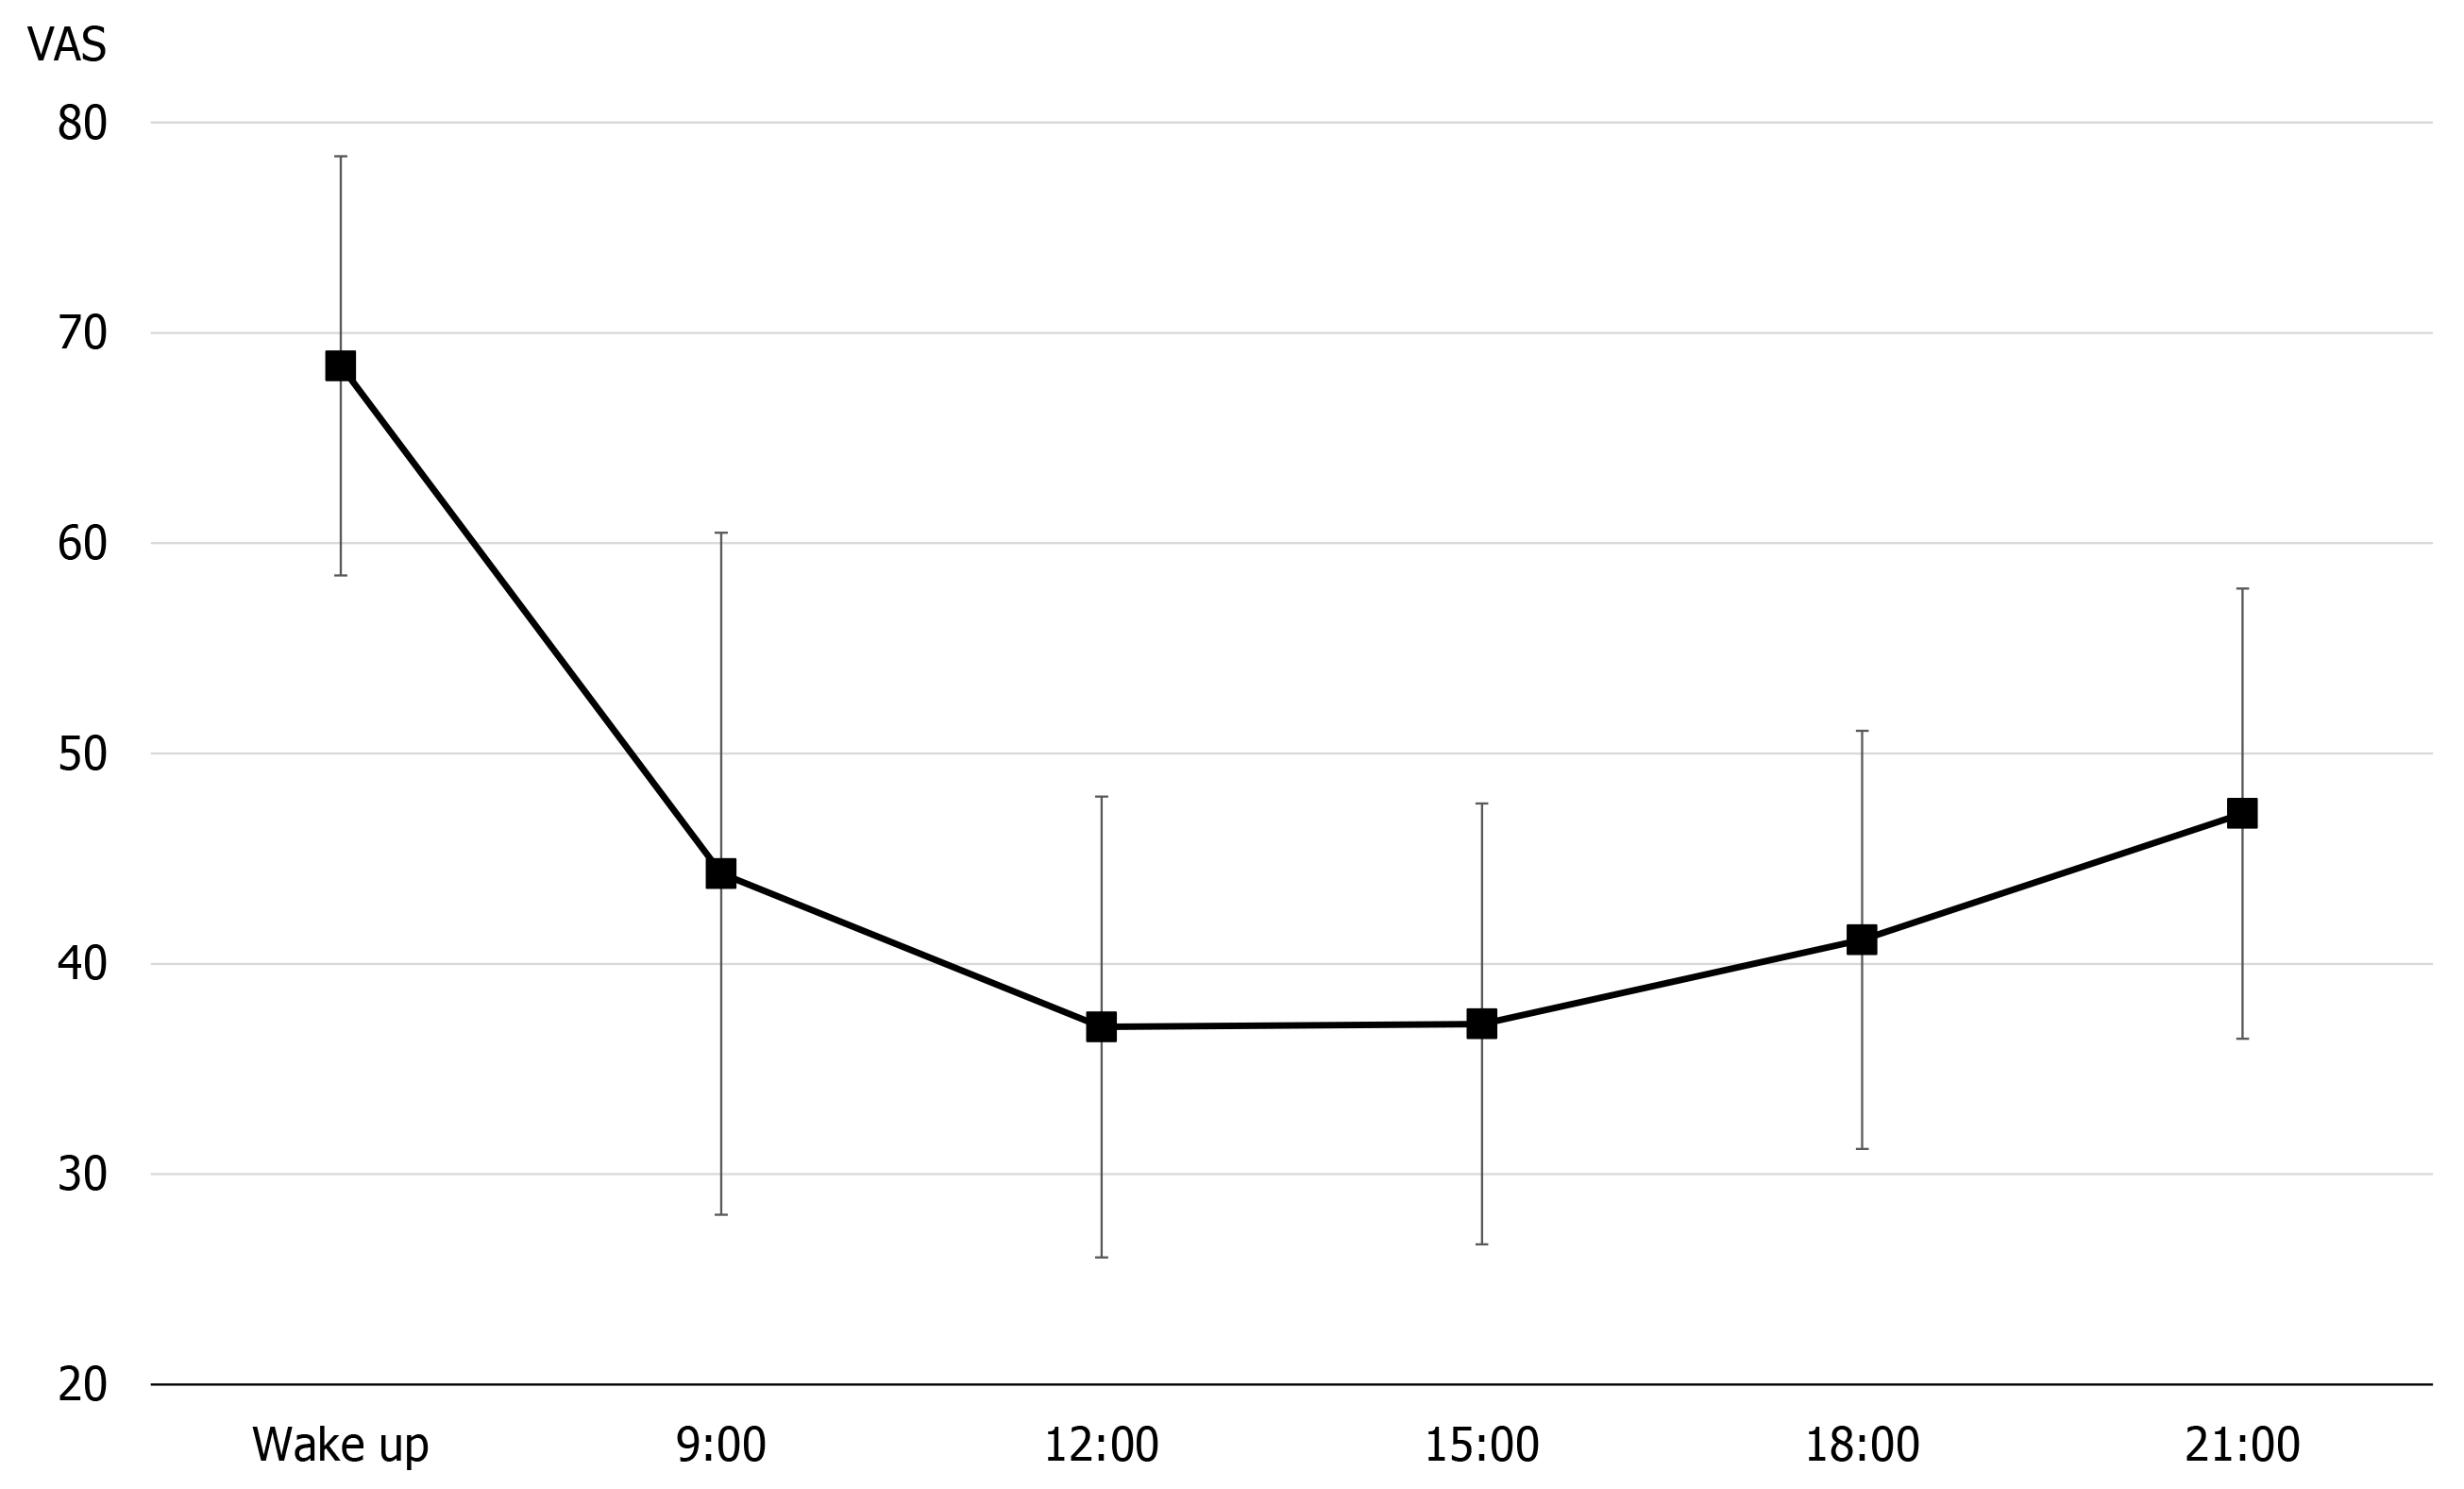
Figure 2 Early assessment of the pain circadian rhythm (7-d average of each observation point).
VAS: Visual analogue scale.
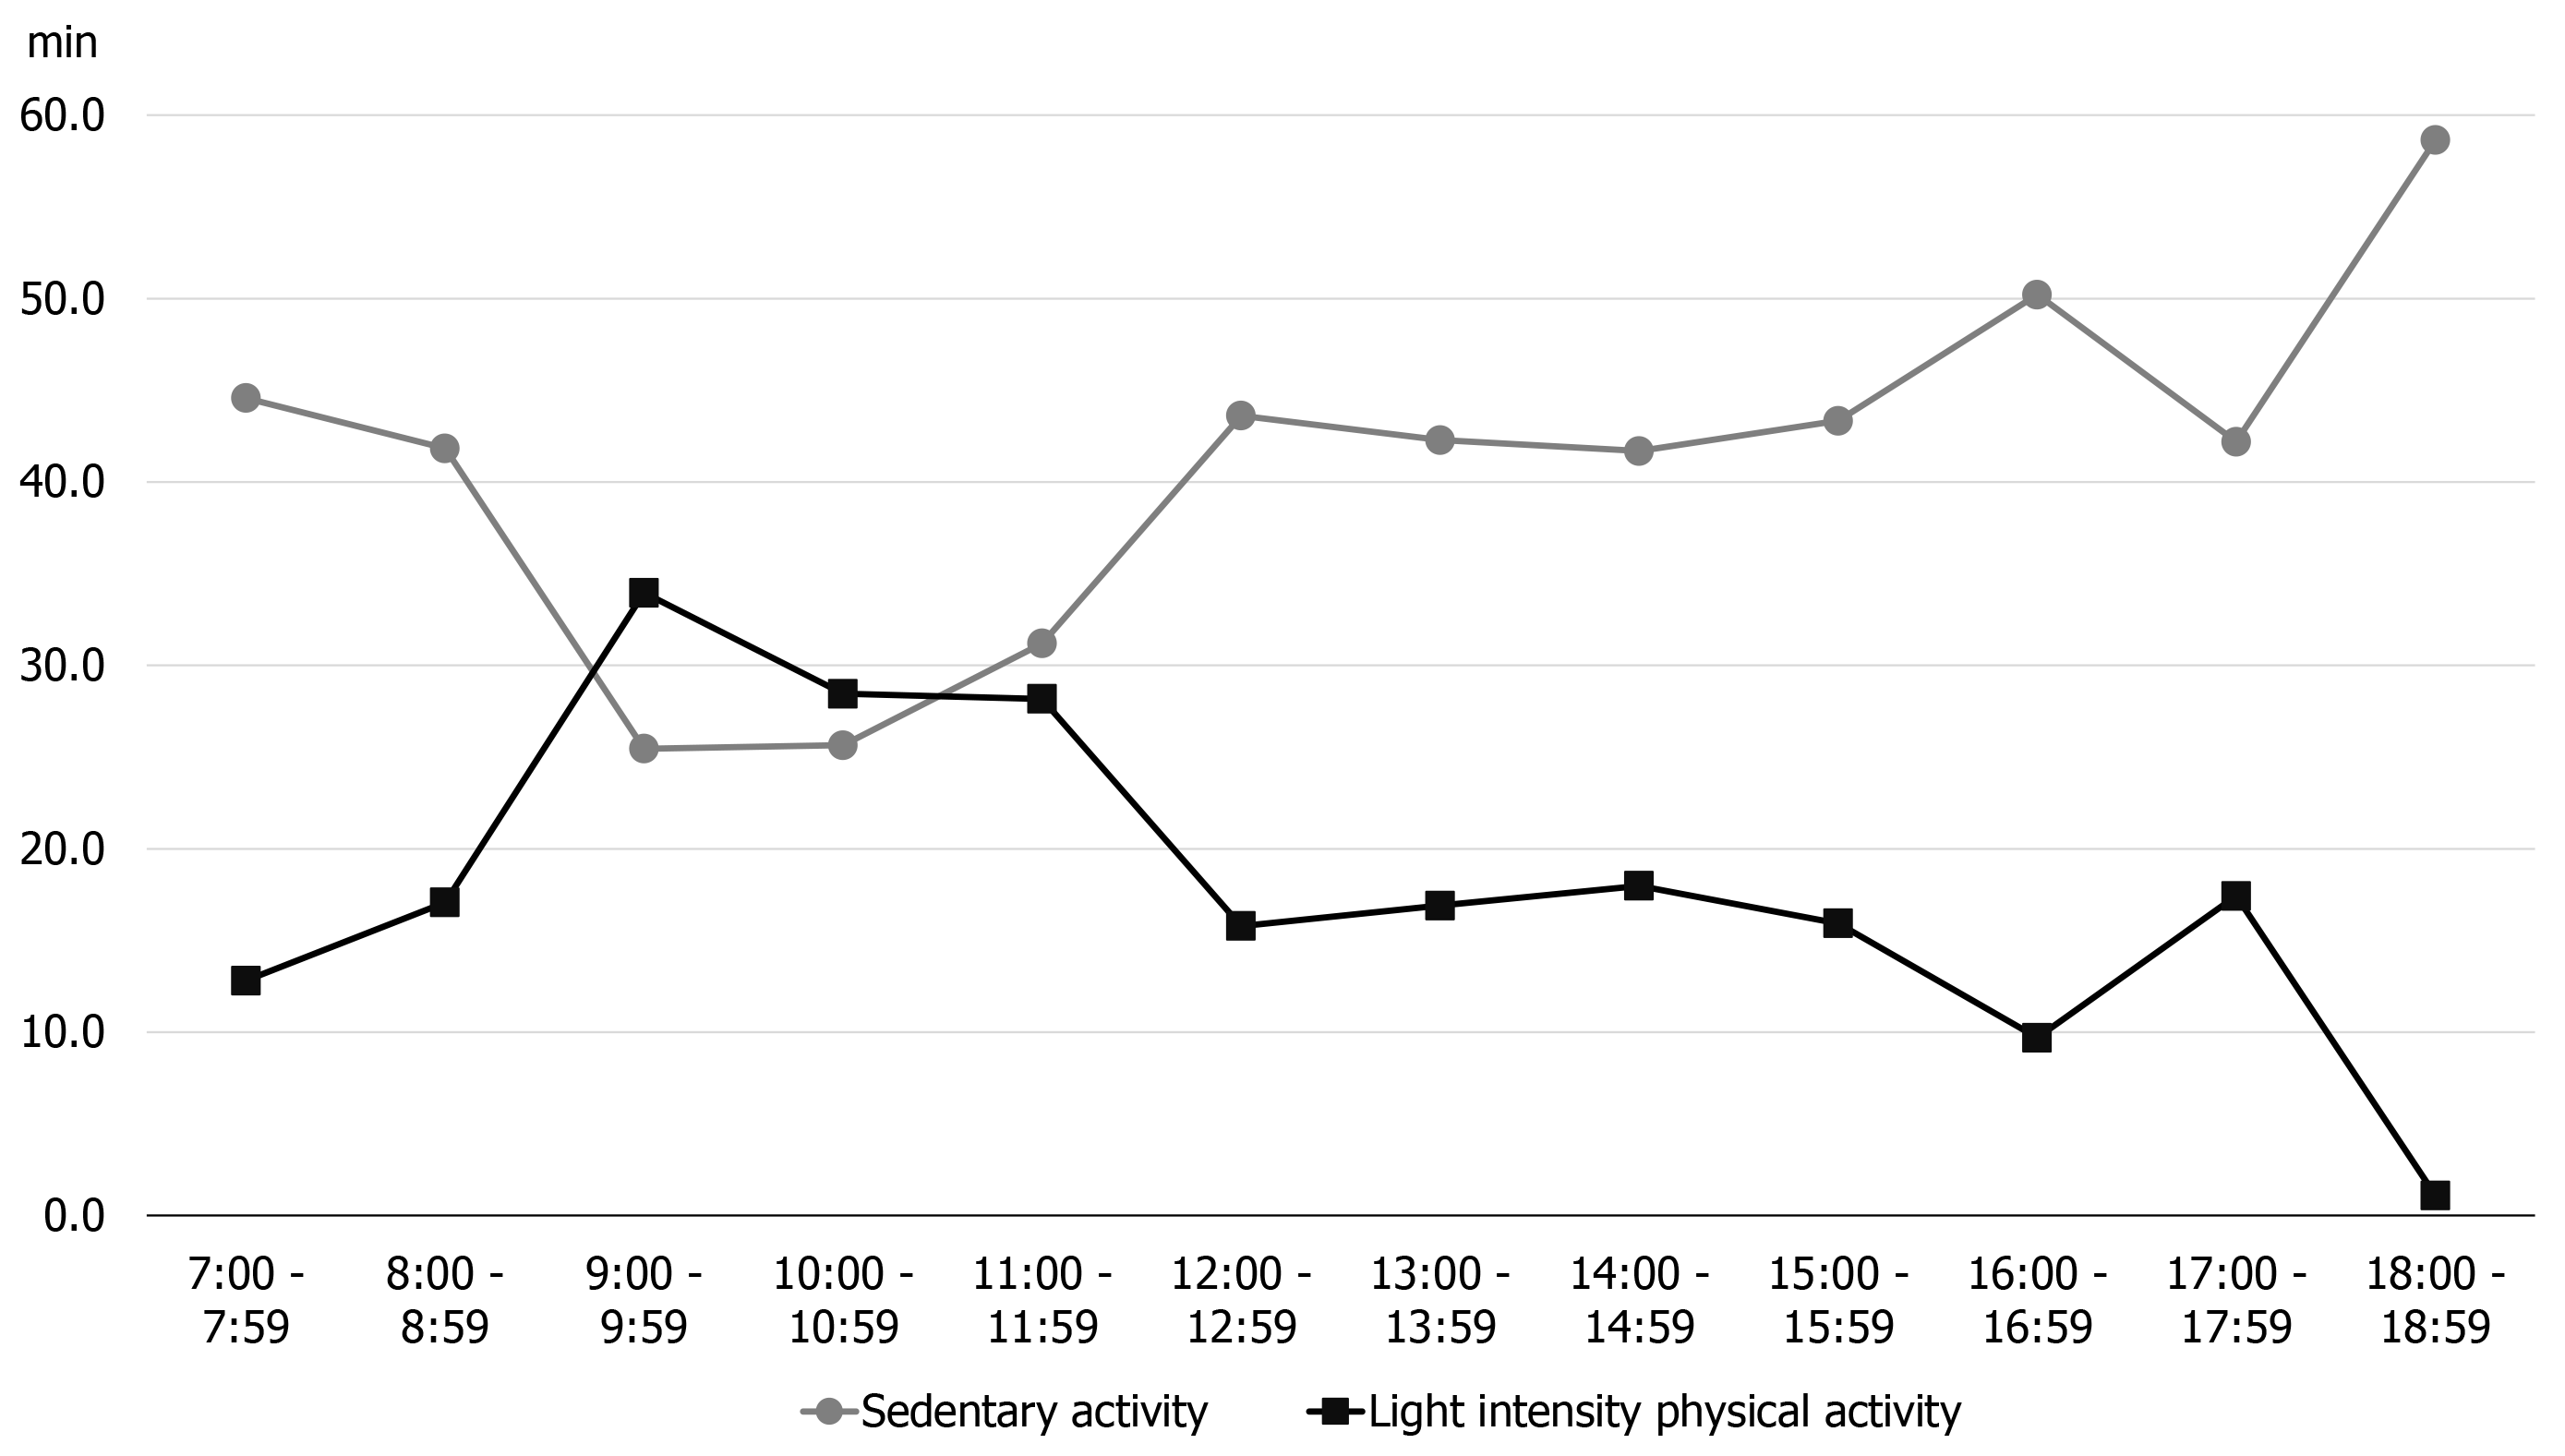
Figure 3 Early assessment of physical activity by time of day (7-d average).
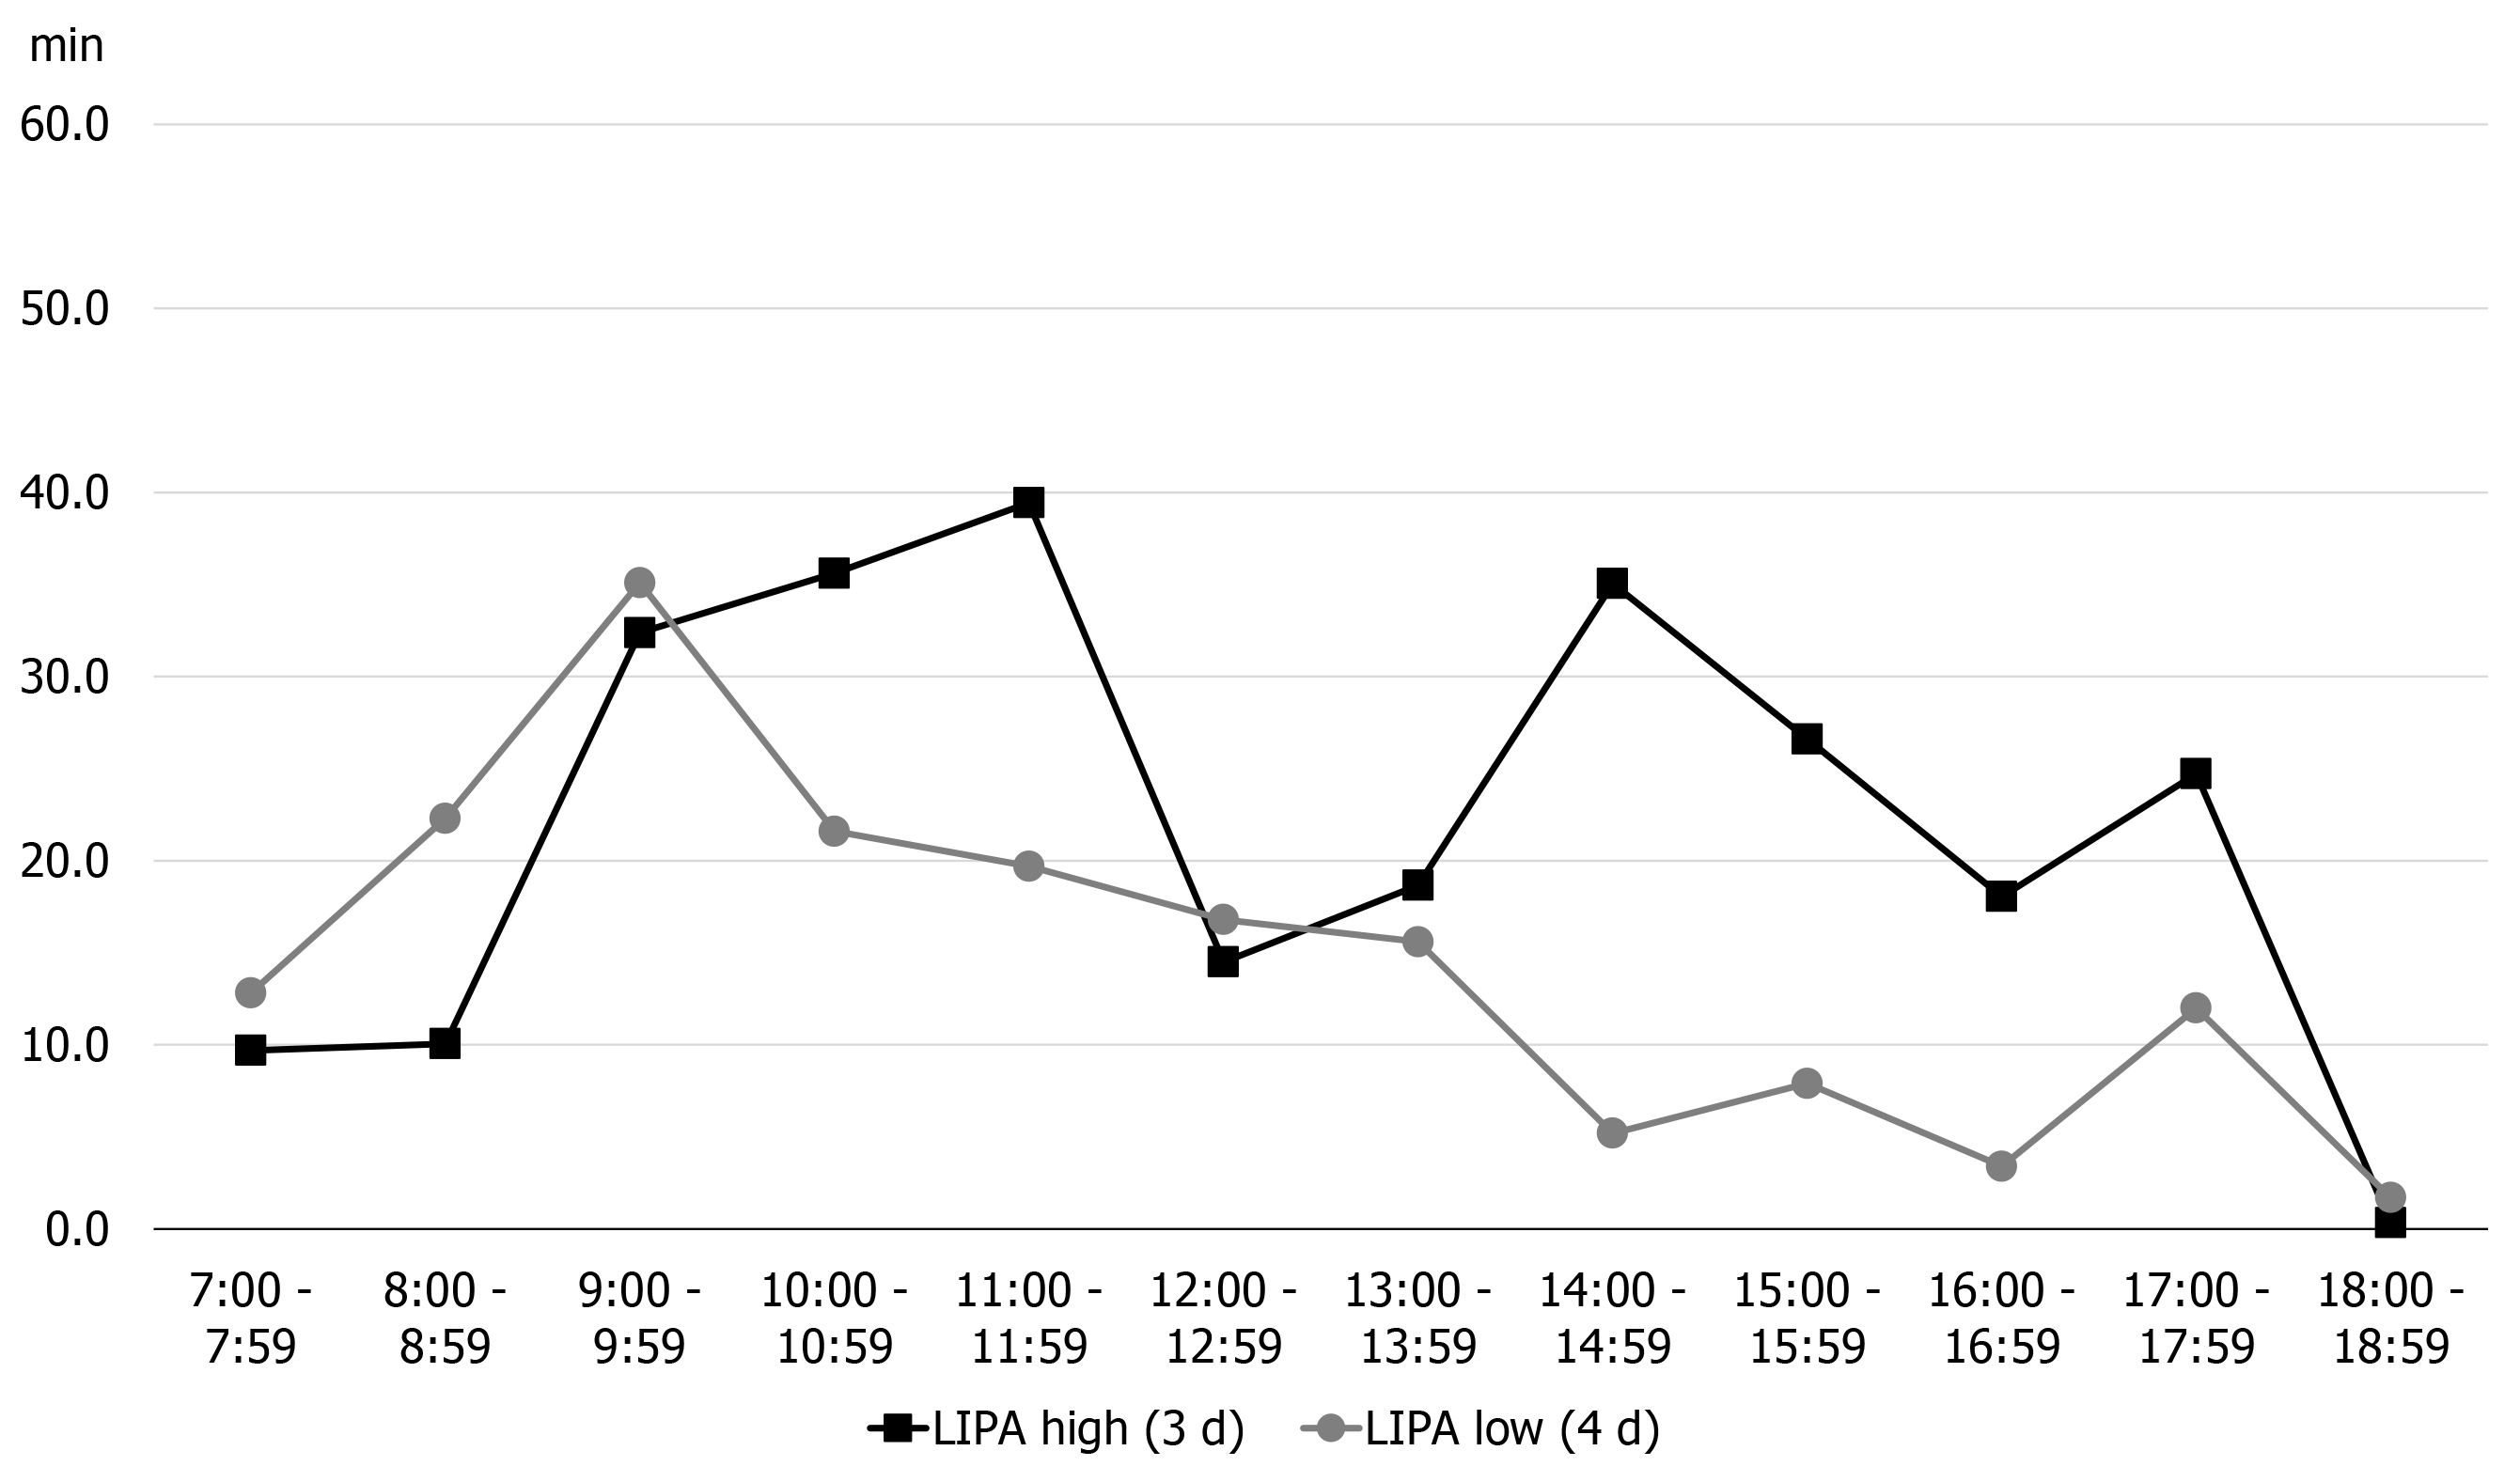
Figure 4 Comparison of light-intensity physical activity for each time point.
LIPA: Light-intensity physical activity.
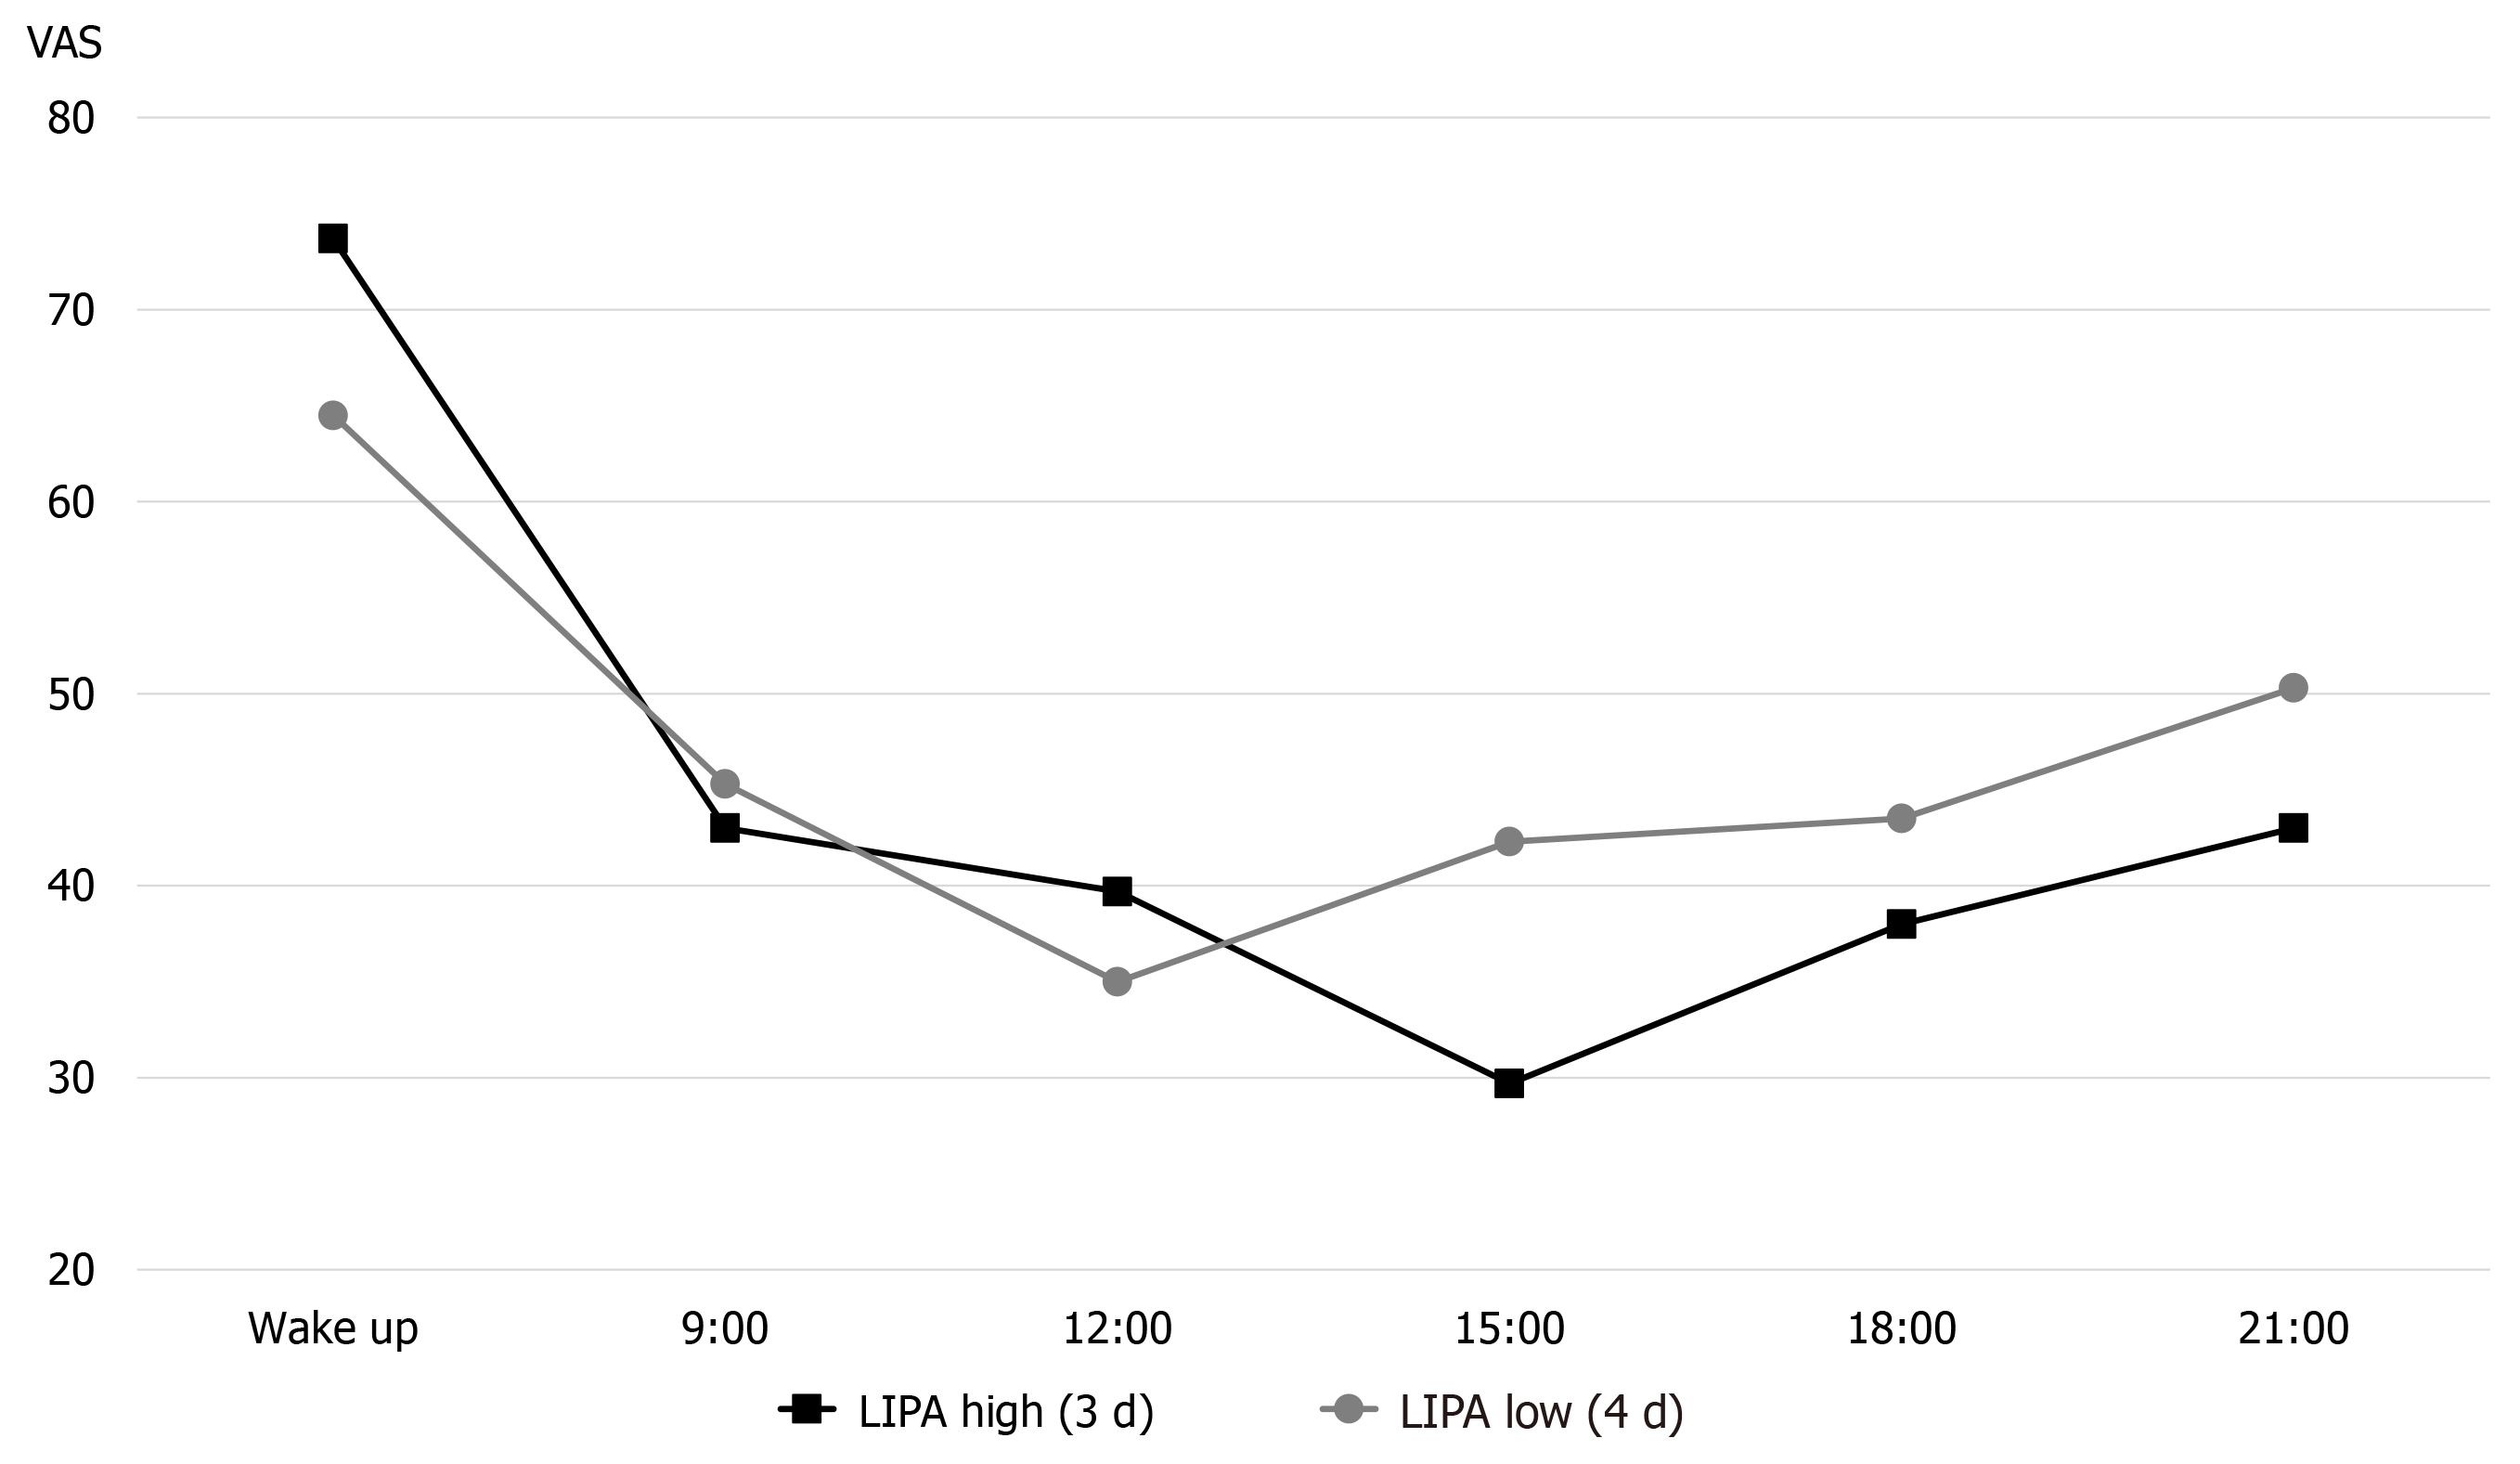
Figure 5 Comparison of pain intensity with high and low light-intensity physical activity.
LIPA: Light-intensity physical activity; VAS: Visual analogue scale.
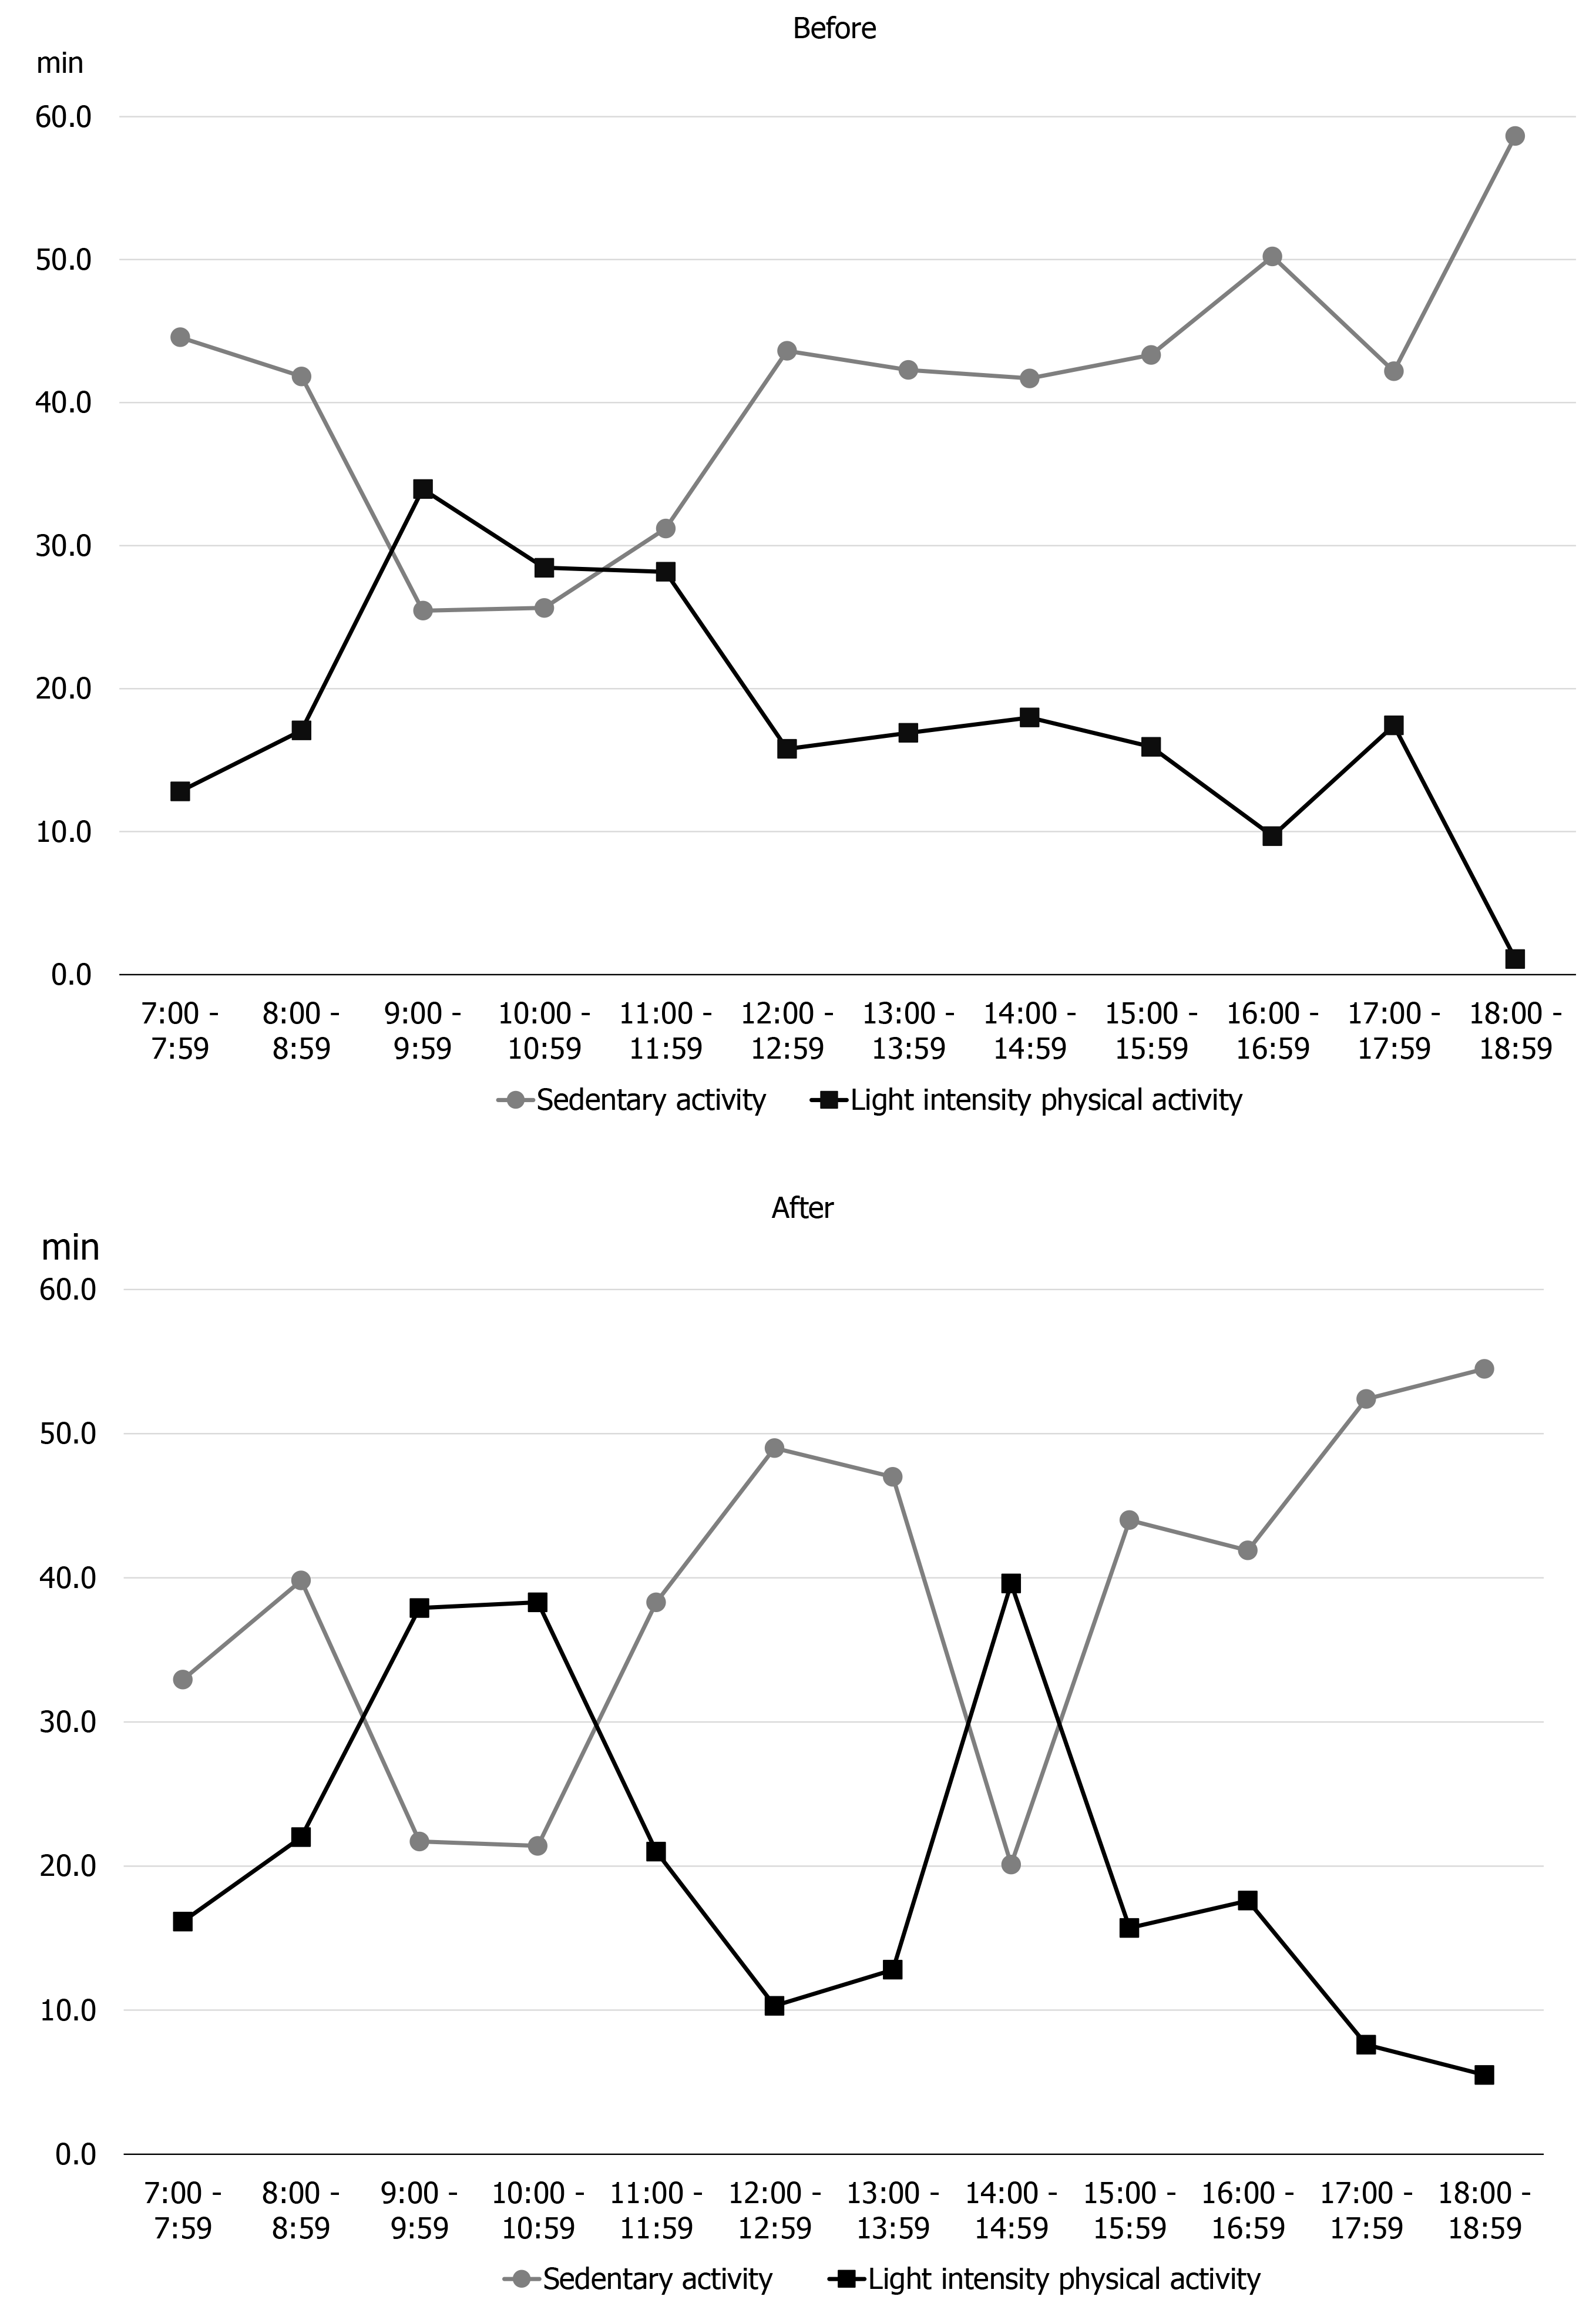
Figure 6 Changes in physical activity at each time of day.
Left: Early assessment; Right: Re-assessment.
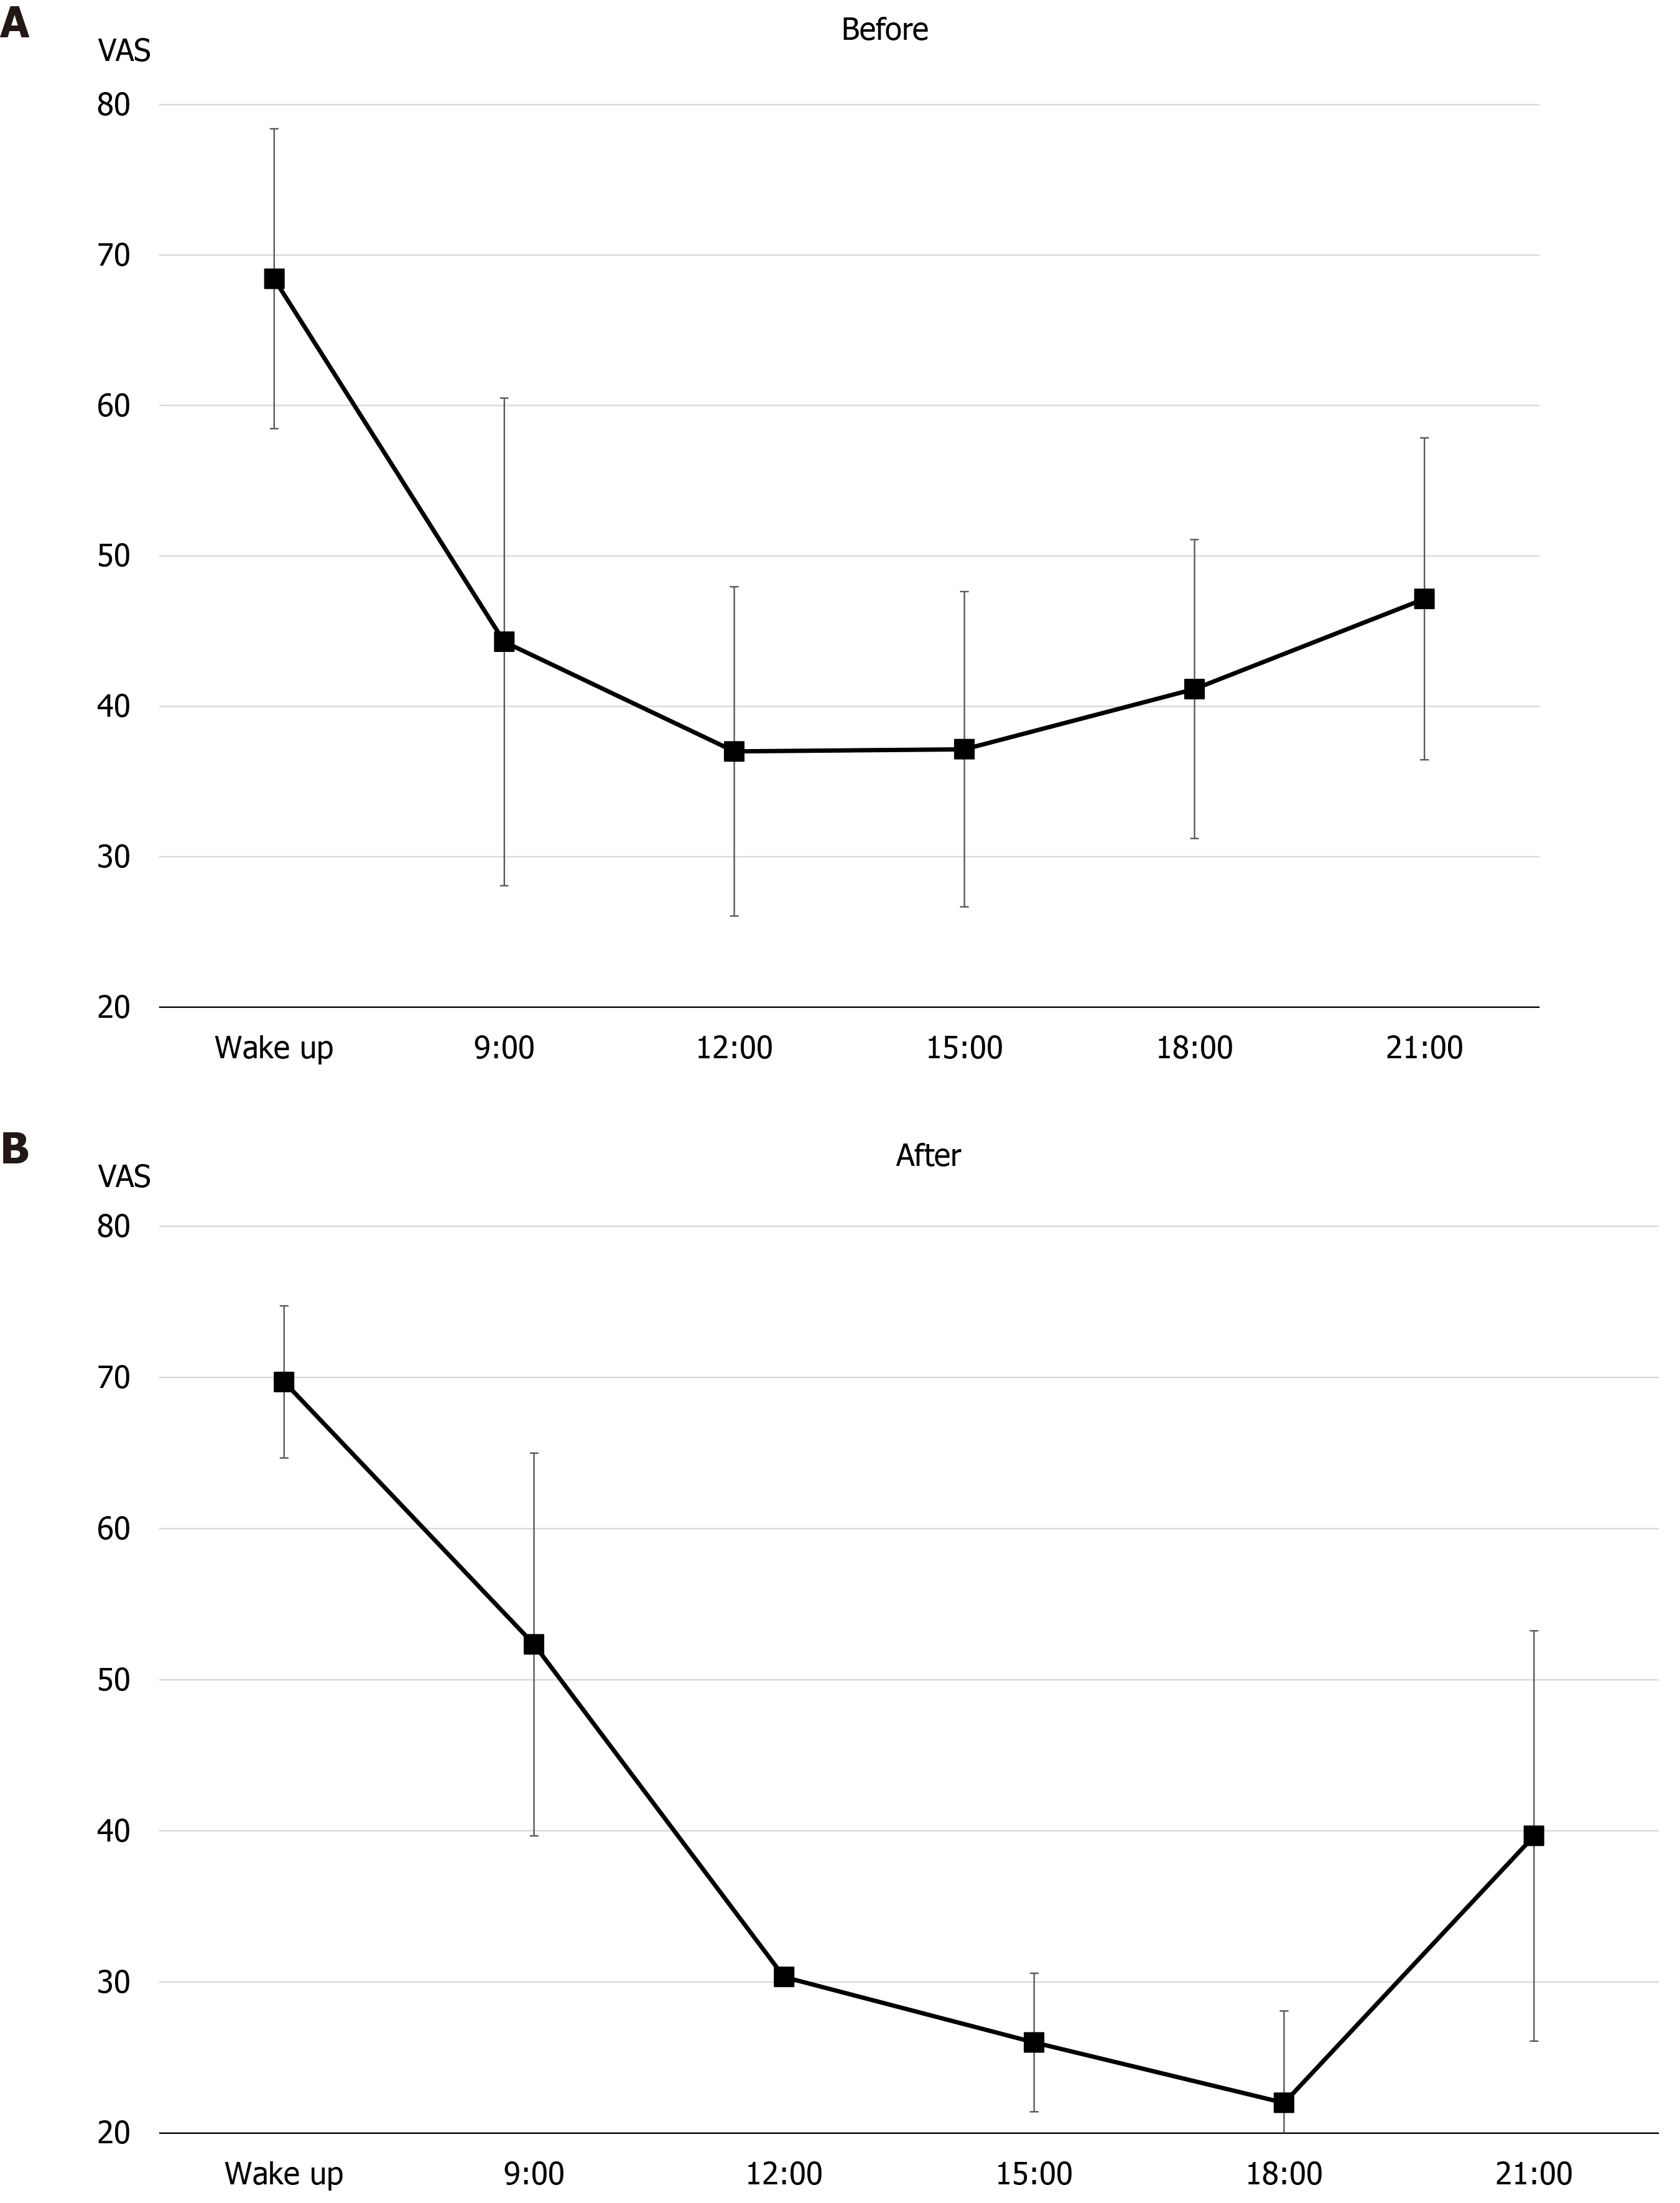
Figure 7 Changes in pain circadian rhythm (average of each observation point).
Left: Early assessment; Right: Re-assessment. VAS: Visual analogue scale.
- Citation: Tanaka Y, Sato G, Imai R, Osumi M, Shigetoh H, Fujii R, Morioka S. Effectiveness of patient education focusing on circadian pain rhythms: A case report and review of literature. World J Clin Cases 2021; 9(17): 4441-4452
- URL: https://www.wjgnet.com/2307-8960/full/v9/i17/4441.htm
- DOI: https://dx.doi.org/10.12998/wjcc.v9.i17.4441


