Copyright
©The Author(s) 2021.
World J Clin Cases. Jun 16, 2021; 9(17): 4415-4422
Published online Jun 16, 2021. doi: 10.12998/wjcc.v9.i17.4415
Published online Jun 16, 2021. doi: 10.12998/wjcc.v9.i17.4415
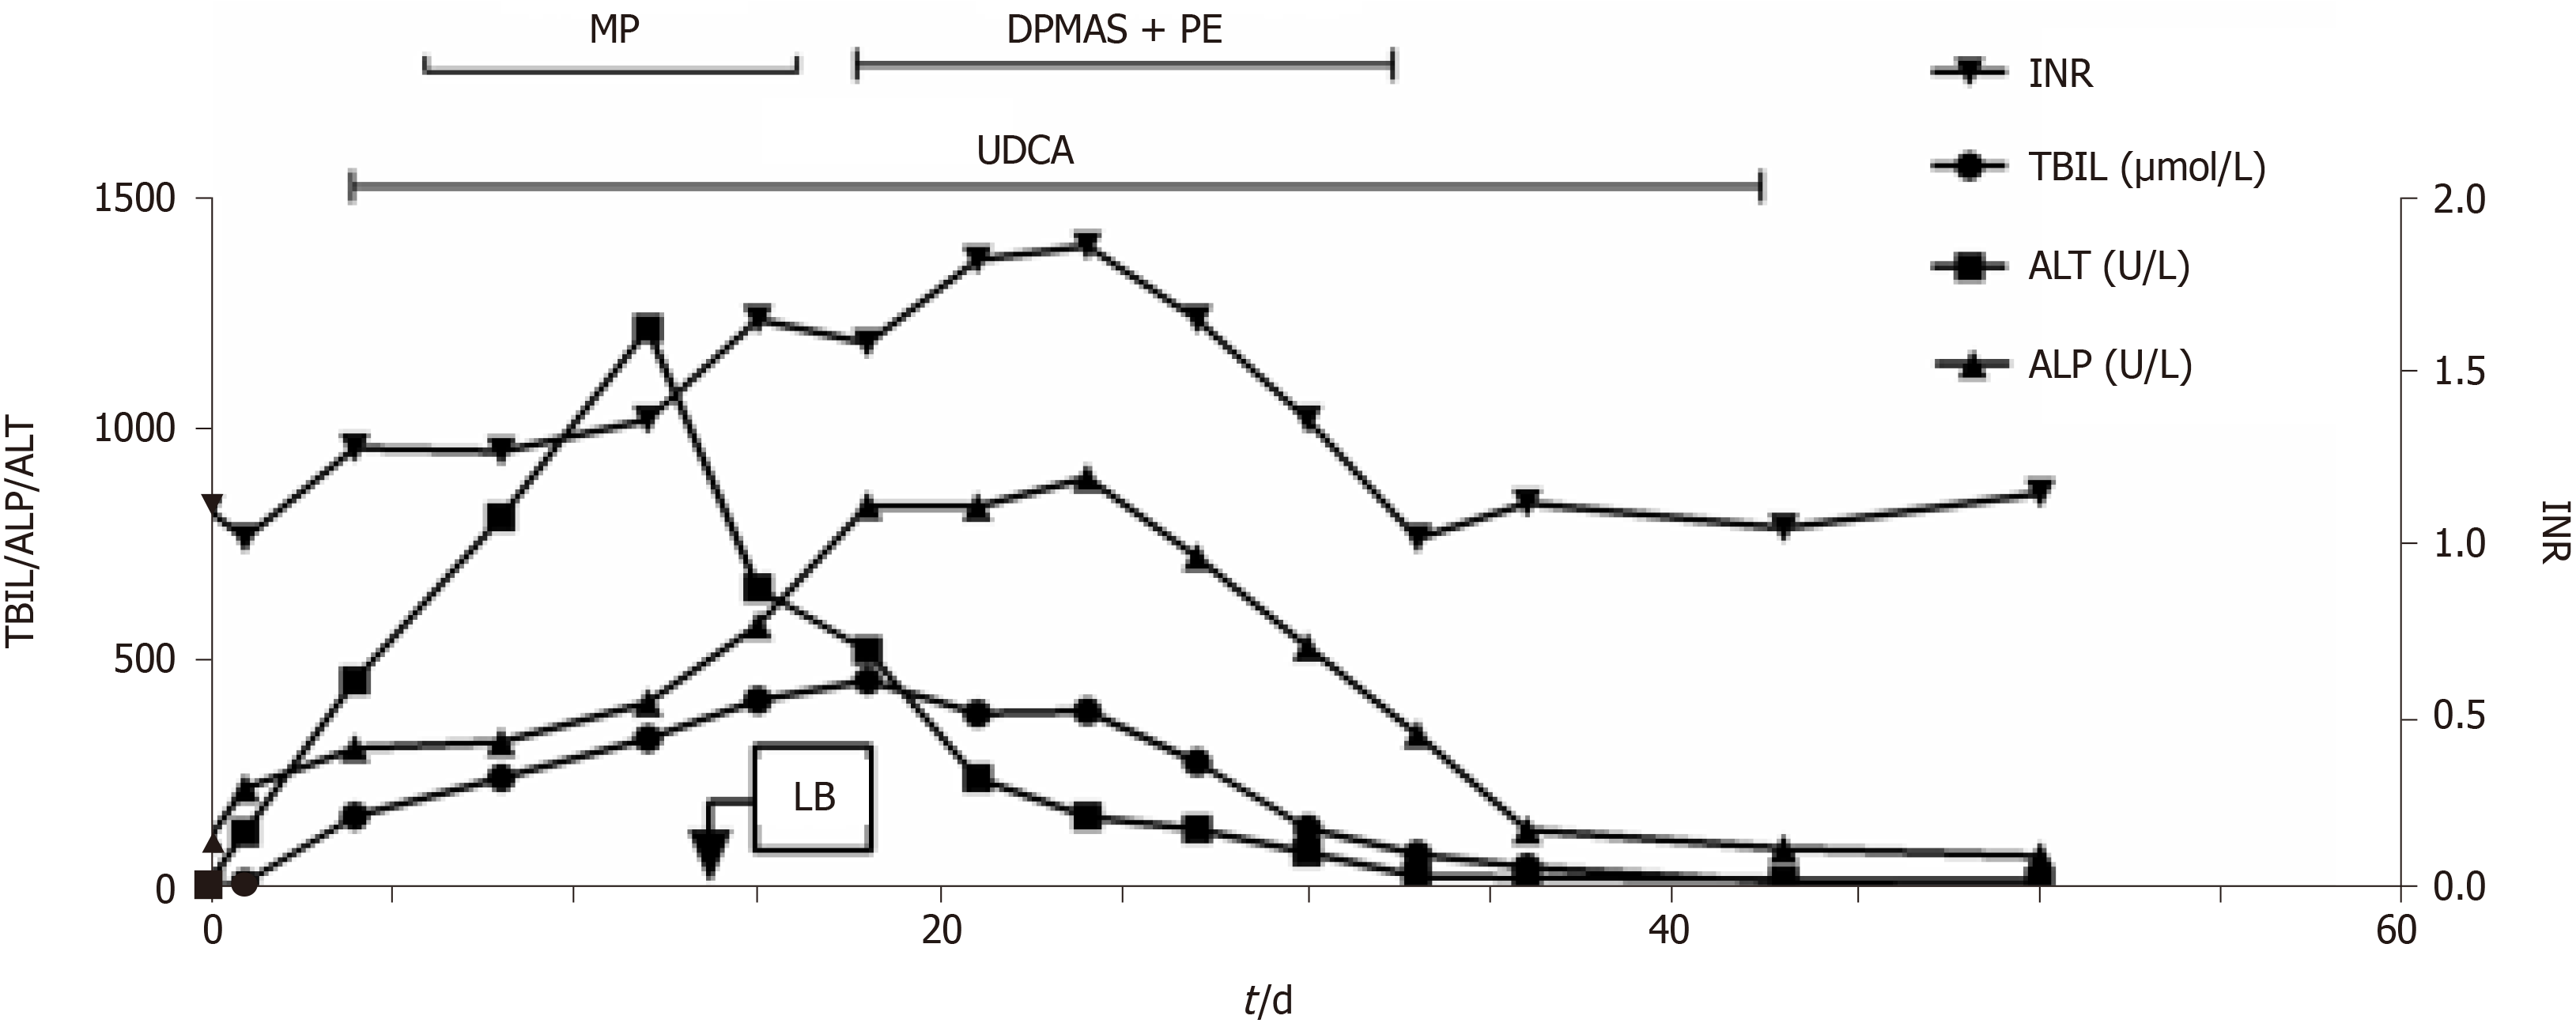
Figure 1 Flow chart of liver function change and treatment intervention.
LB: Liver biopsy; MP: Methylprednisolone; DPMAS: Dual plasma molecular adsorption system; PE: Plasma exchange; TBIL: Total bilirubin; ALP: Alkaline phosphatase; ALT: Alanine aminotransferase; UDCA: Ursodeoxycholic acid; INR: International normalized ratio.
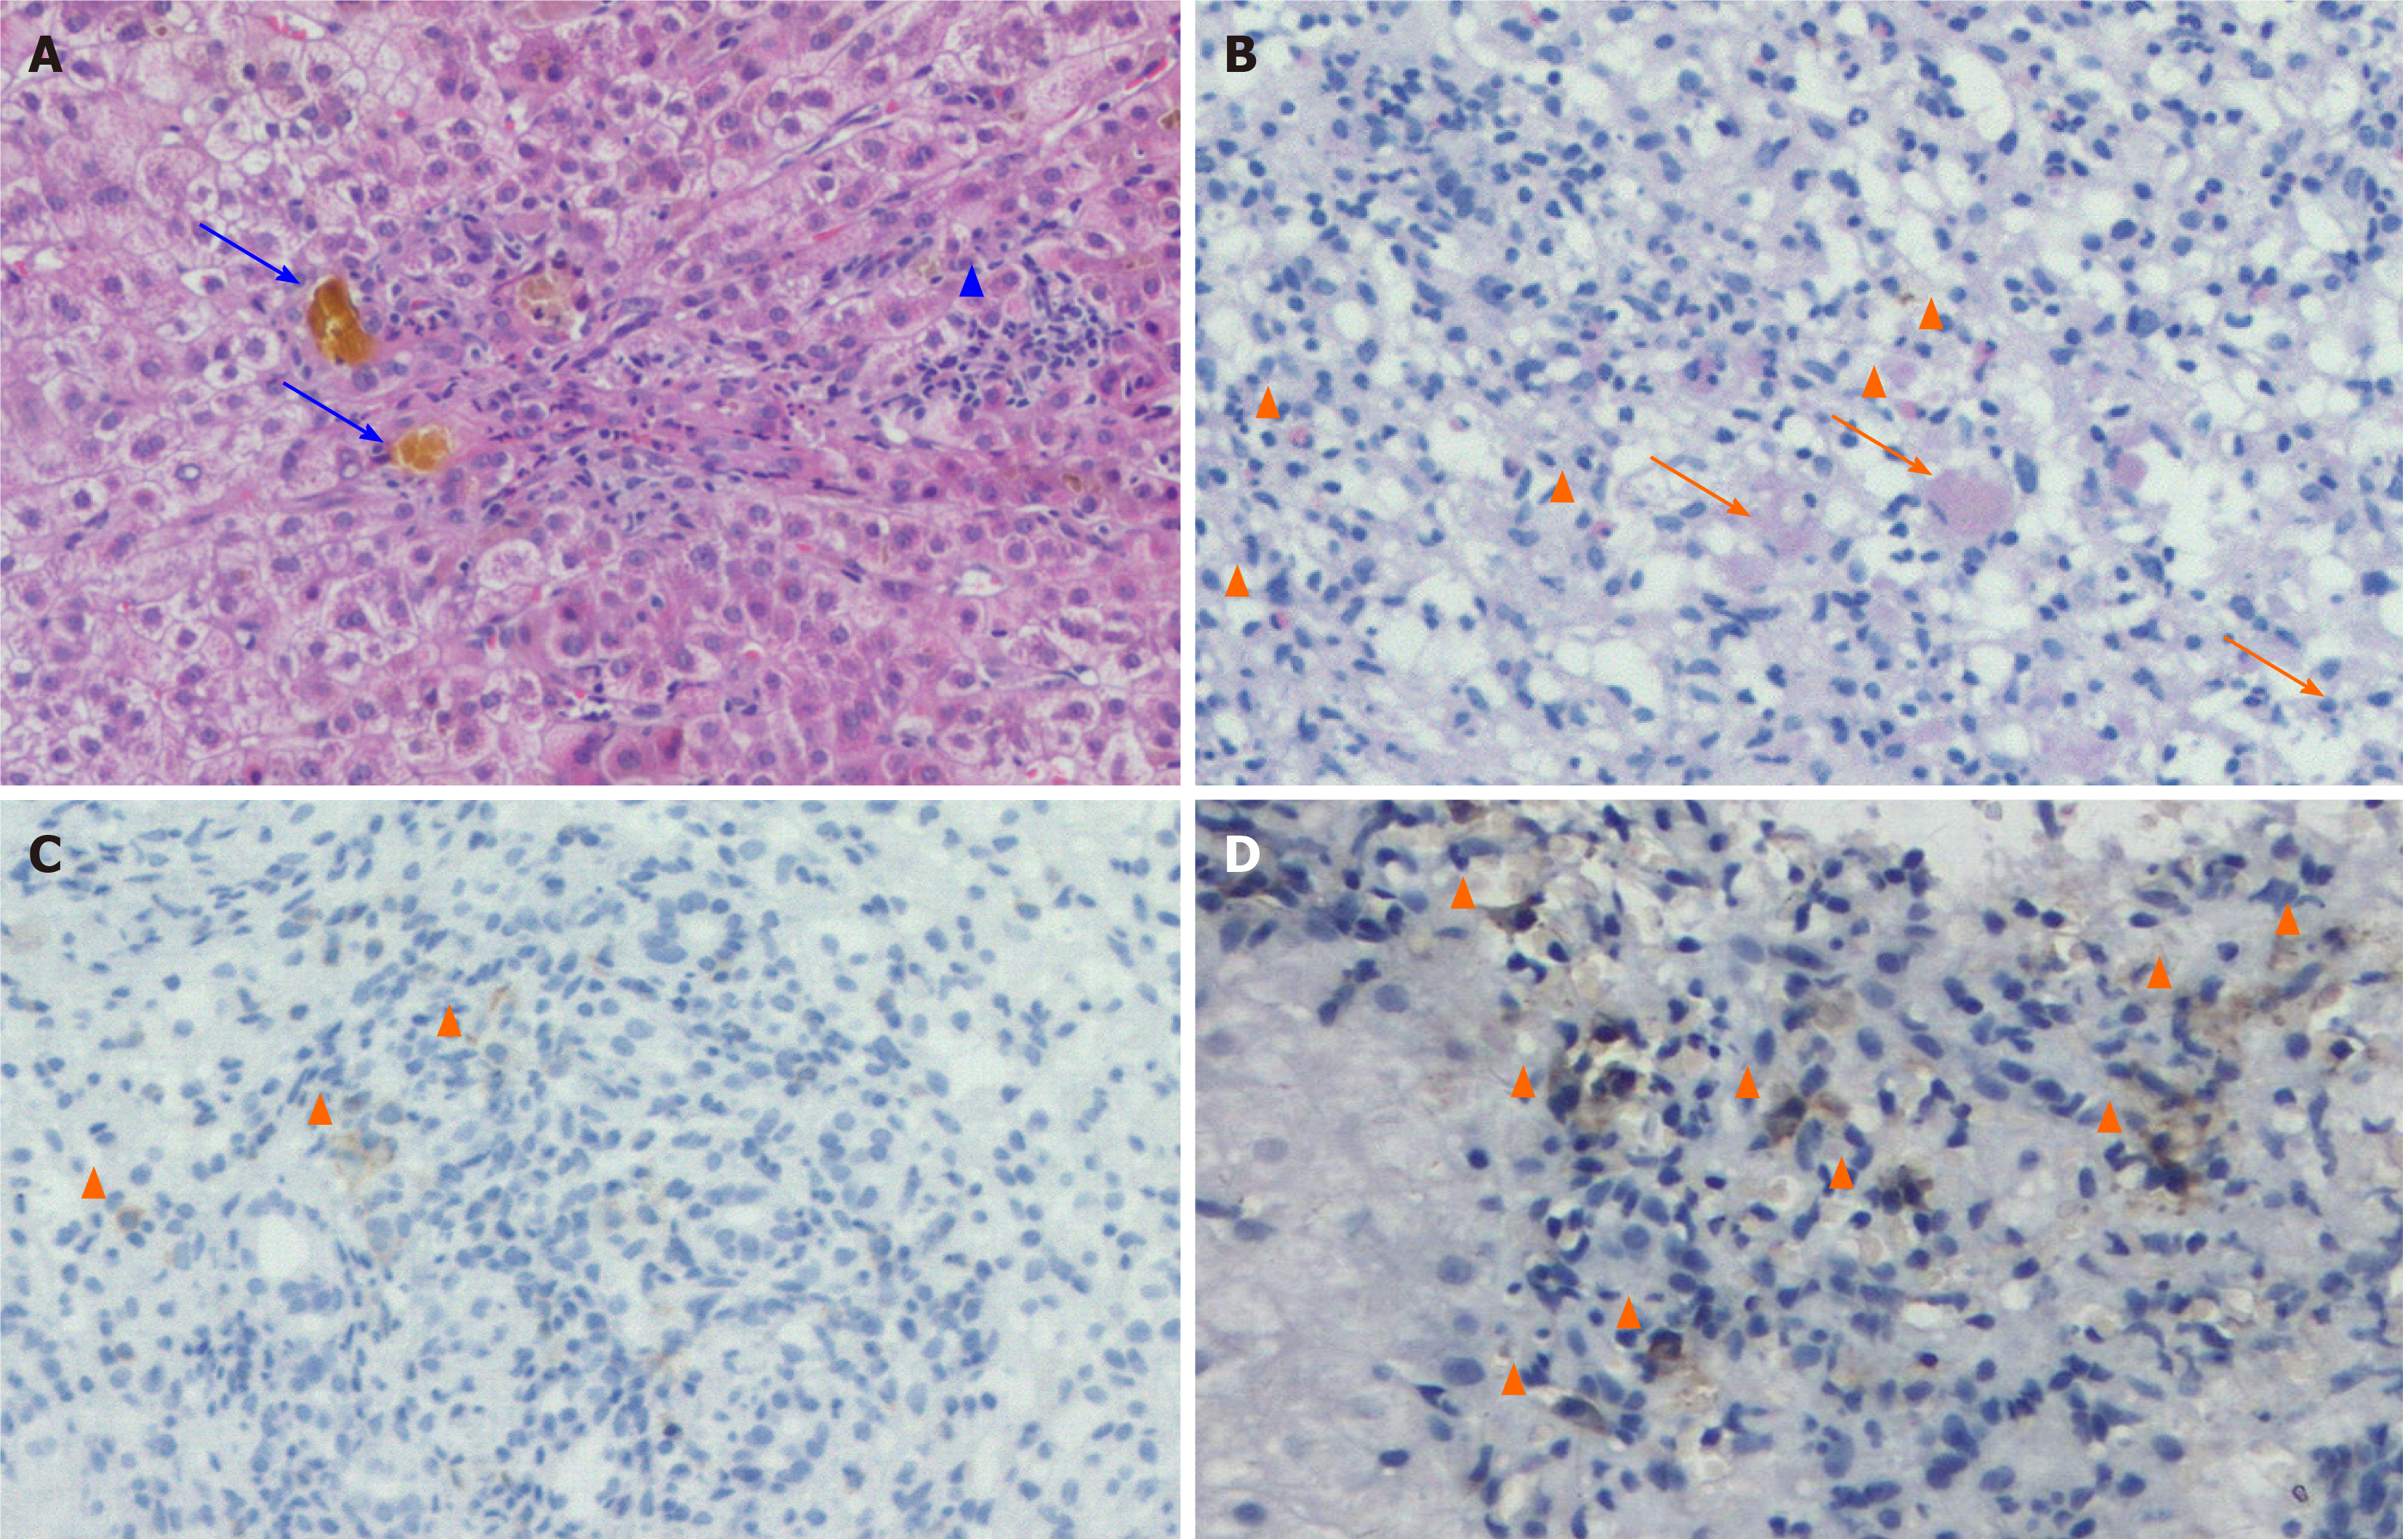
Figure 2 Pathological findings of liver biopsy.
A: Zone 3 and surrounding lobular inflammation (arrow), bile lake (long arrow), and hematoxylin-eosin staining, 200 ×; B: A large number of eosinophils (arrow) and macrophage phagocyte waxy material (long arrow), Periodic Acid-Schiff with diastase, 200 ×; C: CD4+ T cells (arrow), CD4+ T immunohistochemical staining, 200 ×; D: CD8+ T cells (arrow), CD8+ T immunohistochemical staining, 200 ×.
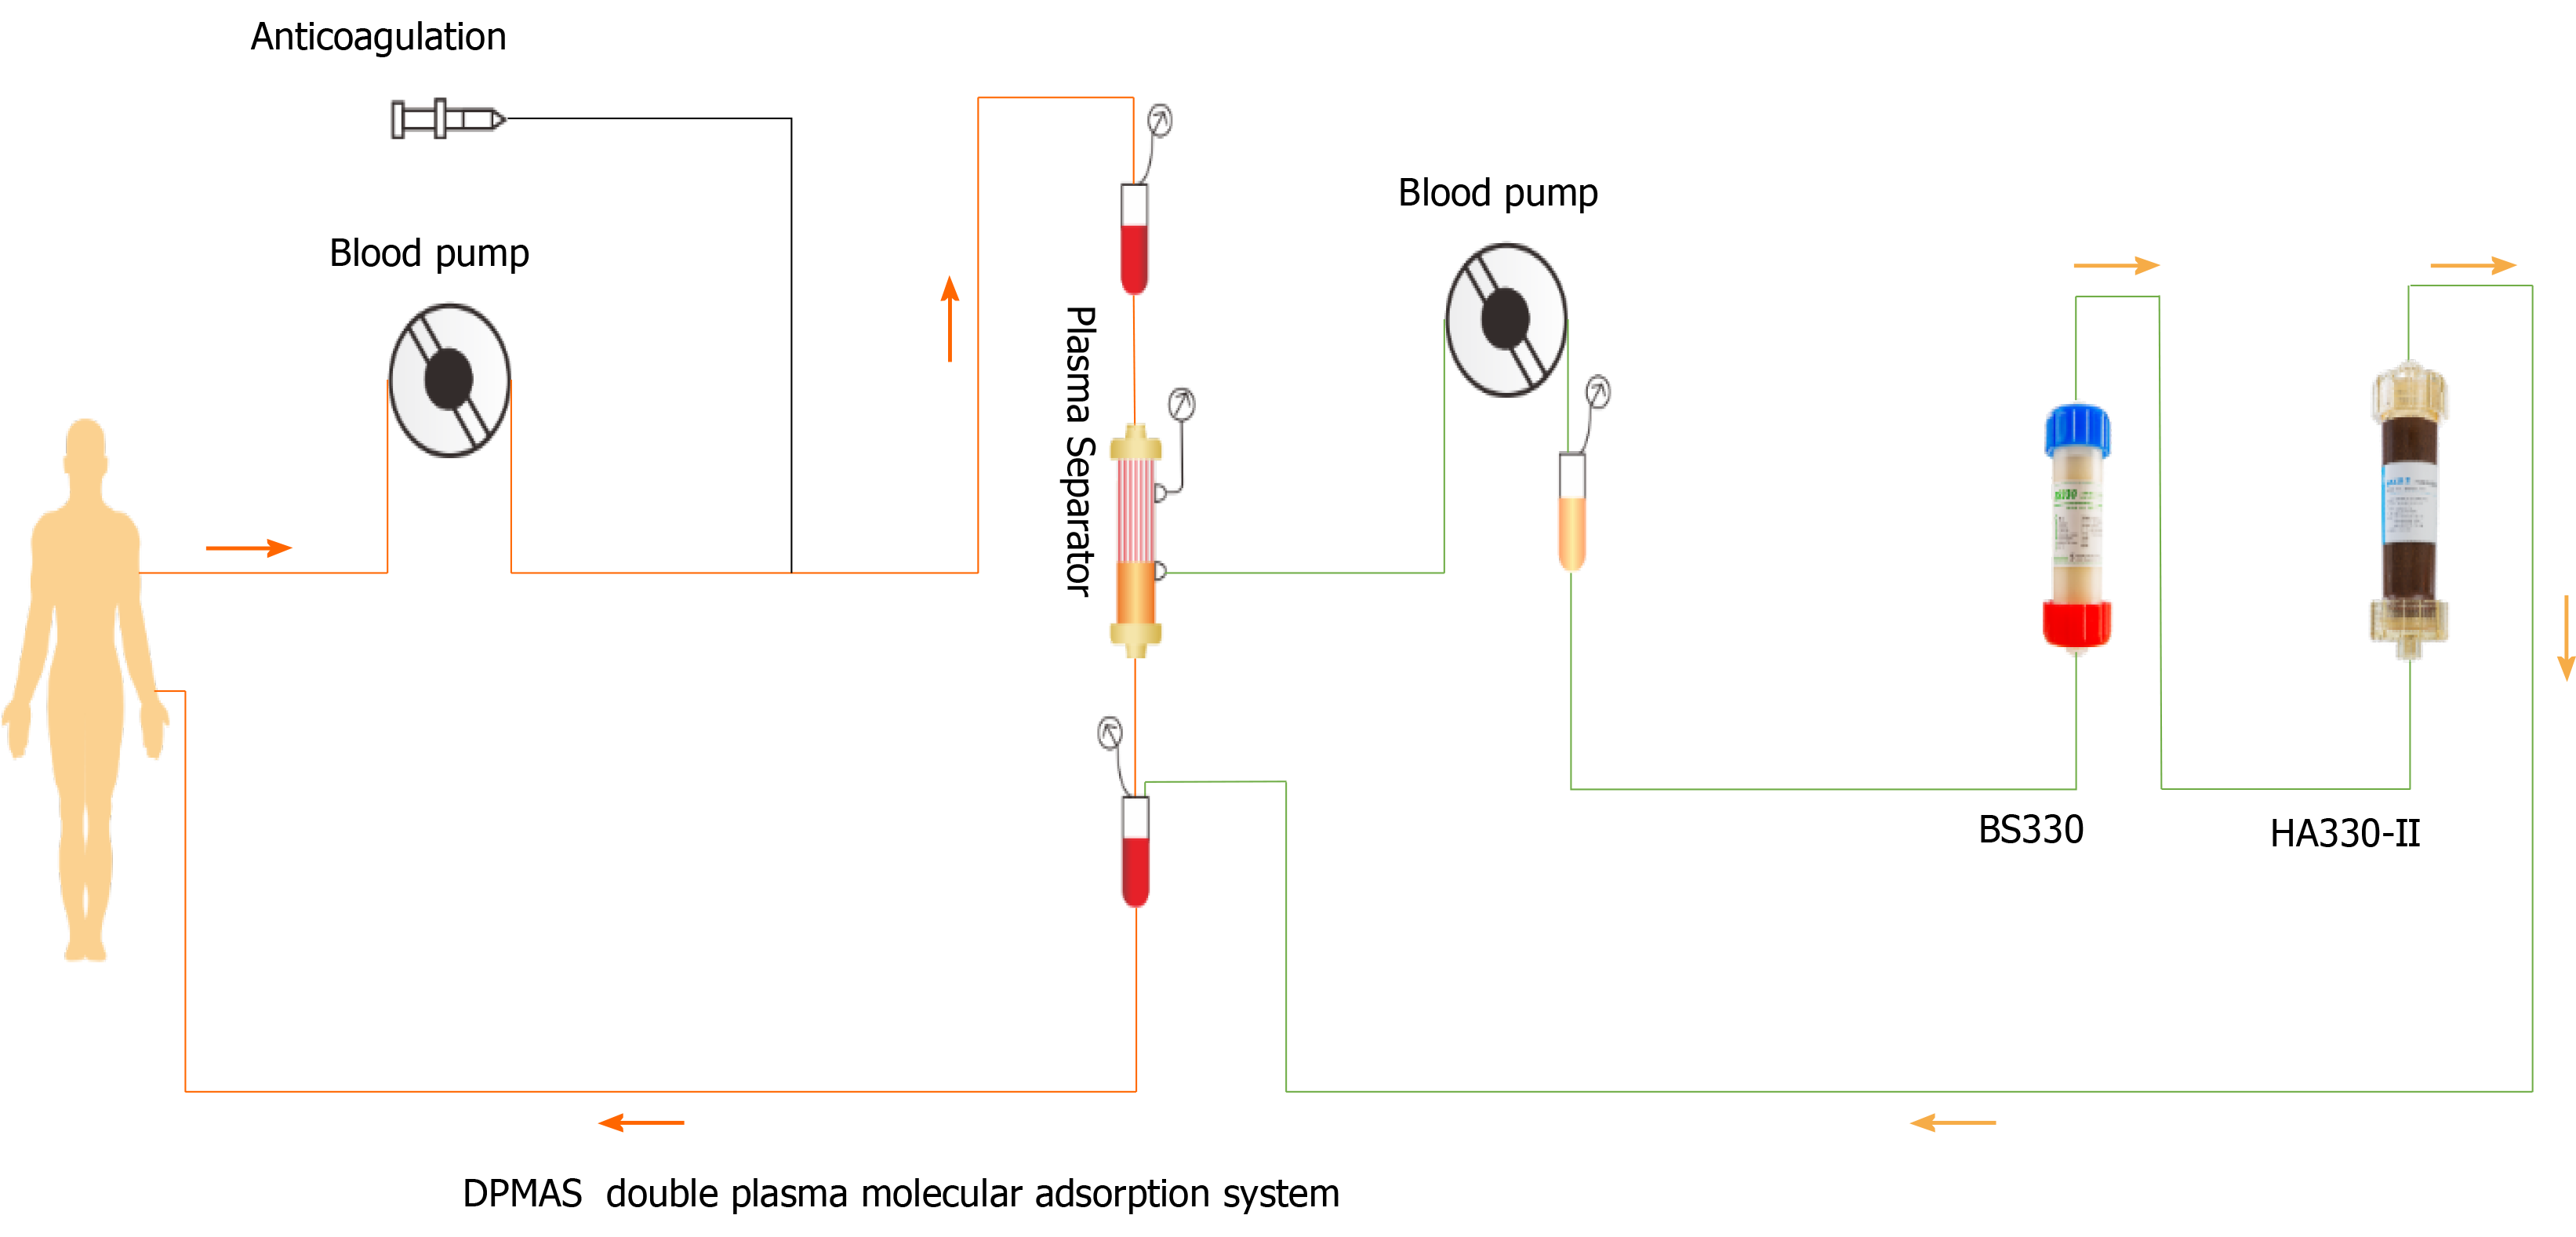
Figure 3 Double plasma molecular adsorption system.
- Citation: Tan YW, Chen L, Zhou XB. Efficacy of artificial liver support system in severe immune-associated hepatitis caused by camrelizumab: A case report and review of the literature. World J Clin Cases 2021; 9(17): 4415-4422
- URL: https://www.wjgnet.com/2307-8960/full/v9/i17/4415.htm
- DOI: https://dx.doi.org/10.12998/wjcc.v9.i17.4415


