Copyright
©The Author(s) 2021.
World J Clin Cases. Jun 16, 2021; 9(17): 4210-4220
Published online Jun 16, 2021. doi: 10.12998/wjcc.v9.i17.4210
Published online Jun 16, 2021. doi: 10.12998/wjcc.v9.i17.4210
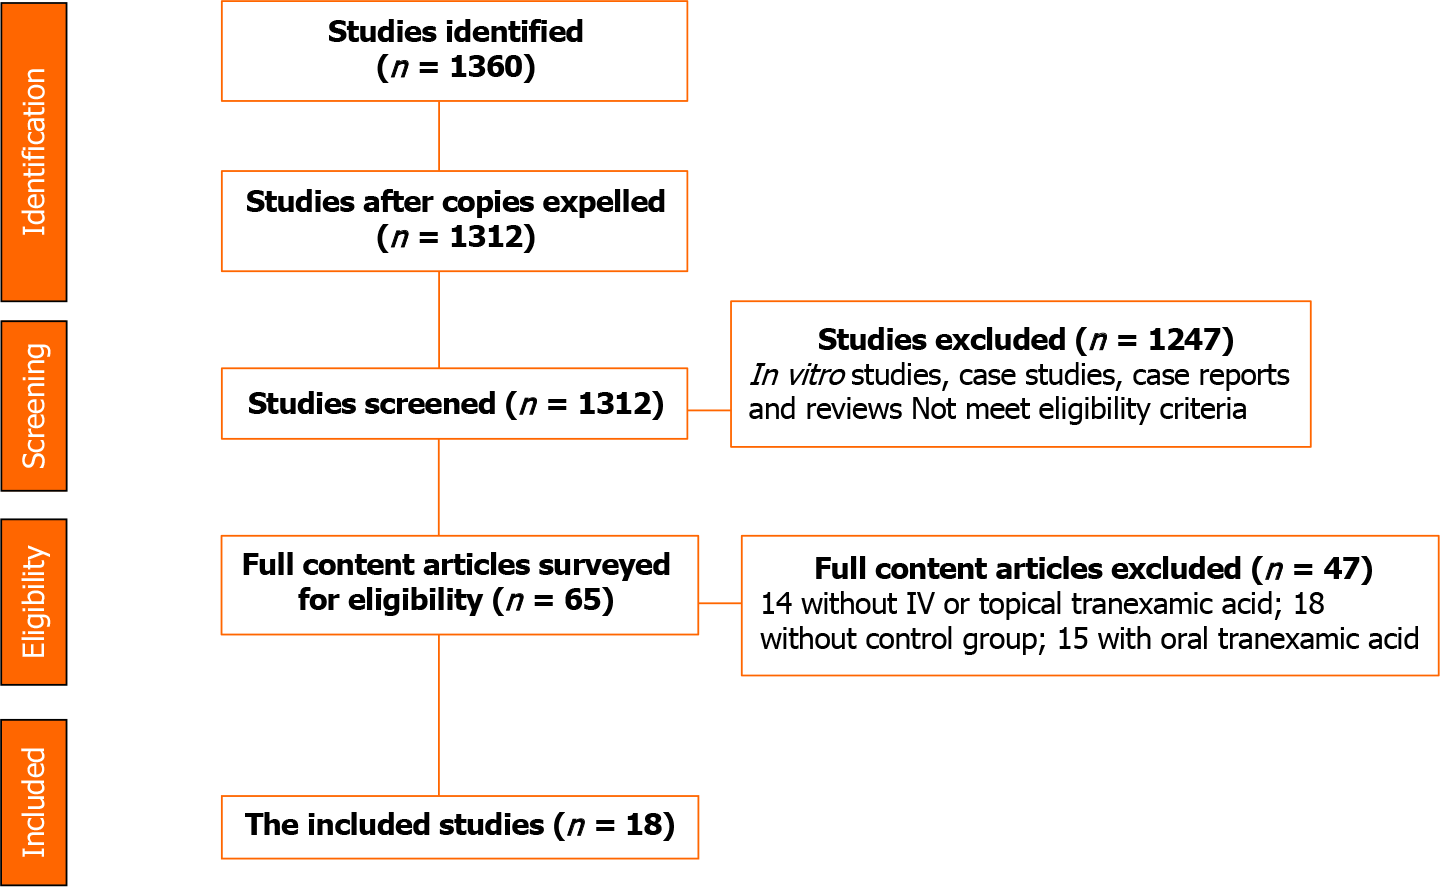
Figure 1 Study attrition.
Eighteen papers were finally included in the meta-analysis.
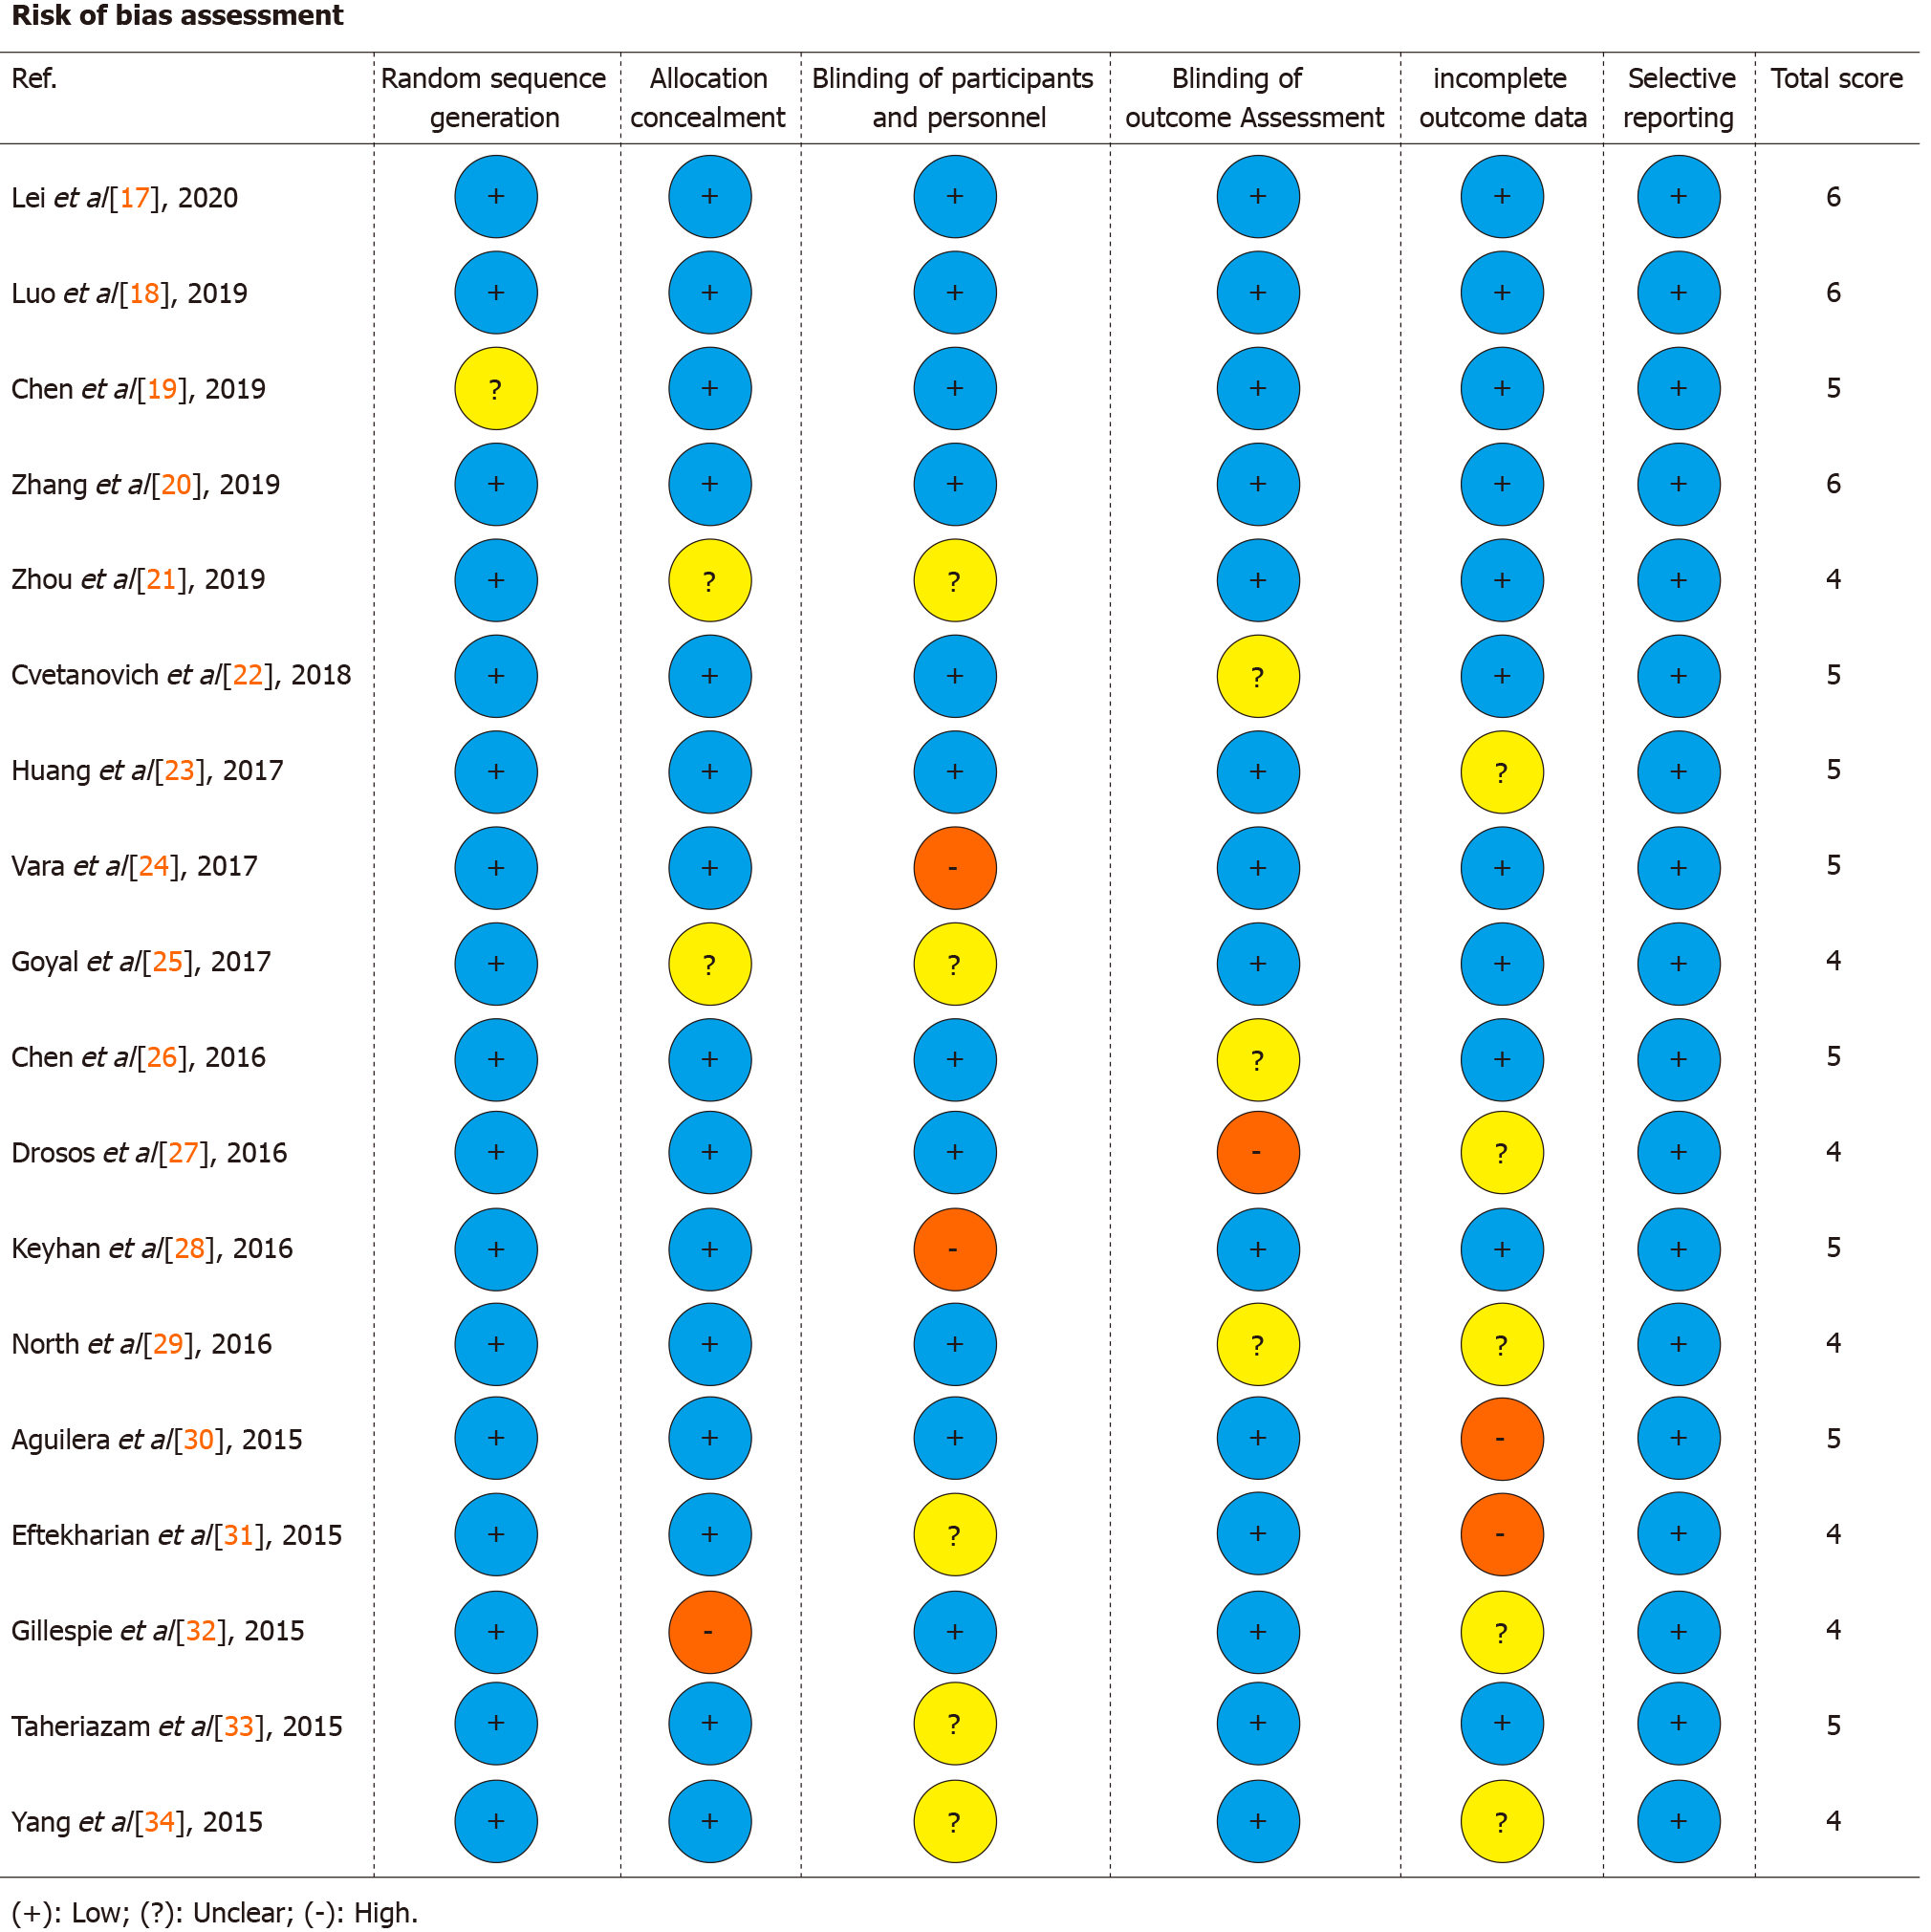
Figure 2 Risk of bias assessment.
(+): Low; (?): Unclear; (-): High.
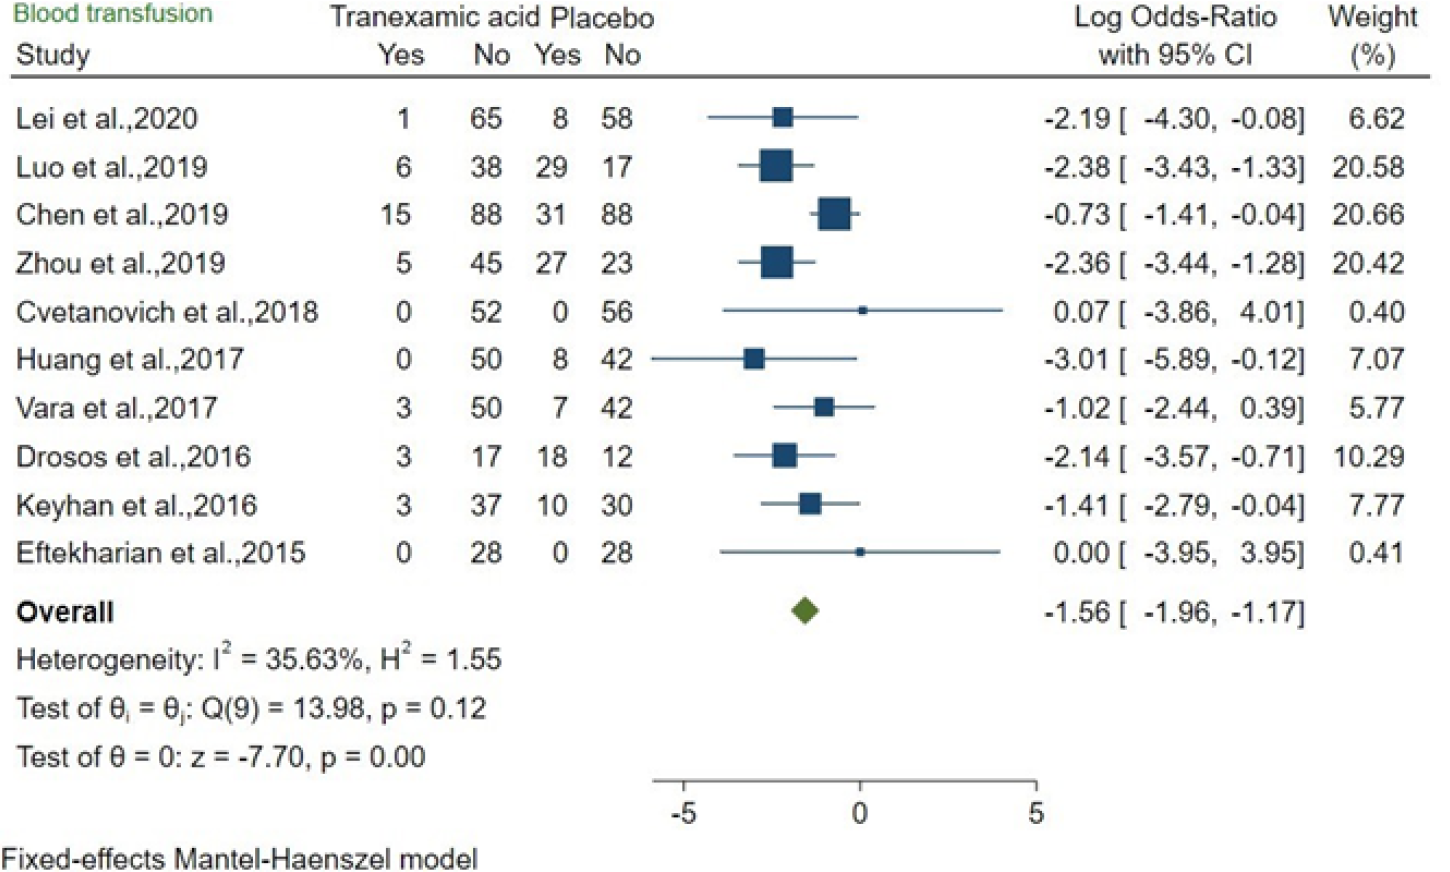
Figure 3 Forest plot showed odds ratio (95% confidence interval) for risk of blood transfusion between tranexamic acid and placebo in bone surgery.
CI: Confidence interval.
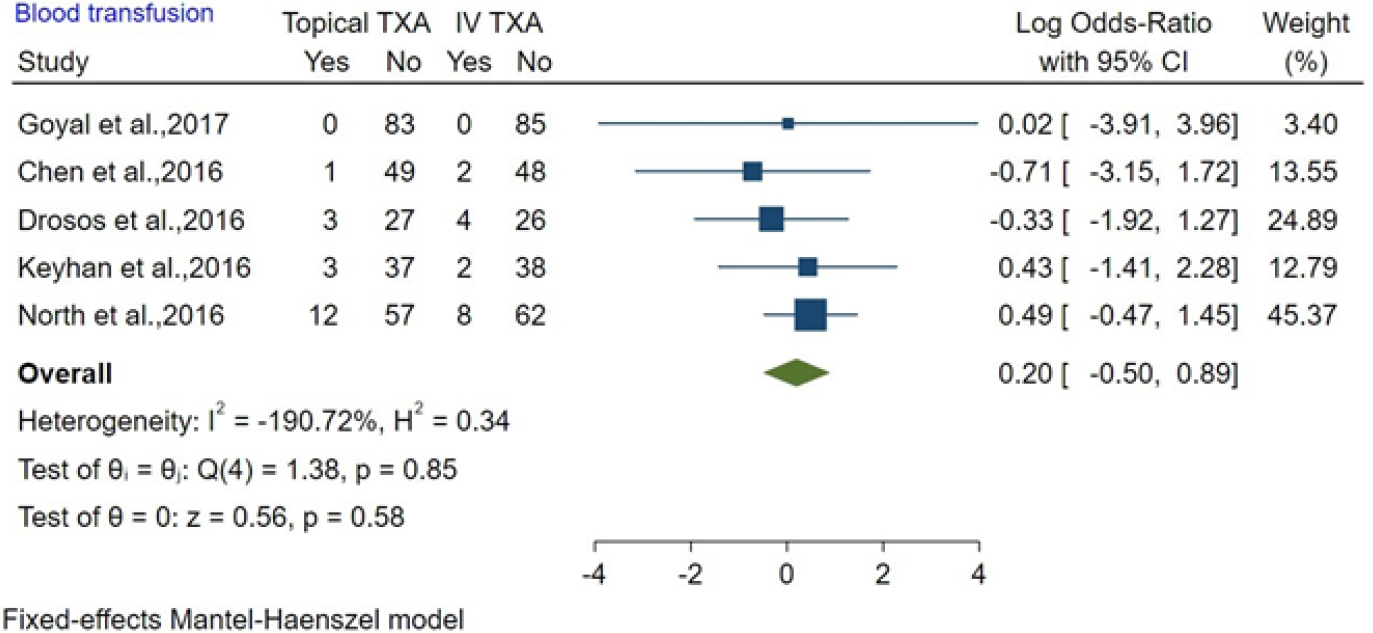
Figure 4 Forest plot showed odds ratio for risk of blood transfusion between topical tranexamic acid and IV tranexamic acid in bone surgery.
CI: Confidence interval; TXA: Tranexamic acid.
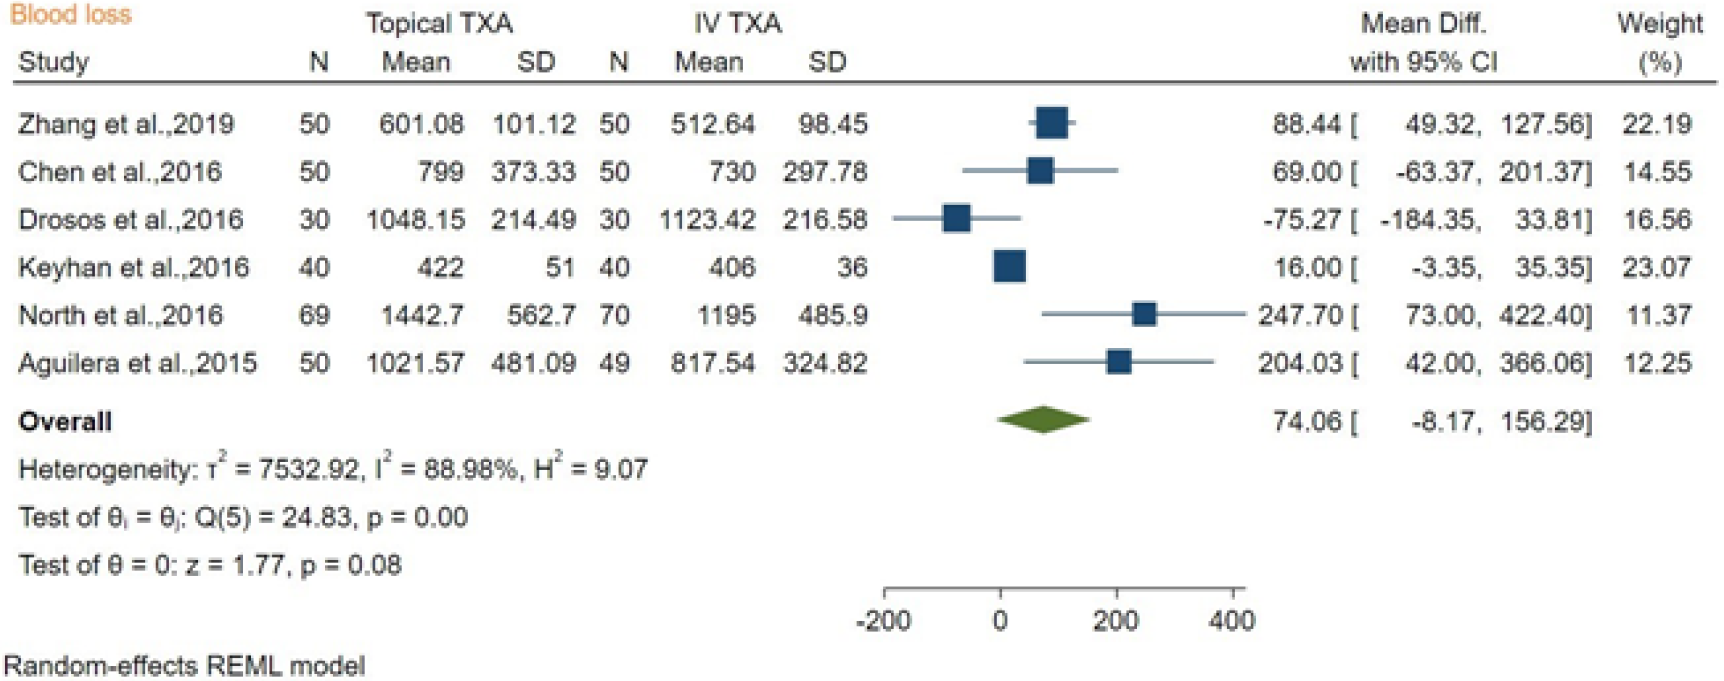
Figure 5 Forest plot showed mean difference (95% confidence interval) of blood loss between topical tranexamic acid and IV tranexamic acid in bone surgery.
CI: Confidence interval; SD: Standard deviation; TXA: Tranexamic acid.
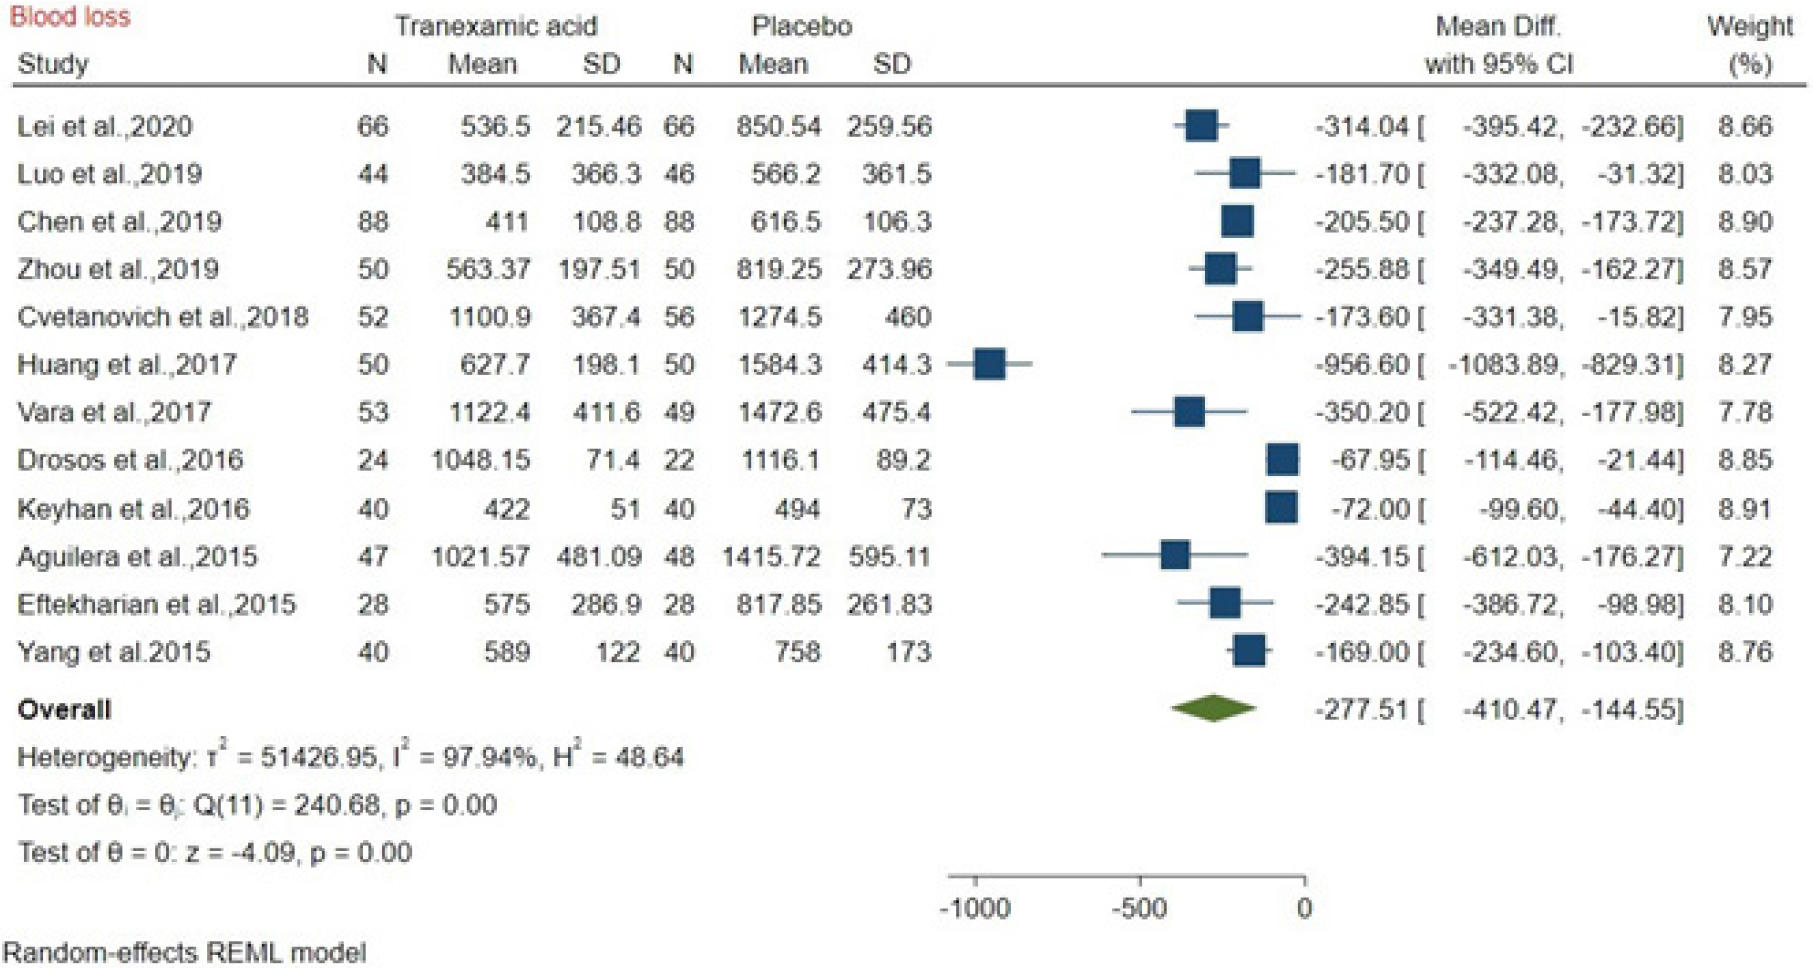
Figure 6 Forest plot showed mean difference (95% confidence interval) for blood loss between tranexamic acid and placebo in bone surgery.
CI: Confidence interval; SD: Standard deviation.
- Citation: Xu JW, Qiang H, Li TL, Wang Y, Wei XX, Li F. Efficacy of topical vs intravenous tranexamic acid in reducing blood loss and promoting wound healing in bone surgery: A systematic review and meta-analysis. World J Clin Cases 2021; 9(17): 4210-4220
- URL: https://www.wjgnet.com/2307-8960/full/v9/i17/4210.htm
- DOI: https://dx.doi.org/10.12998/wjcc.v9.i17.4210


