Copyright
©The Author(s) 2021.
World J Clin Cases. Jun 16, 2021; 9(17): 4143-4158
Published online Jun 16, 2021. doi: 10.12998/wjcc.v9.i17.4143
Published online Jun 16, 2021. doi: 10.12998/wjcc.v9.i17.4143
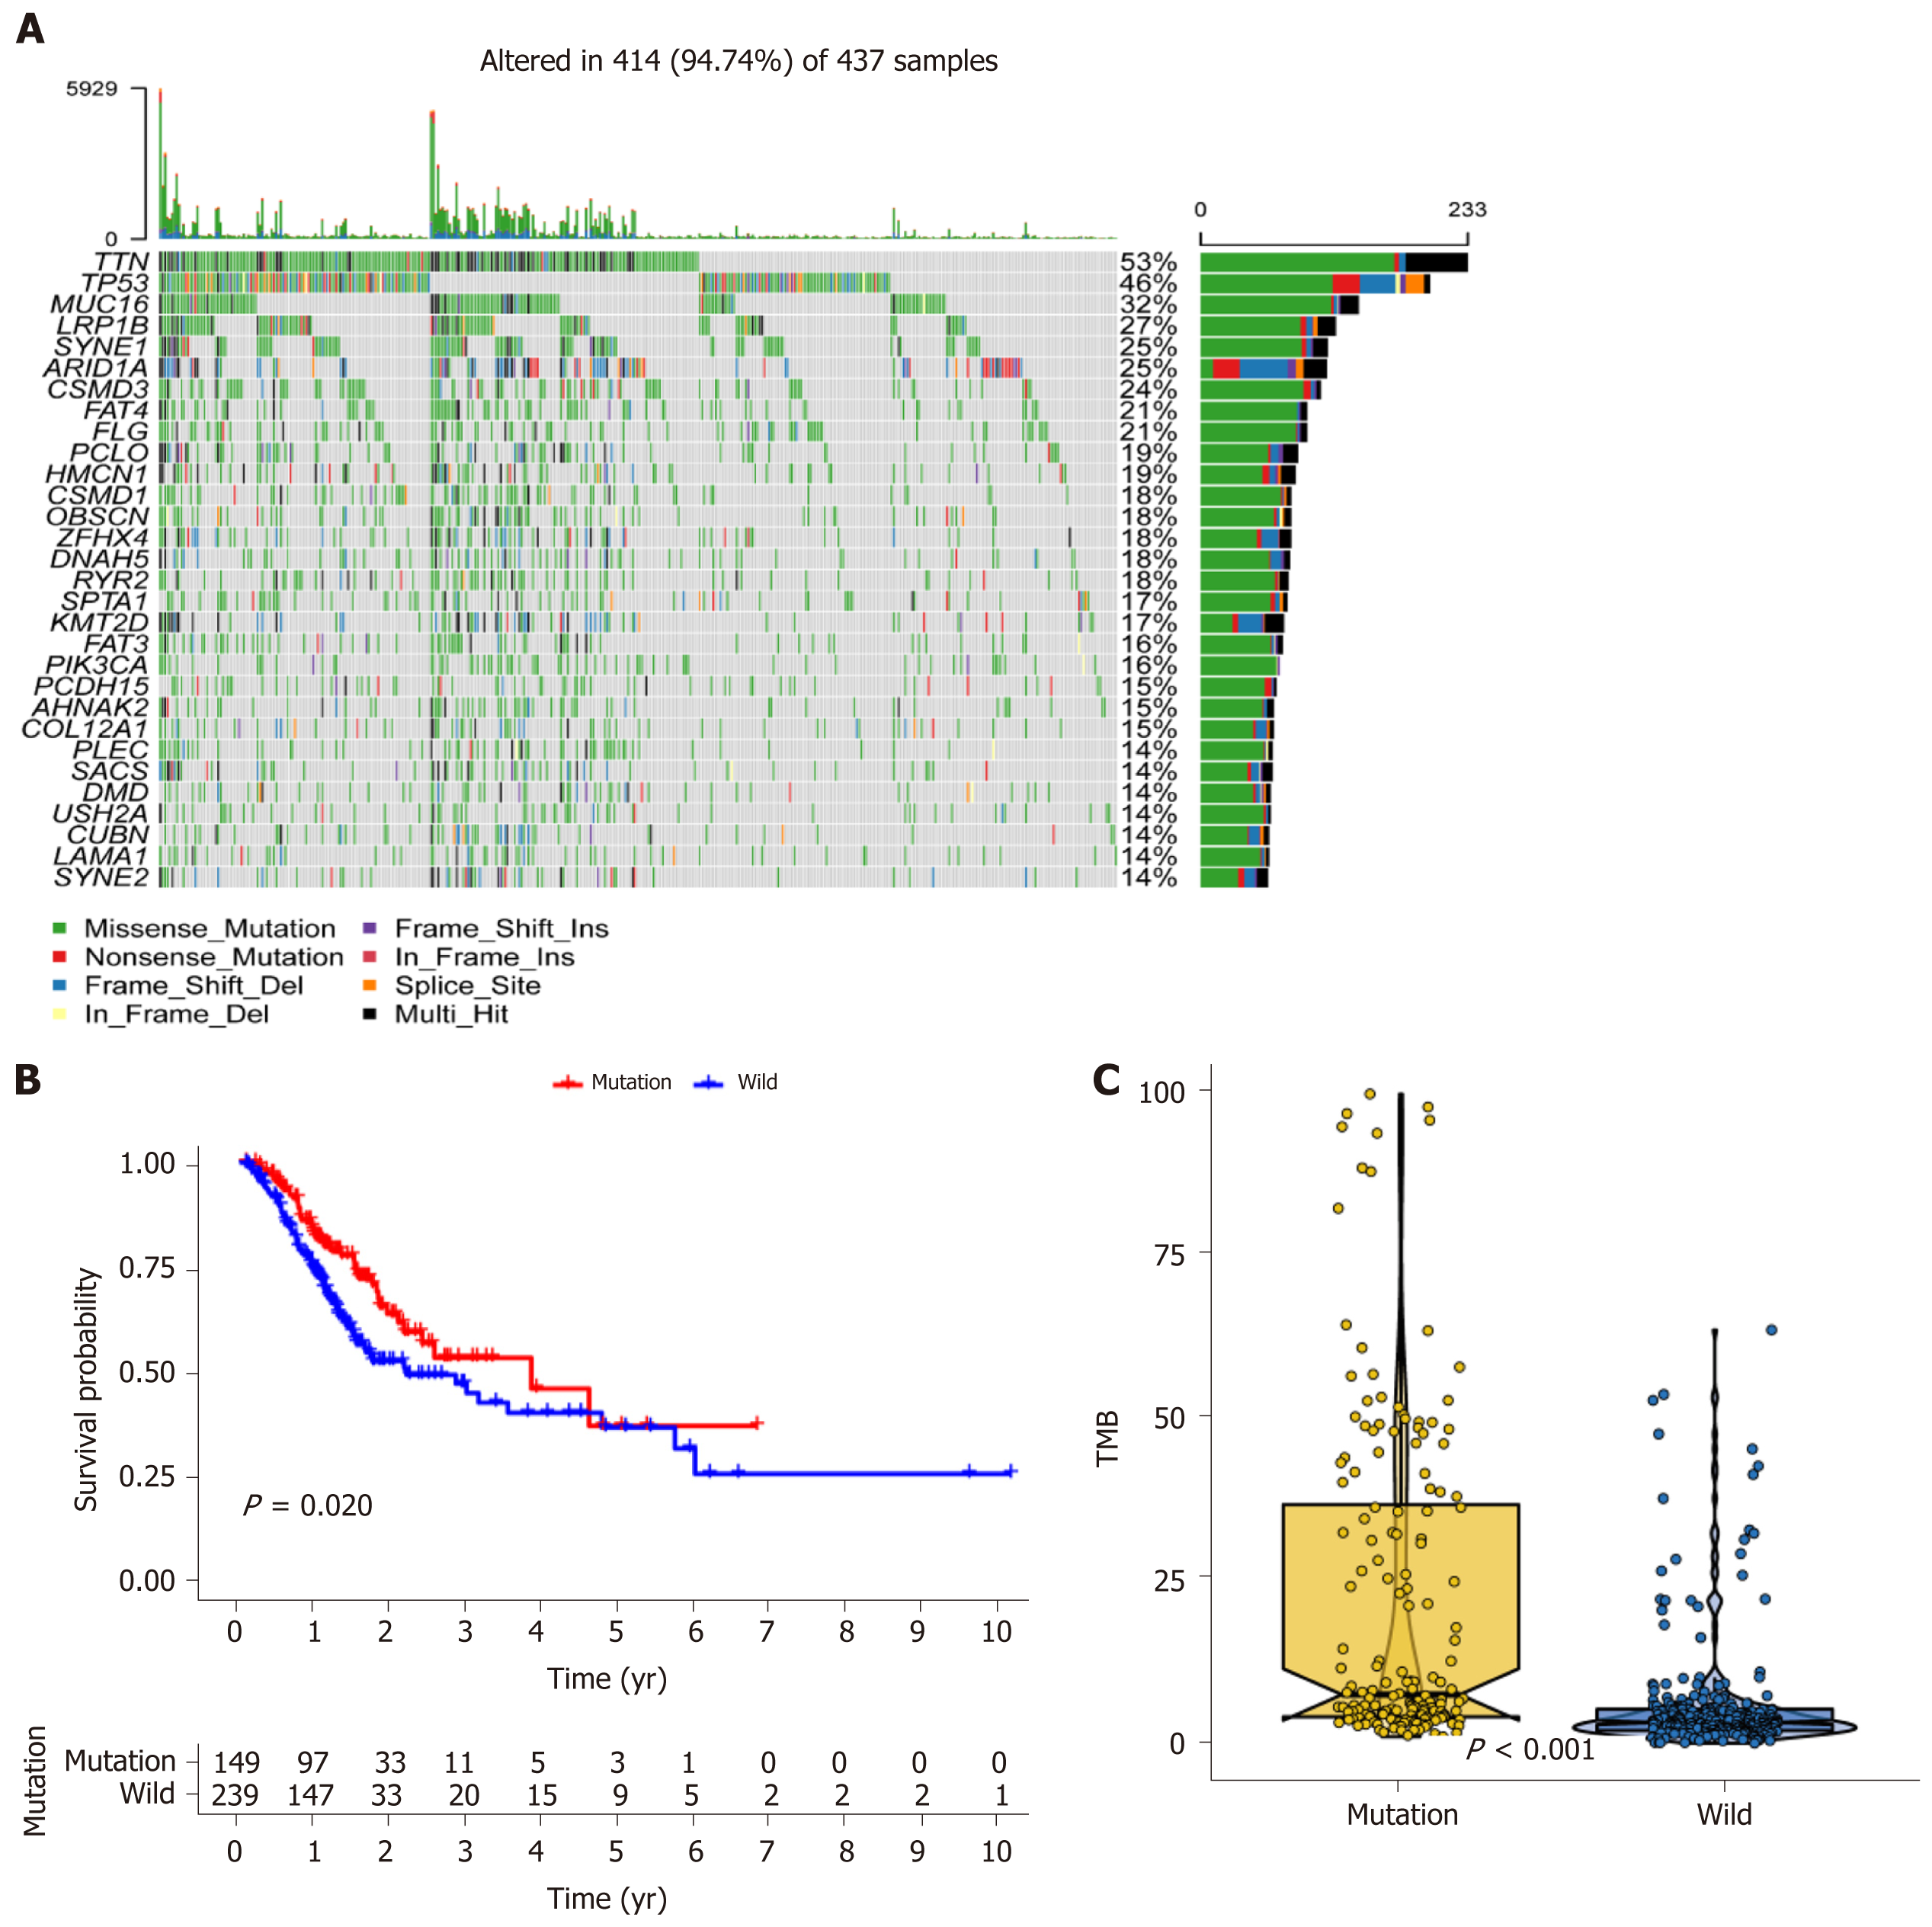
Figure 1 MUC16 mutations in relation to prognosis and tumor mutation burden.
A: Waterfall plot showing the mutation information for each gene. Each color represents a type of mutation; B: Kaplan-Meier survival analysis was used to assess prognosis, with red representing the mutation group and blue representing the wild-type group; C: Boxplot showing the tumor mutation burden scores in the two groups. TMB: Tumor mutation burden.
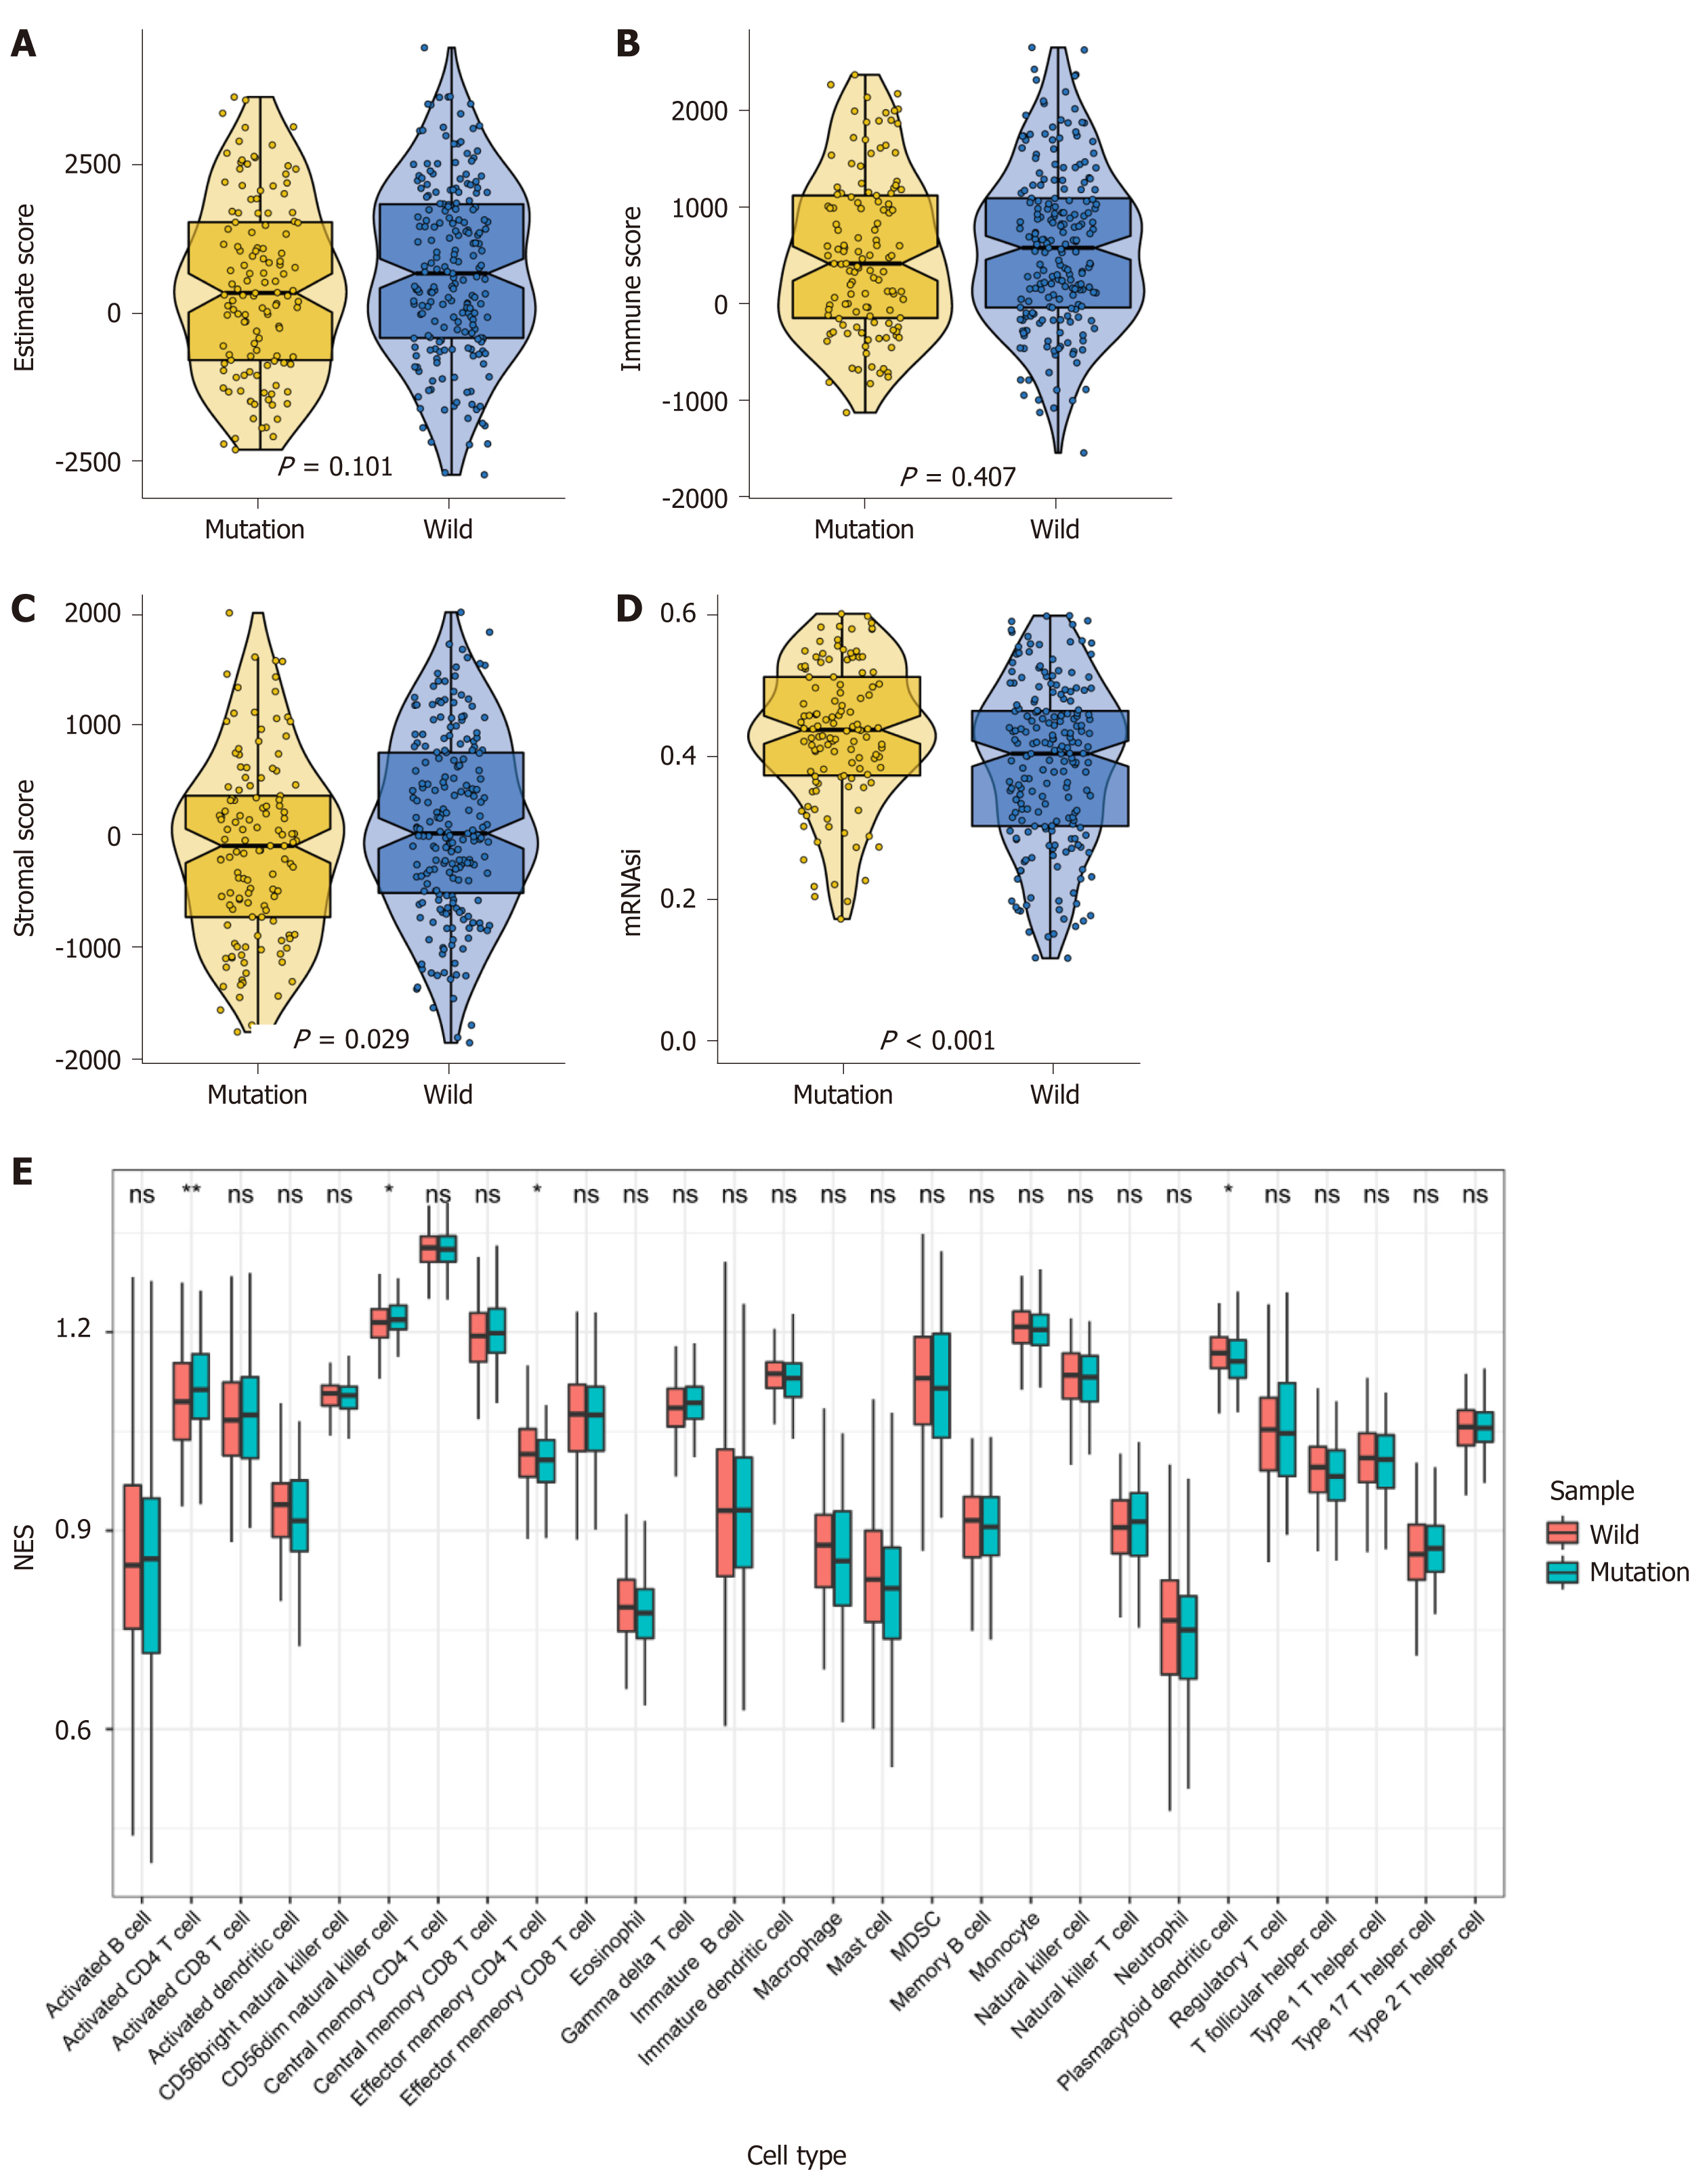
Figure 2 MUC16 mutations and the tumor microenvironment.
A-C: Violin plot showing tumor purity, immune score, and stromal score, respectively; D: Boxplot showing the difference in cancer stem cell index between the two groups; E: The infiltration of 28 immune cells in tumors was assessed using single-sample gene set enrichment analysis, red represents the mutation group and blue represents the wild-type group.
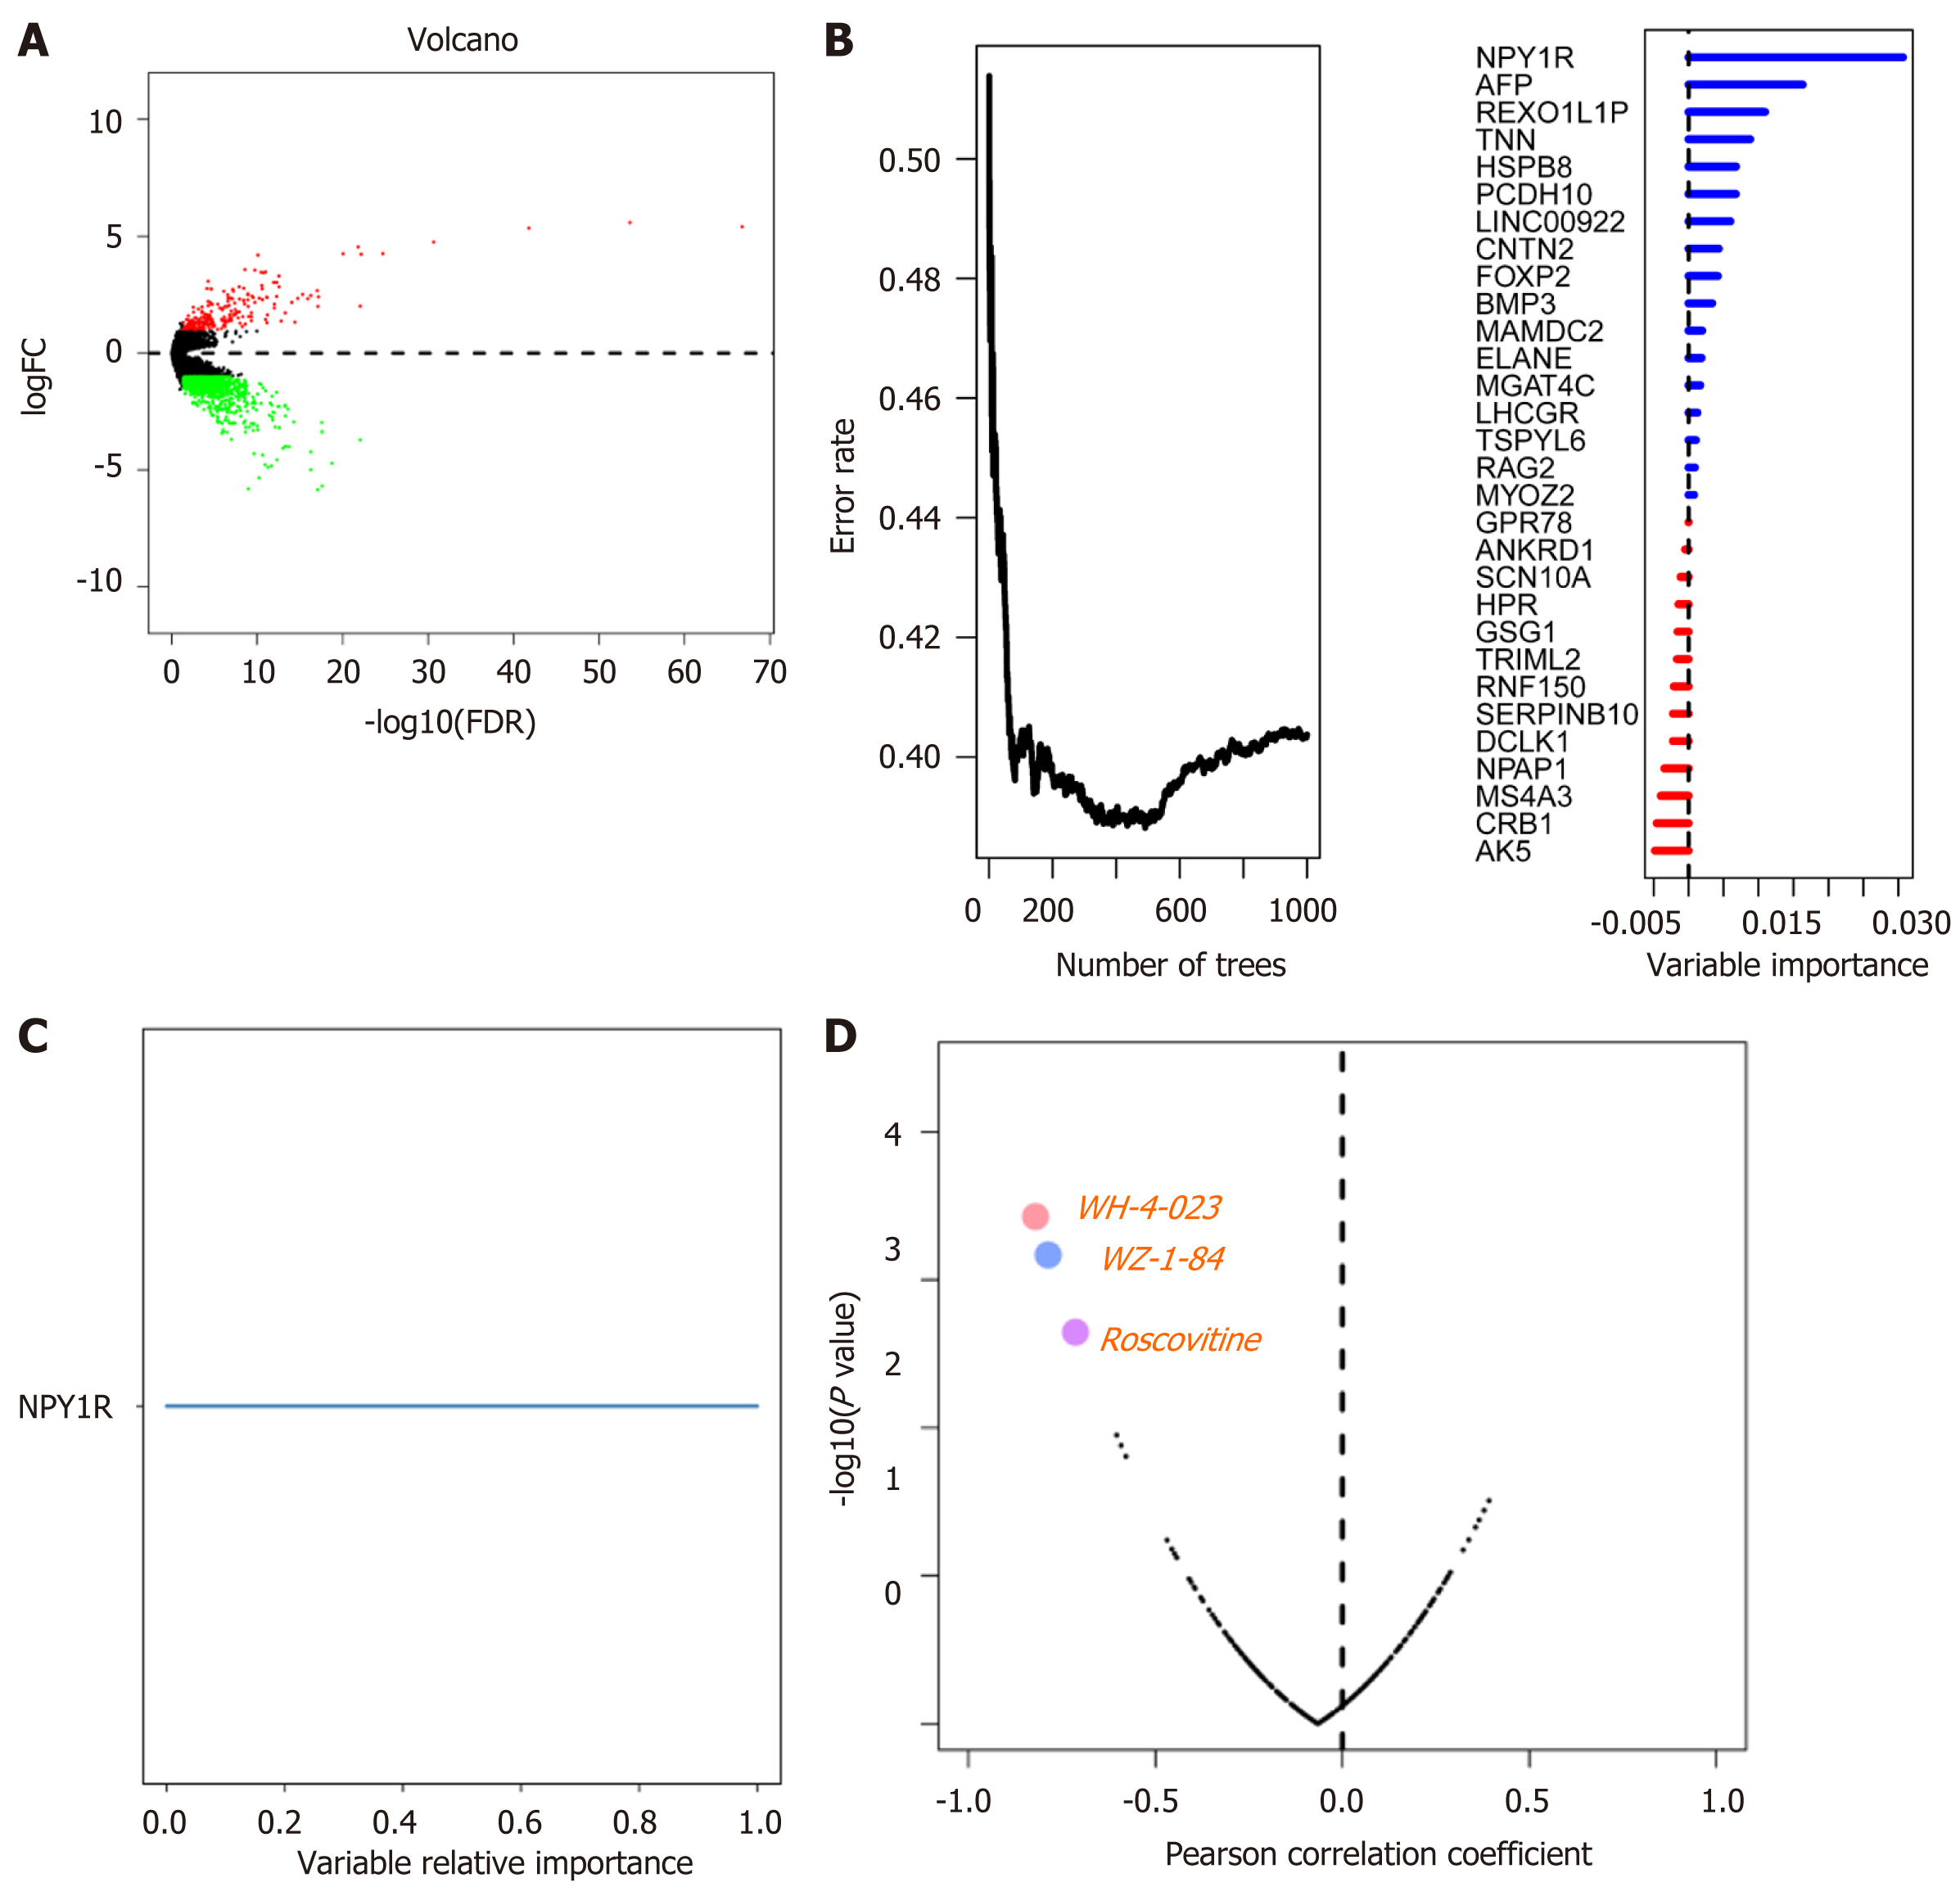
Figure 3 Differentially expressed genes and drug sensitivity.
A: Volcano plot showing differentially expressed genes between the MUC16 mutation group and the MUC16 wild-type group, up-regulated genes are in red, down-regulated genes are in green, and black represents genes that are not differentially expressed; B: Error rate for the data as a function of the classification tree and out-of-bag importance values for the predictors; C: Genes of relative importance greater than 0.65; D: The plot showing the correlation between NPY1R expression and the sensitivity of gastric cancer cell lines to various drugs, with the three most negatively correlated drugs being WH-4-023, WZ-184, and Roscovitine. NPY1R: Neuropeptide Y receptor Y1.
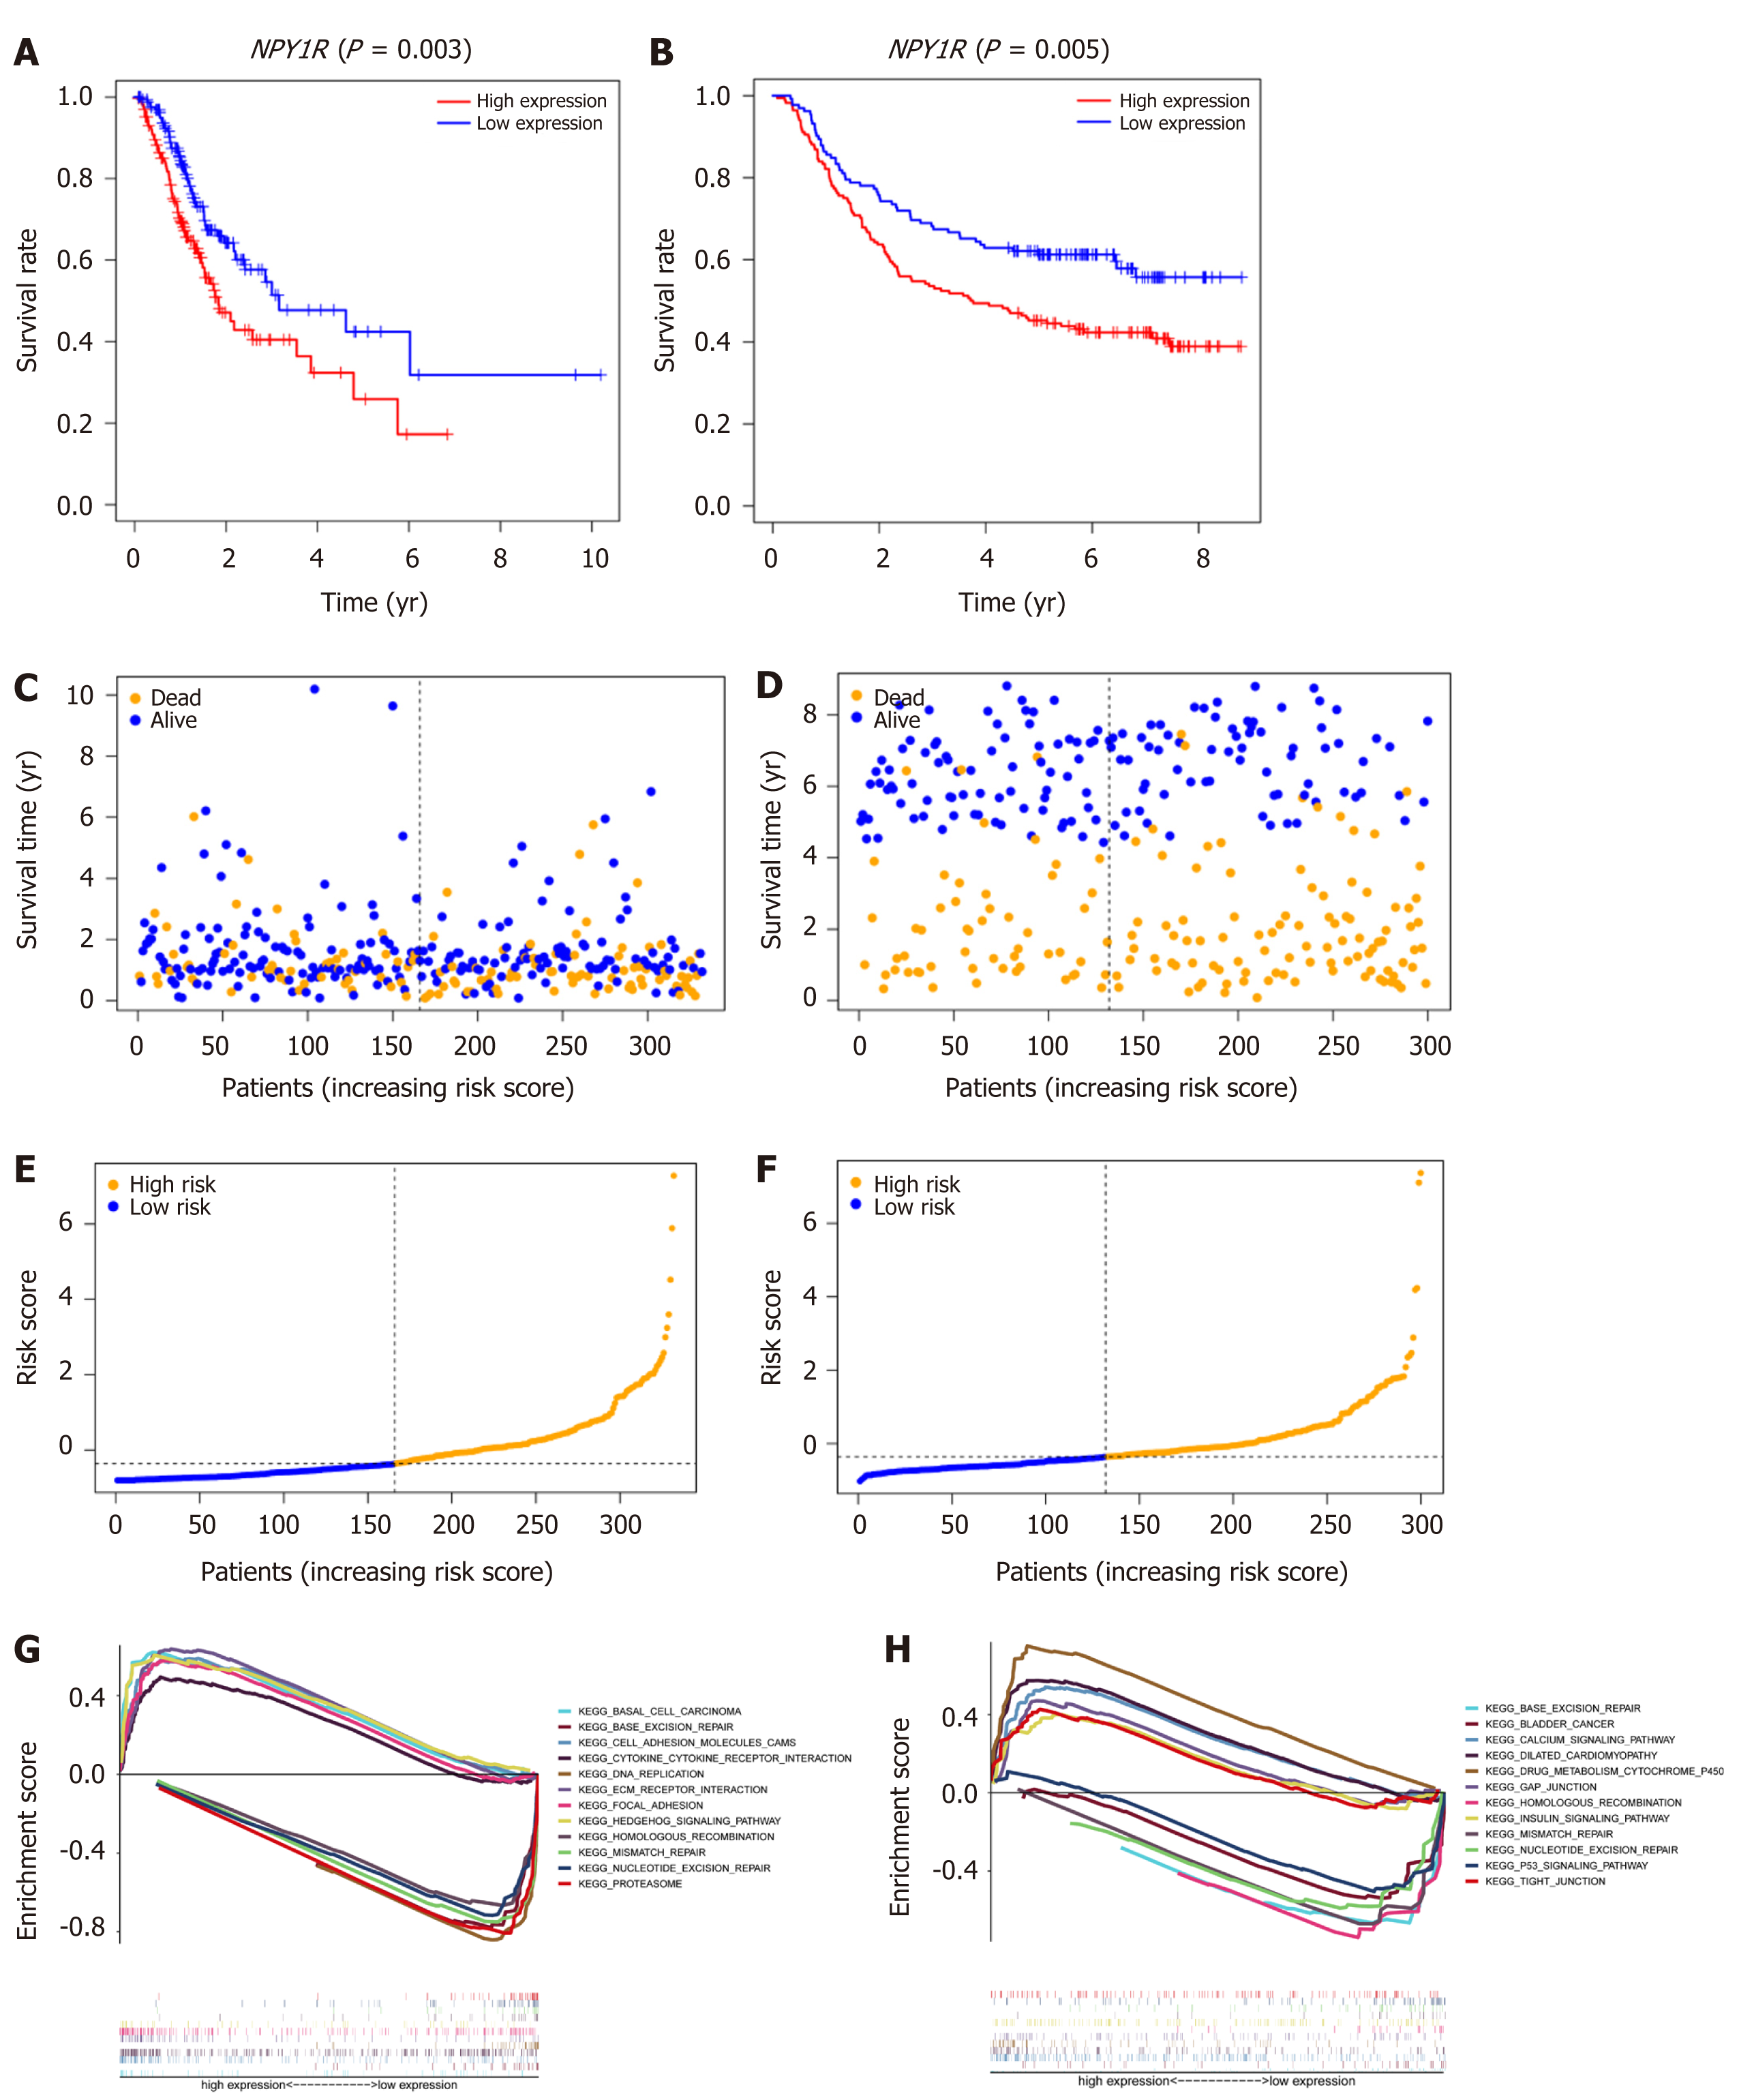
Figure 4 Prognosis and gene set enrichment analysis.
A and B: Kaplan-Meier survival analysis for The Cancer Genome Atlas (TCGA) and Gene Expression Omnibus (GEO) cohorts, respectively; C and D: Overall survival time distribution in the TCGA cohort and GEO cohort; E and F: Distribution of risk scores in TCGA and GEO cohorts; G and H: Gene set enrichment analysis in the TCGA and GEO cohorts, respectively. The plots on the left are the TCGA cohort and the plots on the right are the GEO cohort. NPY1R: Neuropeptide Y receptor Y1.
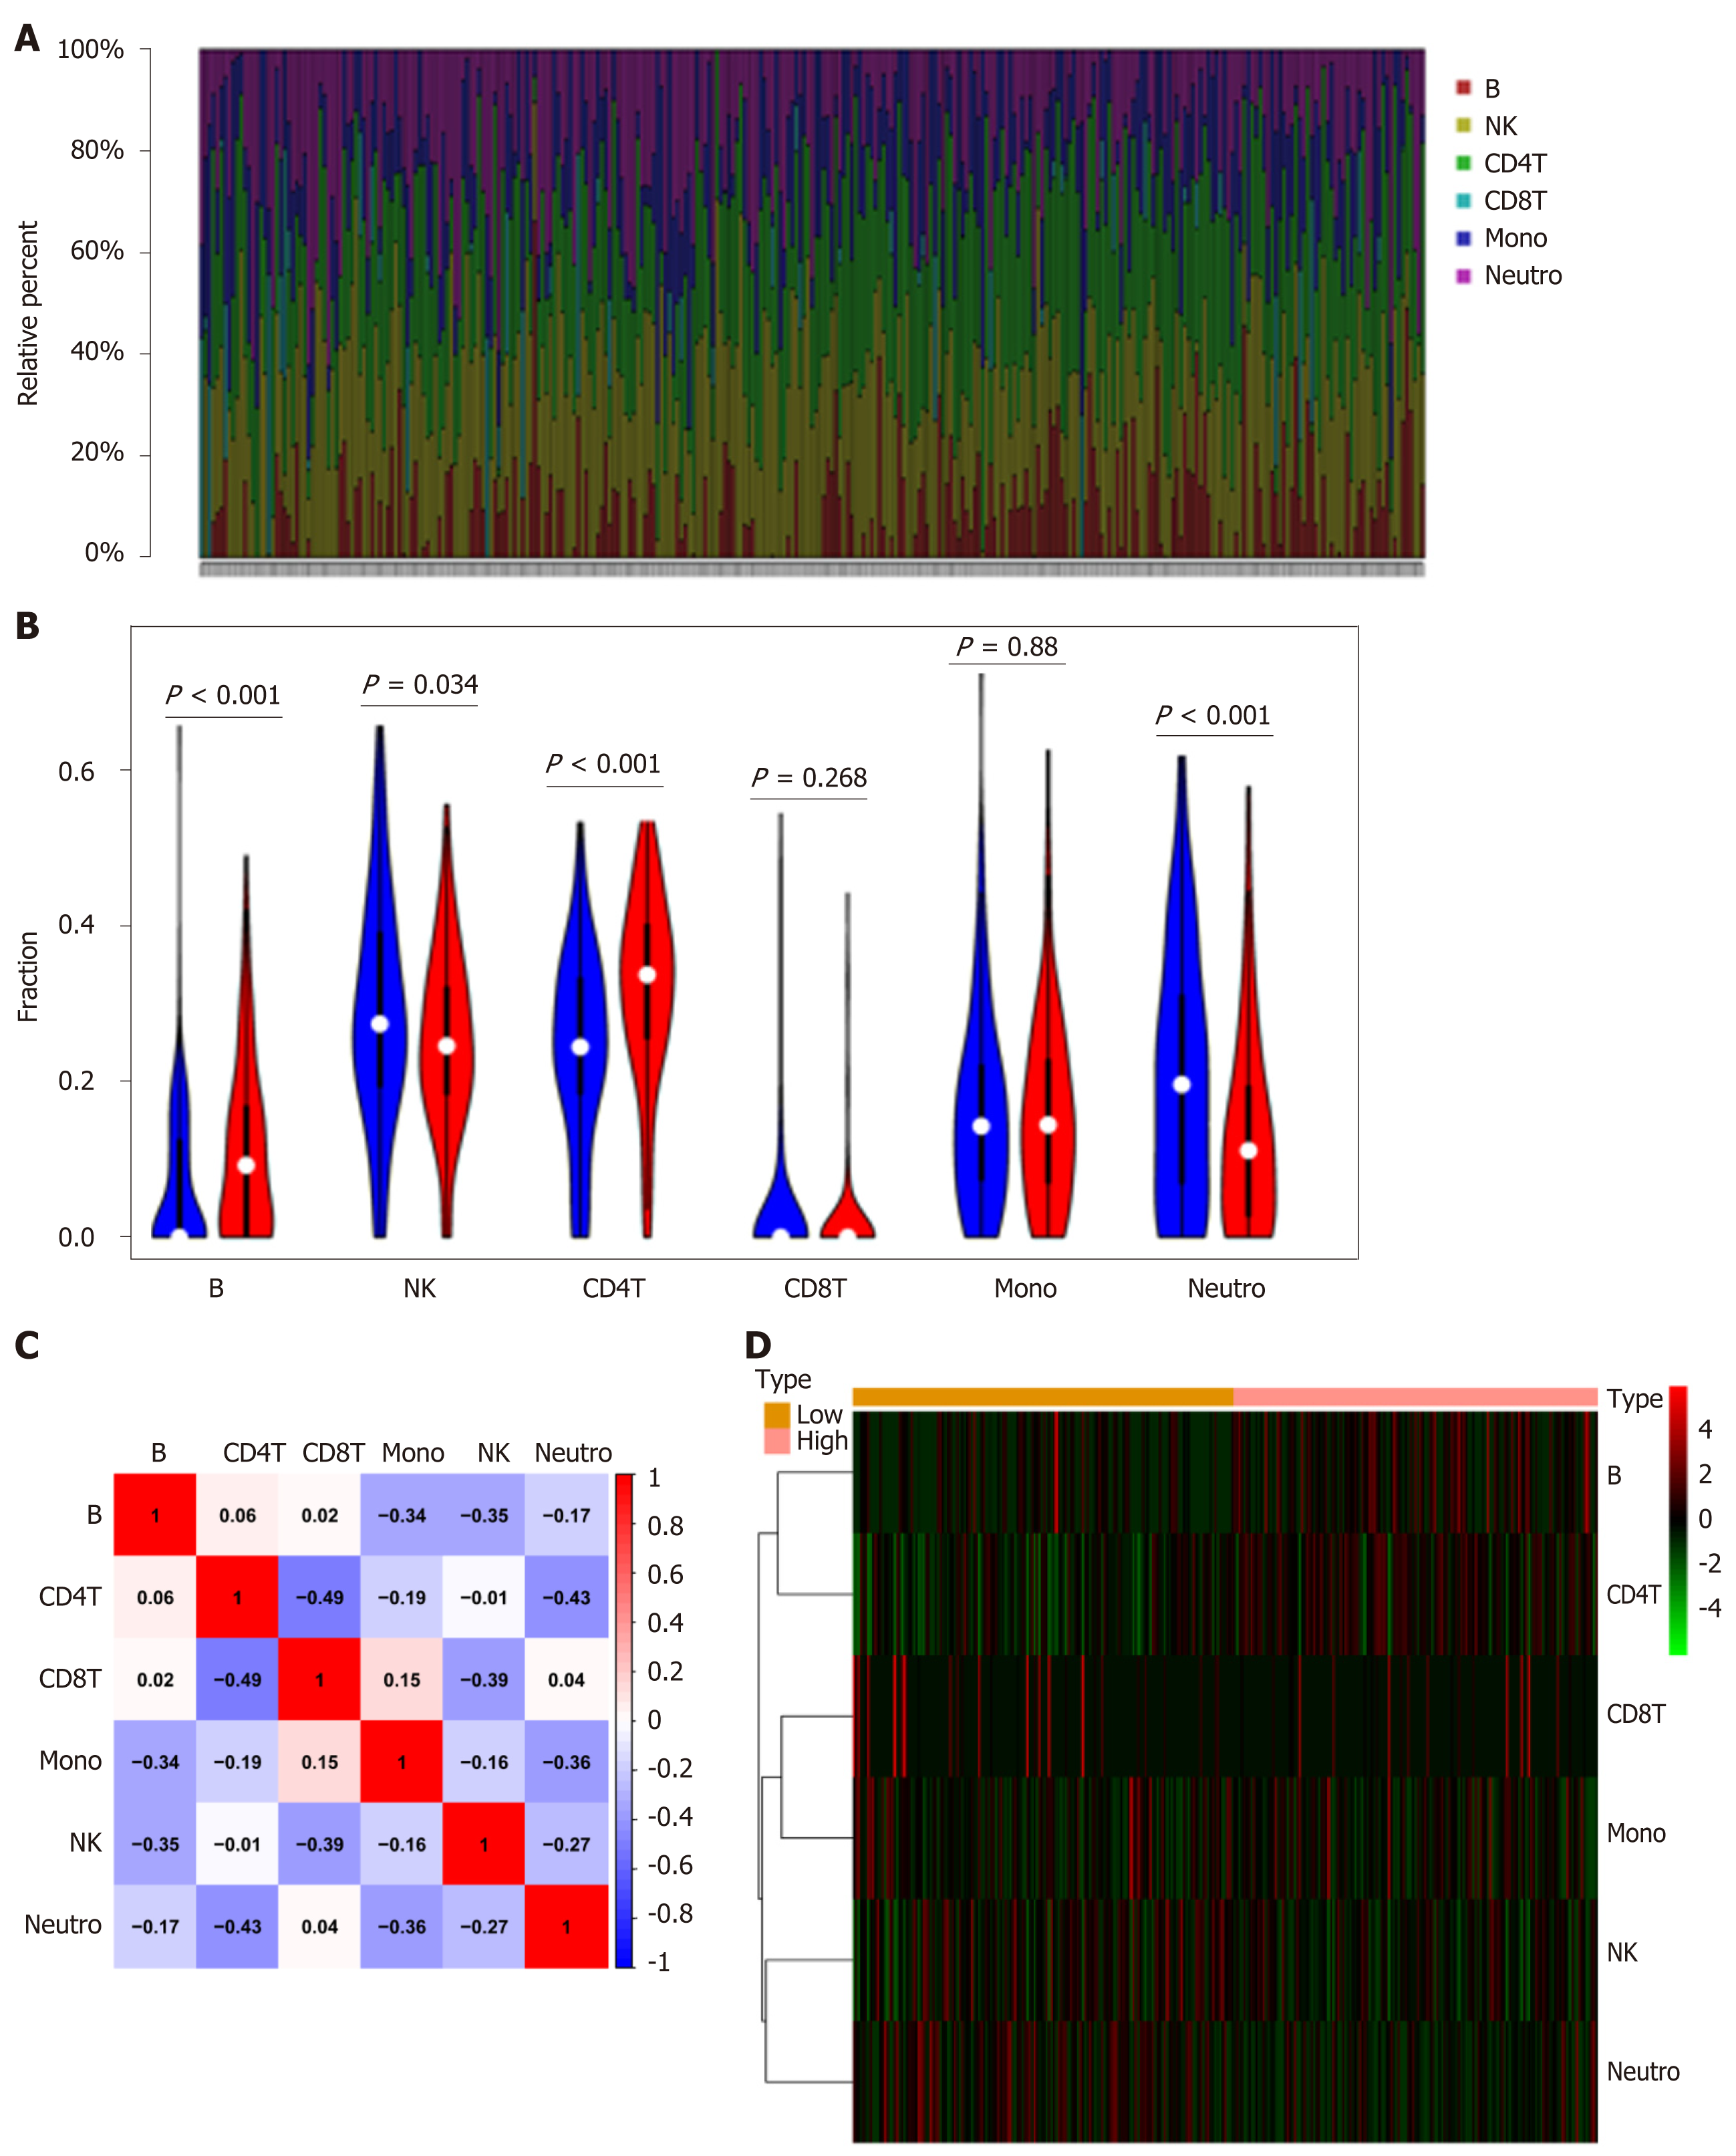
Figure 5 NPY1R and immune infiltration.
A: The 6 immune cell types in each sample are shown in bar plots; B: The violin plot showing the differences in 6 immune cell types between the two groups; C: The correlation matrix demonstrated the correlations of 6 immune cell types; D: Heatmap revealing the distribution of 6 immune cell types in the two groups. NK: Natural killer; Mono: Monoclonal; Neutro: Neutrophil.
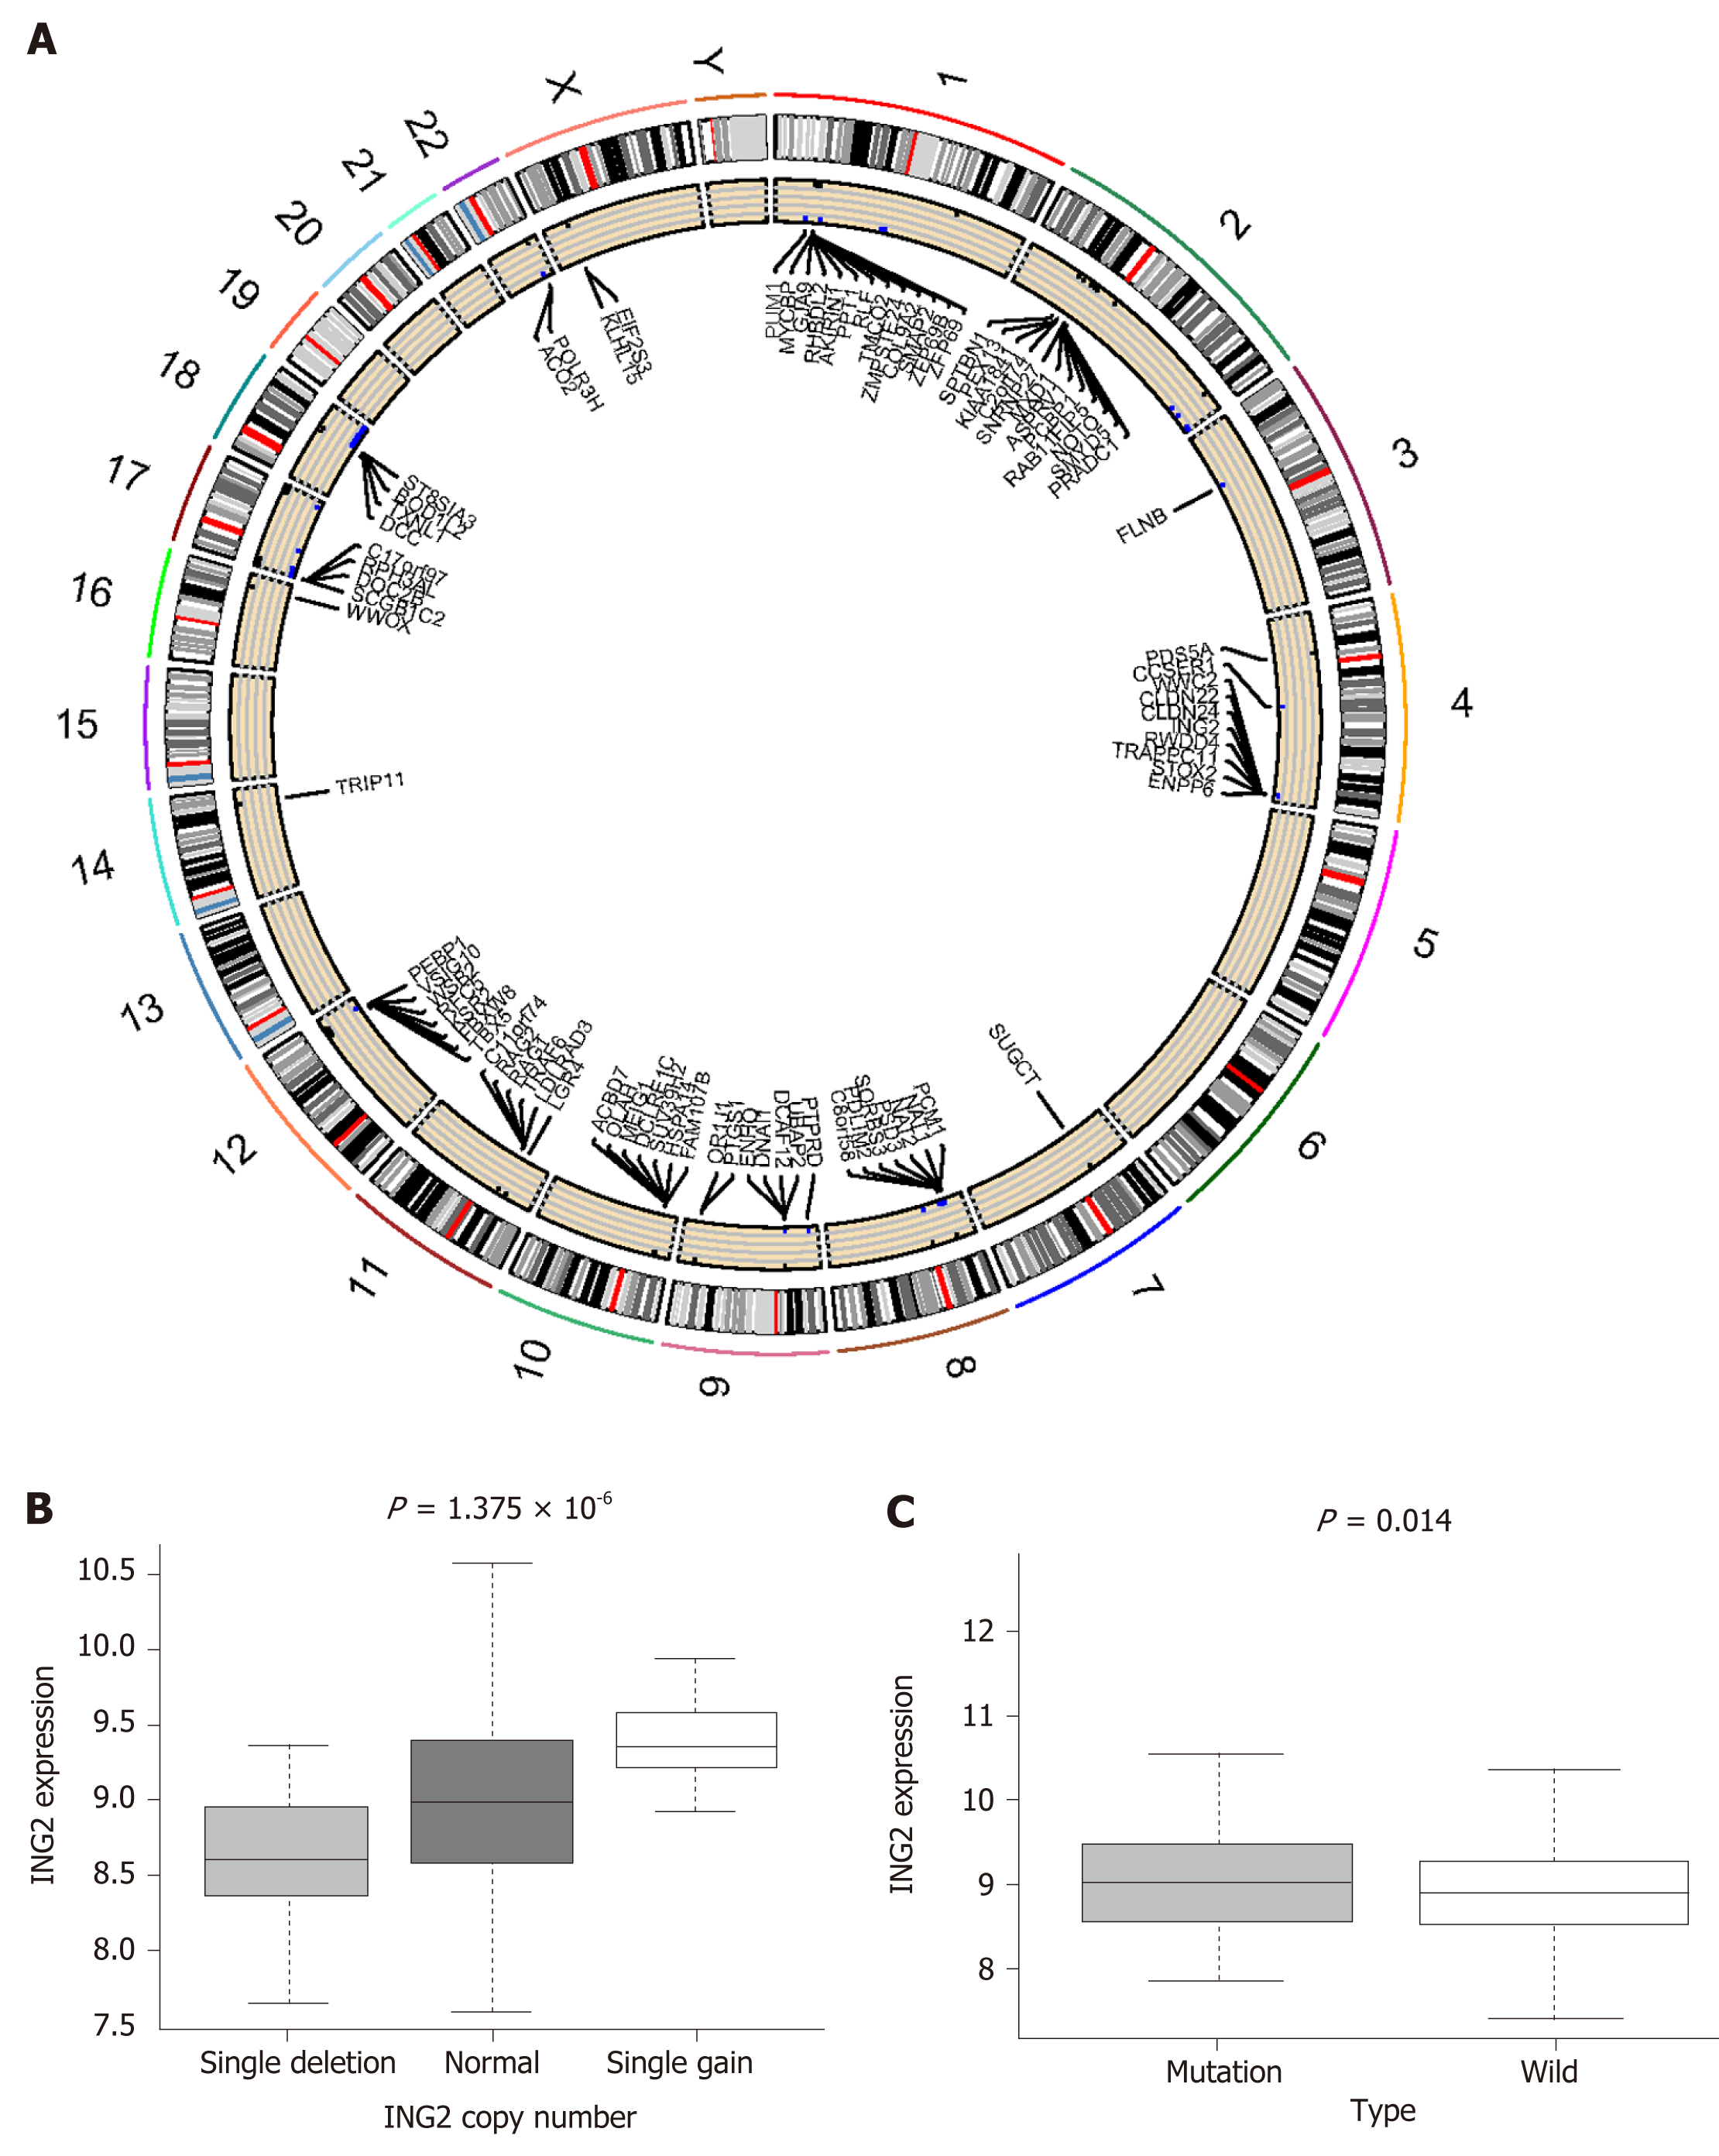
Figure 6 MUC16 mutations and copy number variations.
A: The circle plot shows the location of differential copy number variations in the chromosome; B and C: The left boxplot shows the relationship between ING2 (inhibitor of growth gene 2) gain and deletion and the mRNA expression, the right boxplot shows the differential expression of ING2 in the MUC16 mutation and wild-type groups. ING2: Inhibitor of growth gene 2.
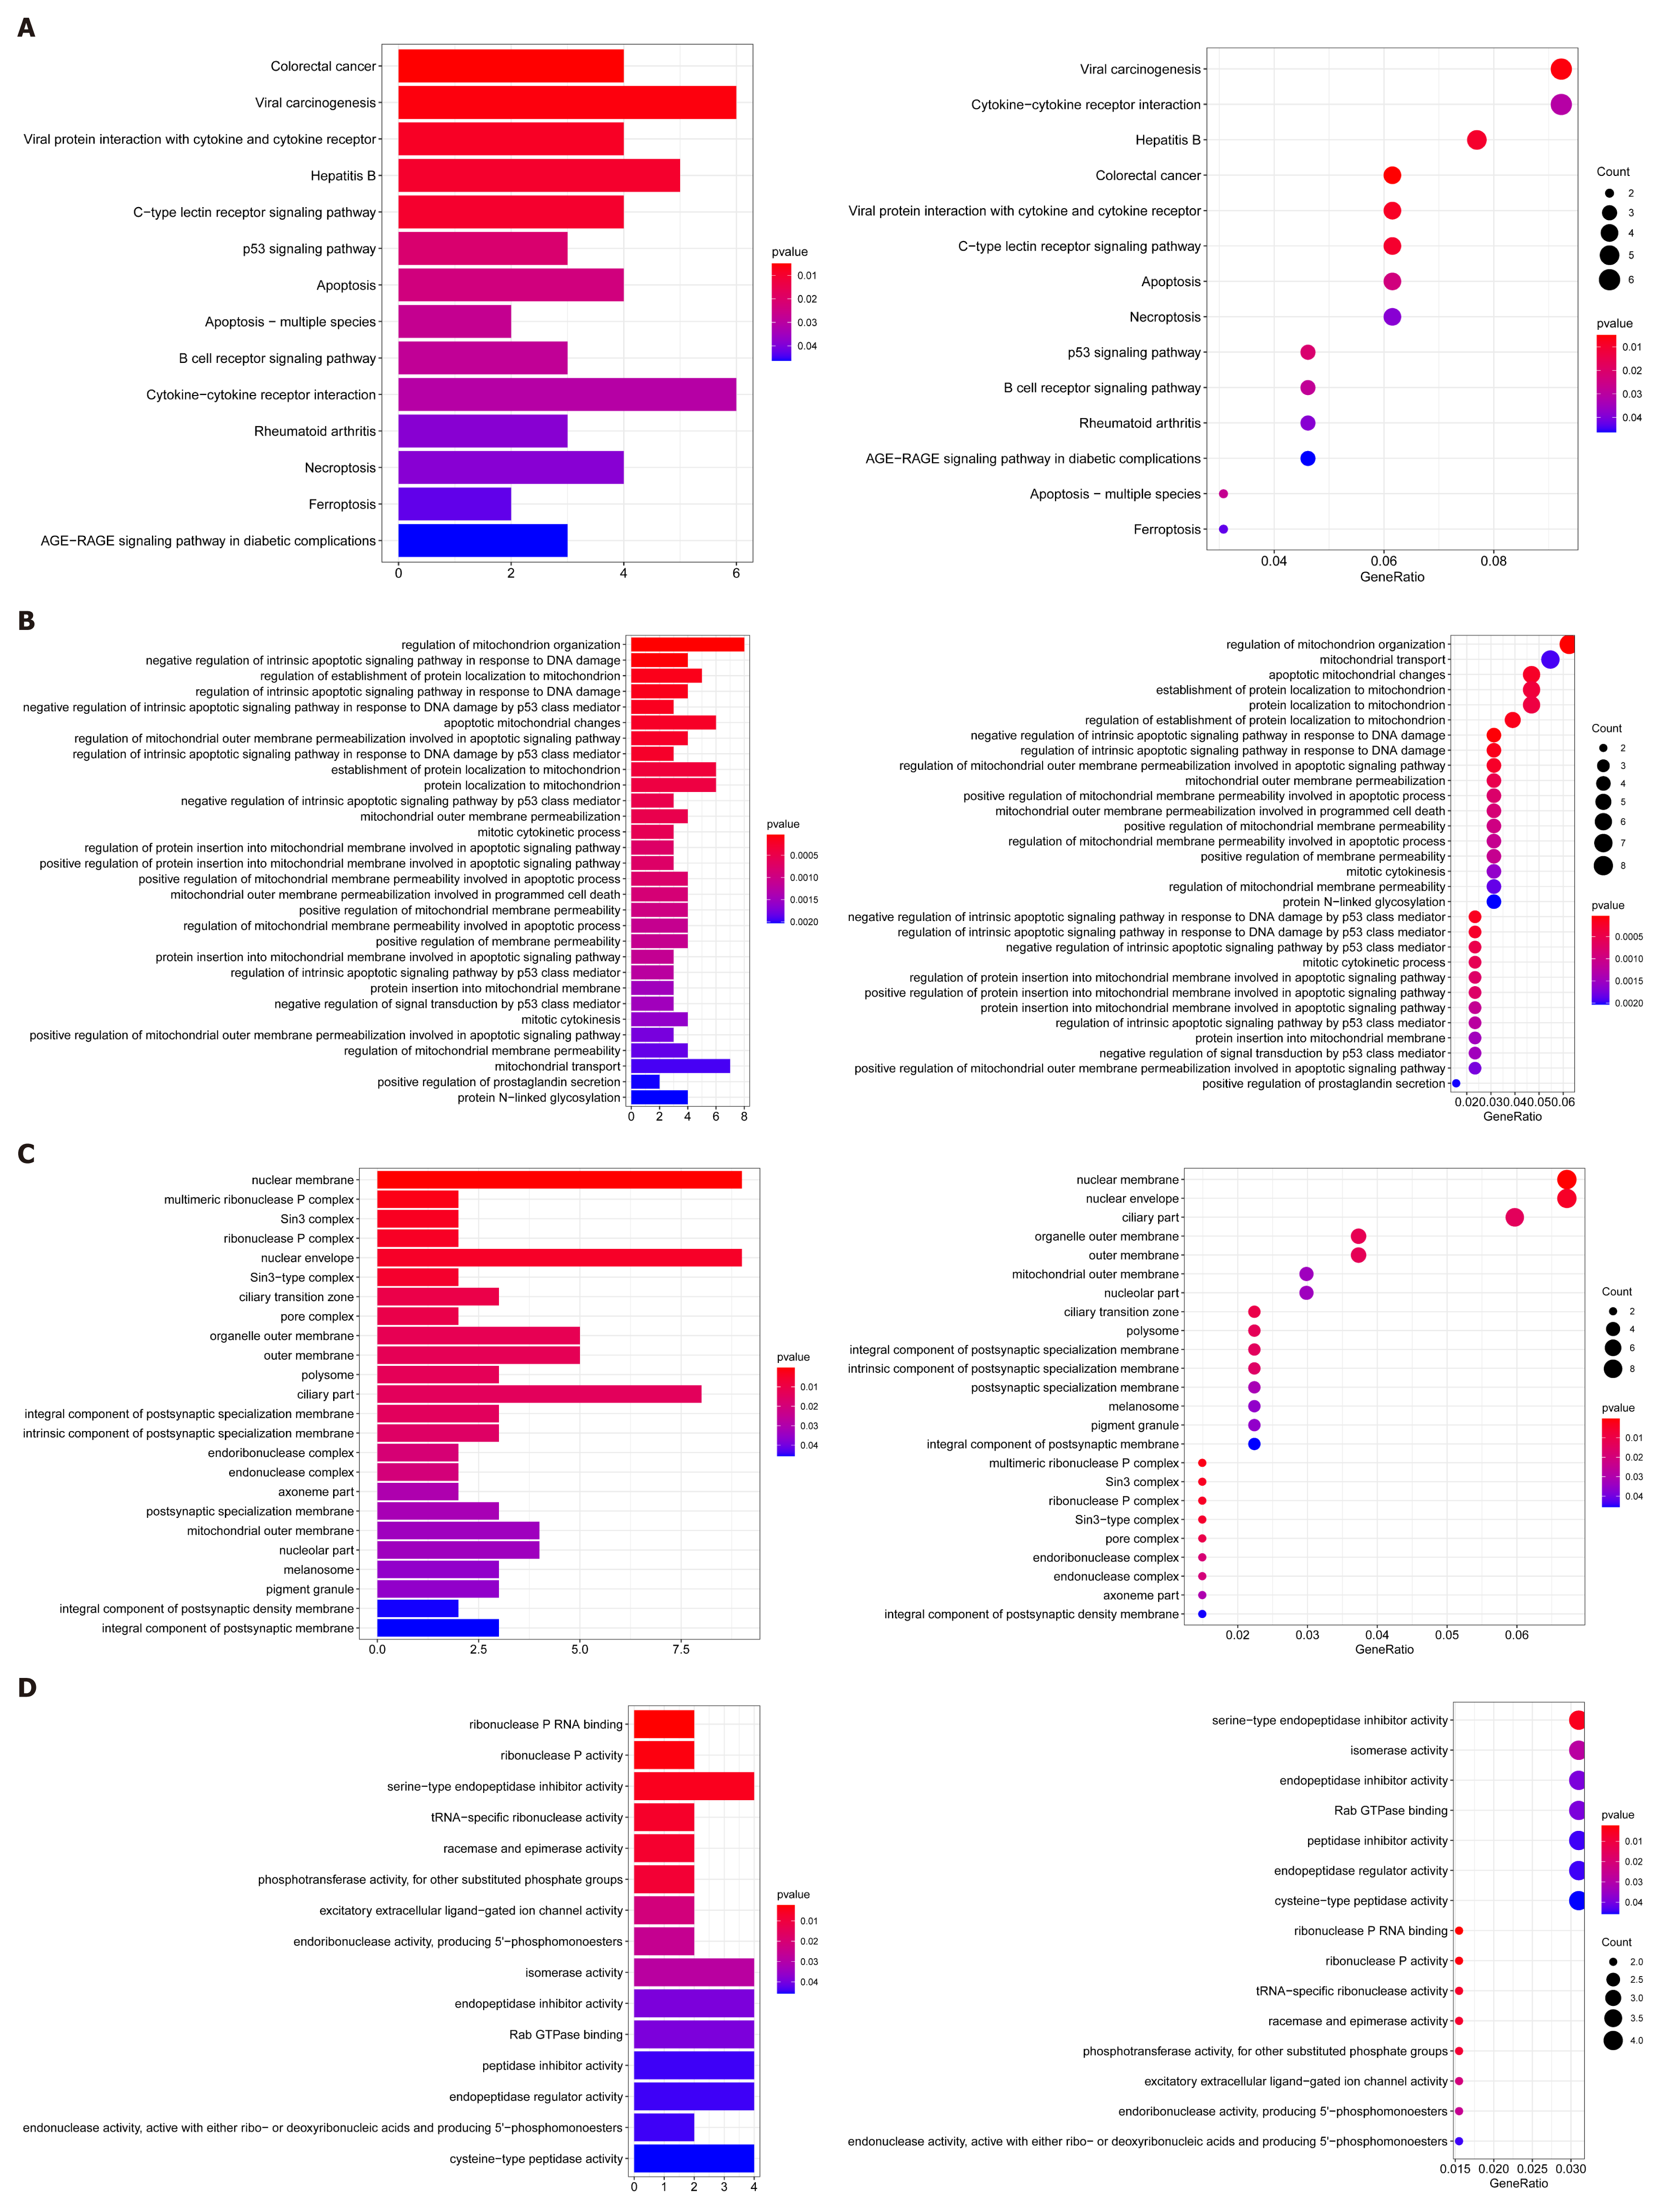
Figure 7 Gene set enrichment analysis.
A: Kyoto Encyclopedia of Genes and Genomes enrichment results of the differential copy number variations; B-D: Gene Ontology enrichment results of the differential copy number variations.
- Citation: Huang YJ, Cao ZF, Wang J, Yang J, Wei YJ, Tang YC, Cheng YX, Zhou J, Zhang ZX. Why MUC16 mutations lead to a better prognosis: A study based on The Cancer Genome Atlas gastric cancer cohort. World J Clin Cases 2021; 9(17): 4143-4158
- URL: https://www.wjgnet.com/2307-8960/full/v9/i17/4143.htm
- DOI: https://dx.doi.org/10.12998/wjcc.v9.i17.4143


