Copyright
©The Author(s) 2021.
World J Clin Cases. May 6, 2021; 9(13): 3102-3113
Published online May 6, 2021. doi: 10.12998/wjcc.v9.i13.3102
Published online May 6, 2021. doi: 10.12998/wjcc.v9.i13.3102
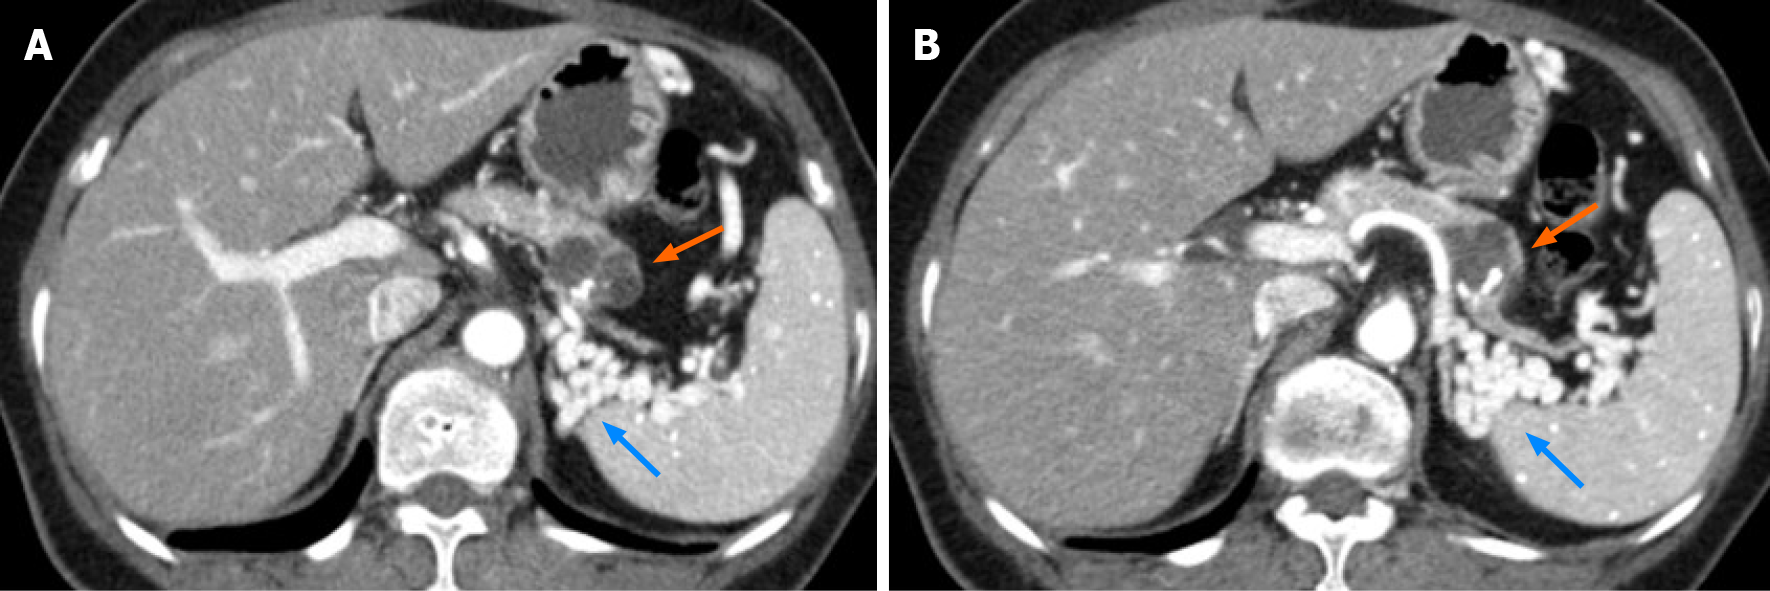
Figure 1 Initial computed tomography imaging of the abdomen.
A and B: Axial portal venous phase computed tomography images showing a 2.6 cm × 2.8 cm multilobulated cystic mass with an eccentric, relatively thick contrast-enhancing wall, and eccentric coarse calcification in the pancreatic body (orange arrows). No main pancreatic duct dilatation is observed. Upstream of the pancreatic parenchyma showed markedly atrophic changes, and the obliterated splenic vein was replaced with tortuous splenorenal collaterals (blue arrows).
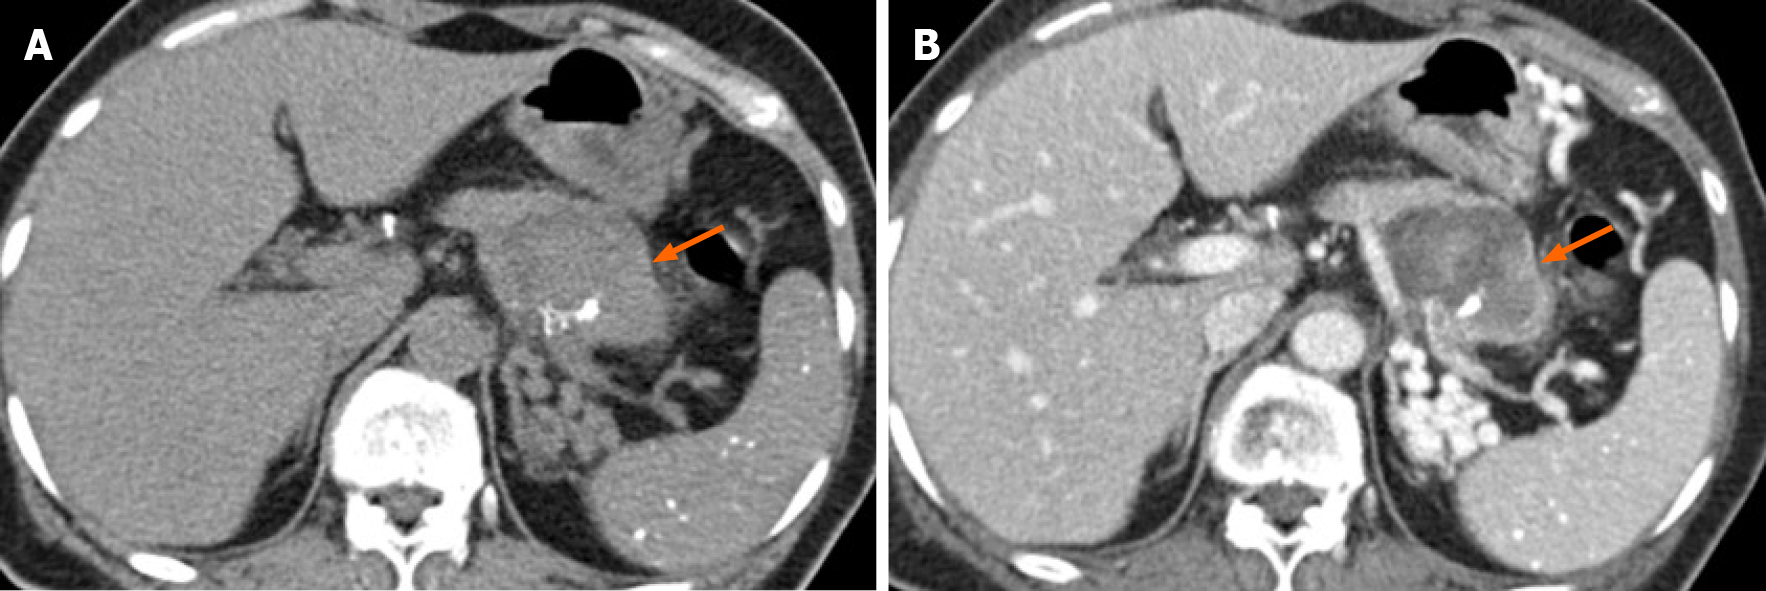
Figure 2 Follow-up computed tomography imaging 7 mo later.
A and B: A non-contrast image (A), and a portal venous phase image (B) showing a pancreatic cystic mass, 5.4 cm × 4 cm in size, involving the pancreatic tail with a large solid component (arrows) in the rapidly growing cystic lesion. A portal venous phase image showing heterogeneous enhancement of the solid part of the mass (B).
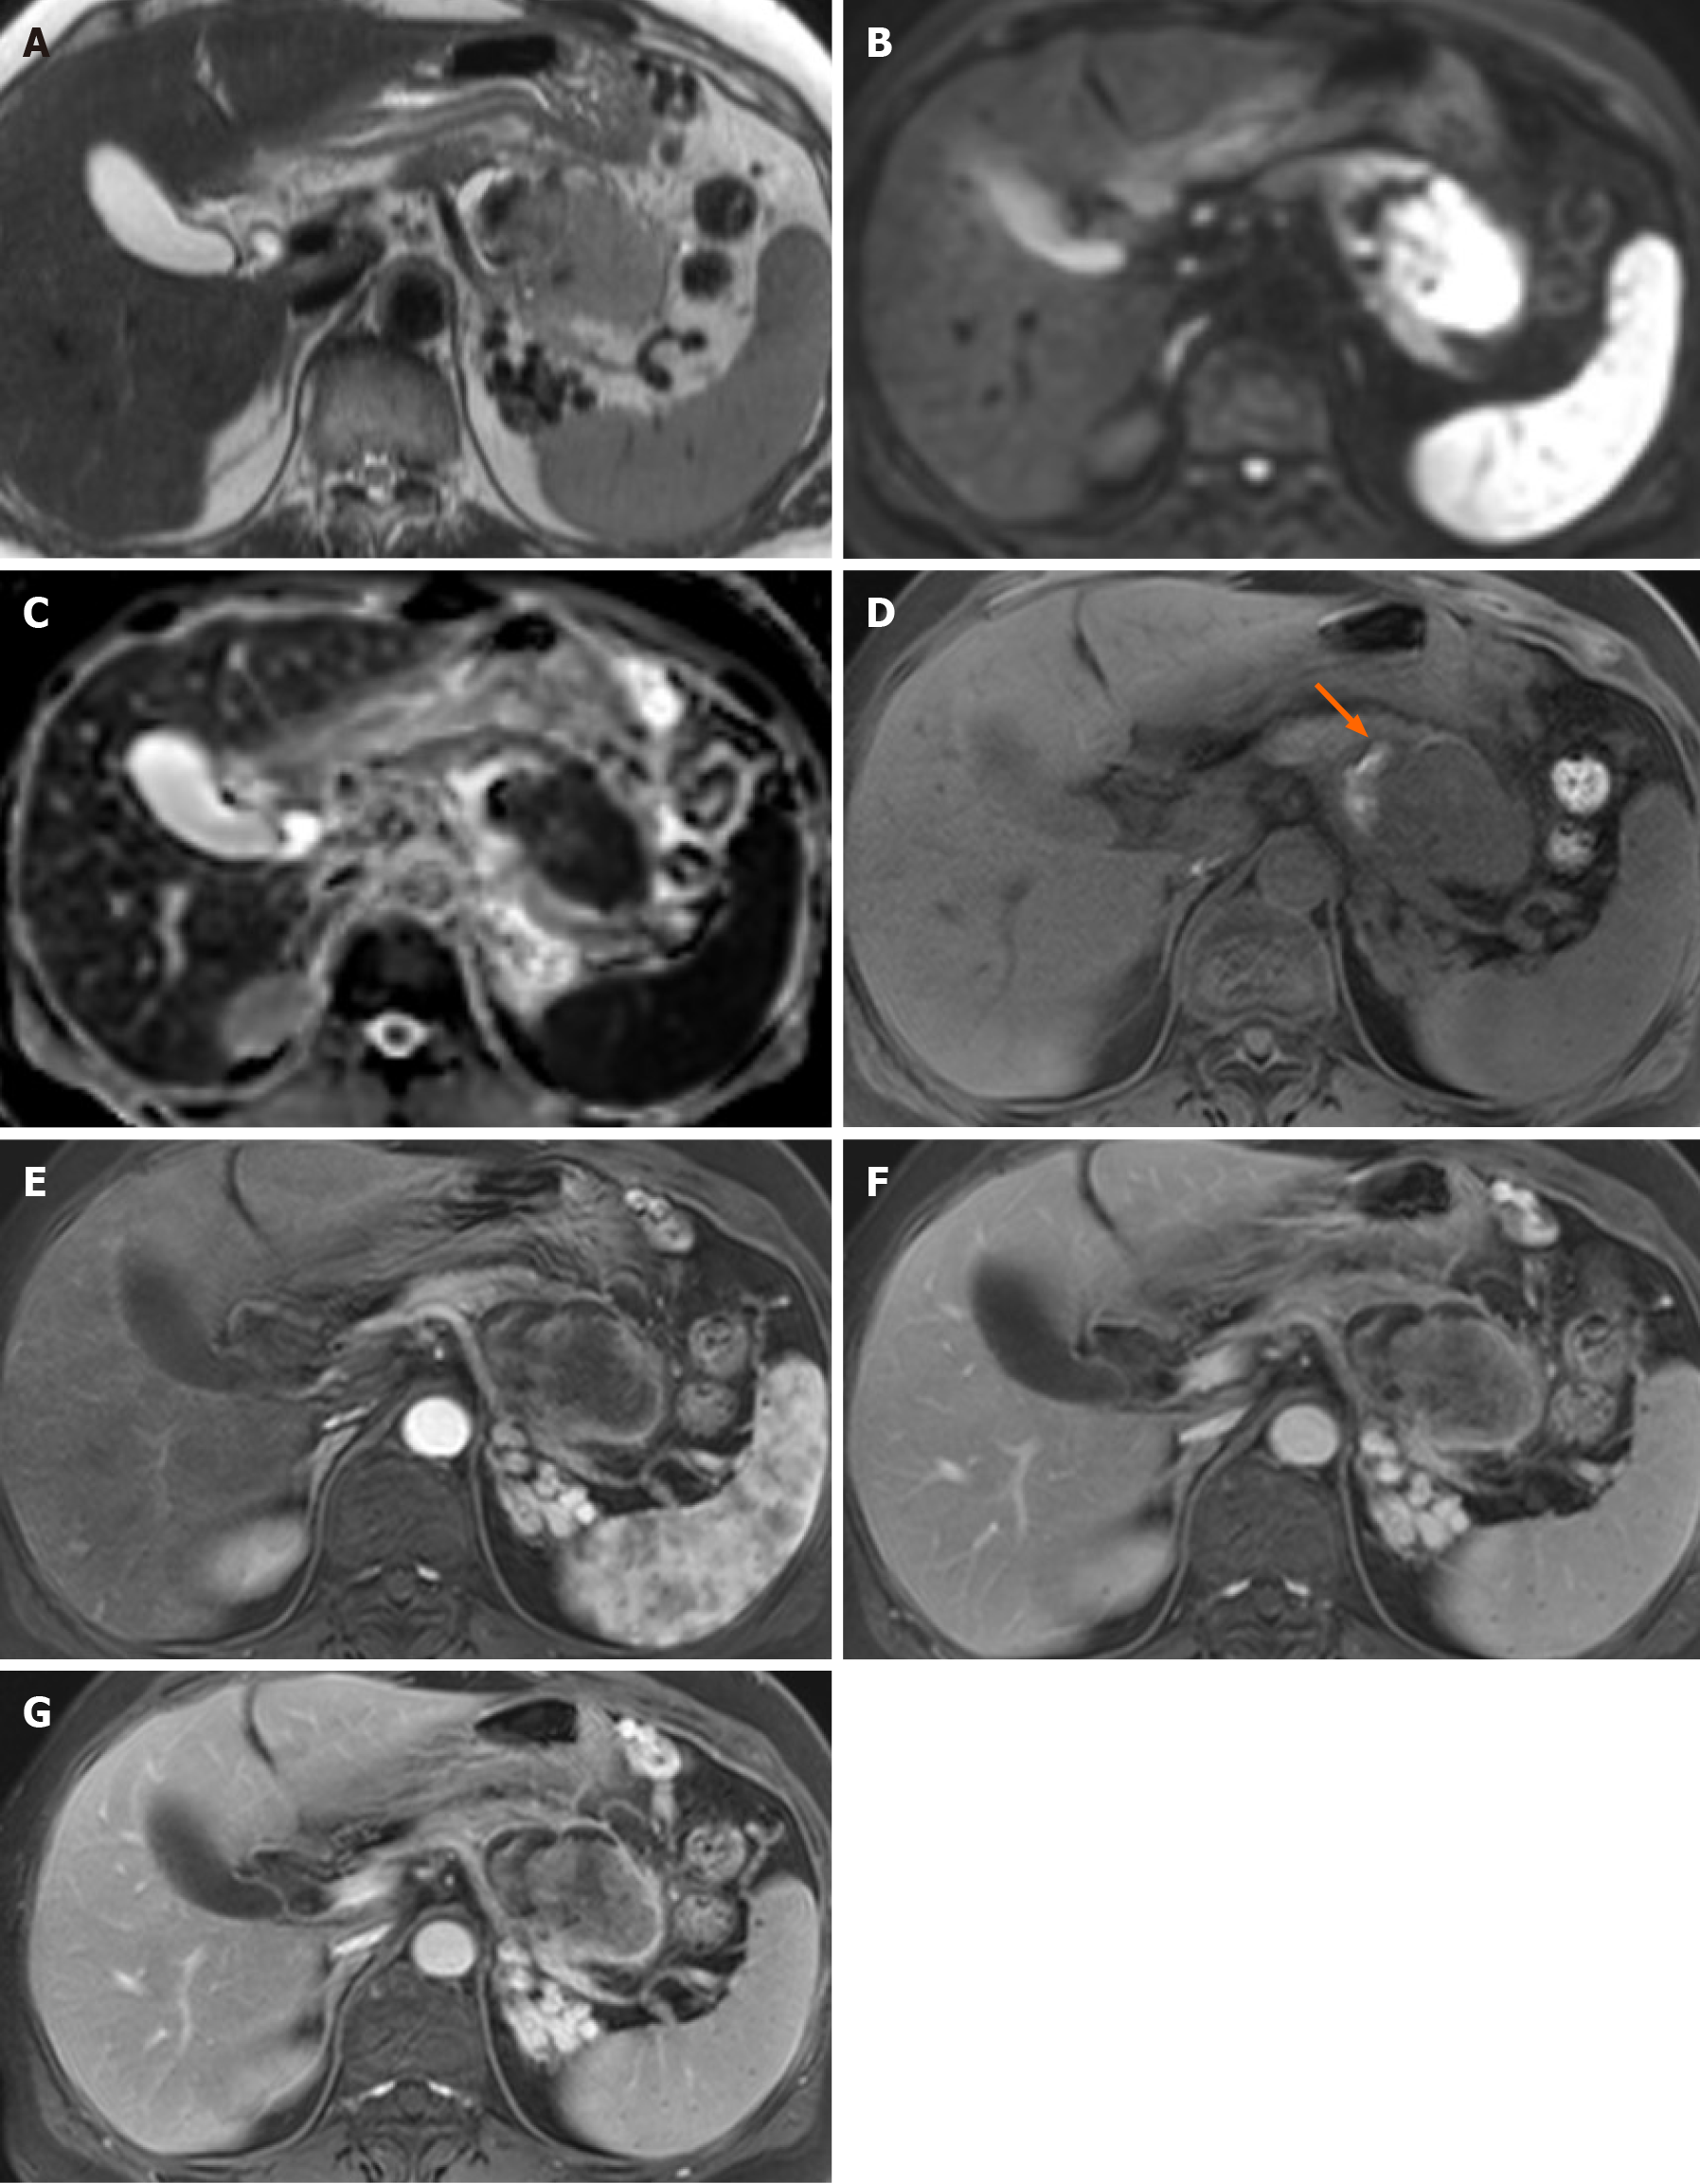
Figure 3 Magnetic resonance imaging findings.
A-D: An axial T2-weighted image showed an intermediate-to-high-signal intensity (SI) solid mass with peripheral cystic lesions in the pancreatic body (A); the solid portion in the mass showed diffusion restriction on the diffusion-weighted image (B); an apparent diffusion coefficient map (C); a small amount of intra-tumoral hemorrhage (arrow), showing high SI on an axial T1-weighted image (D) and low SI on a T2-weighted image was noted in the peripheral cystic portion (A); E-G: Axial contrast-enhanced dynamic T1-weighted images demonstrated significant peripheral progressive enhancement of the central solid portion.
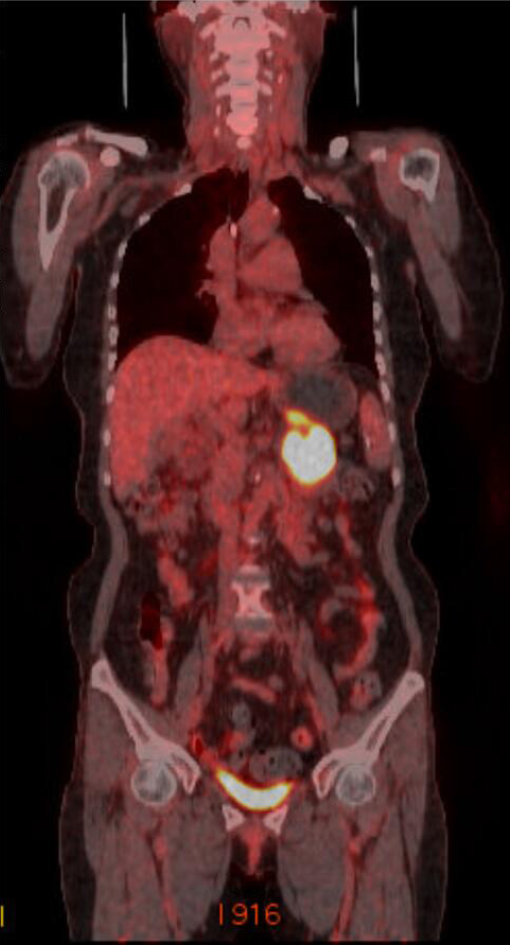
Figure 4 Positron emission tomography-computed tomography imaging findings.
Positron emission tomography-computed tomography showed a lobulated mass with intense 18-Fluorodeoxyglucose uptake in the pancreatic body. No evidence of distant metastasis was identified.
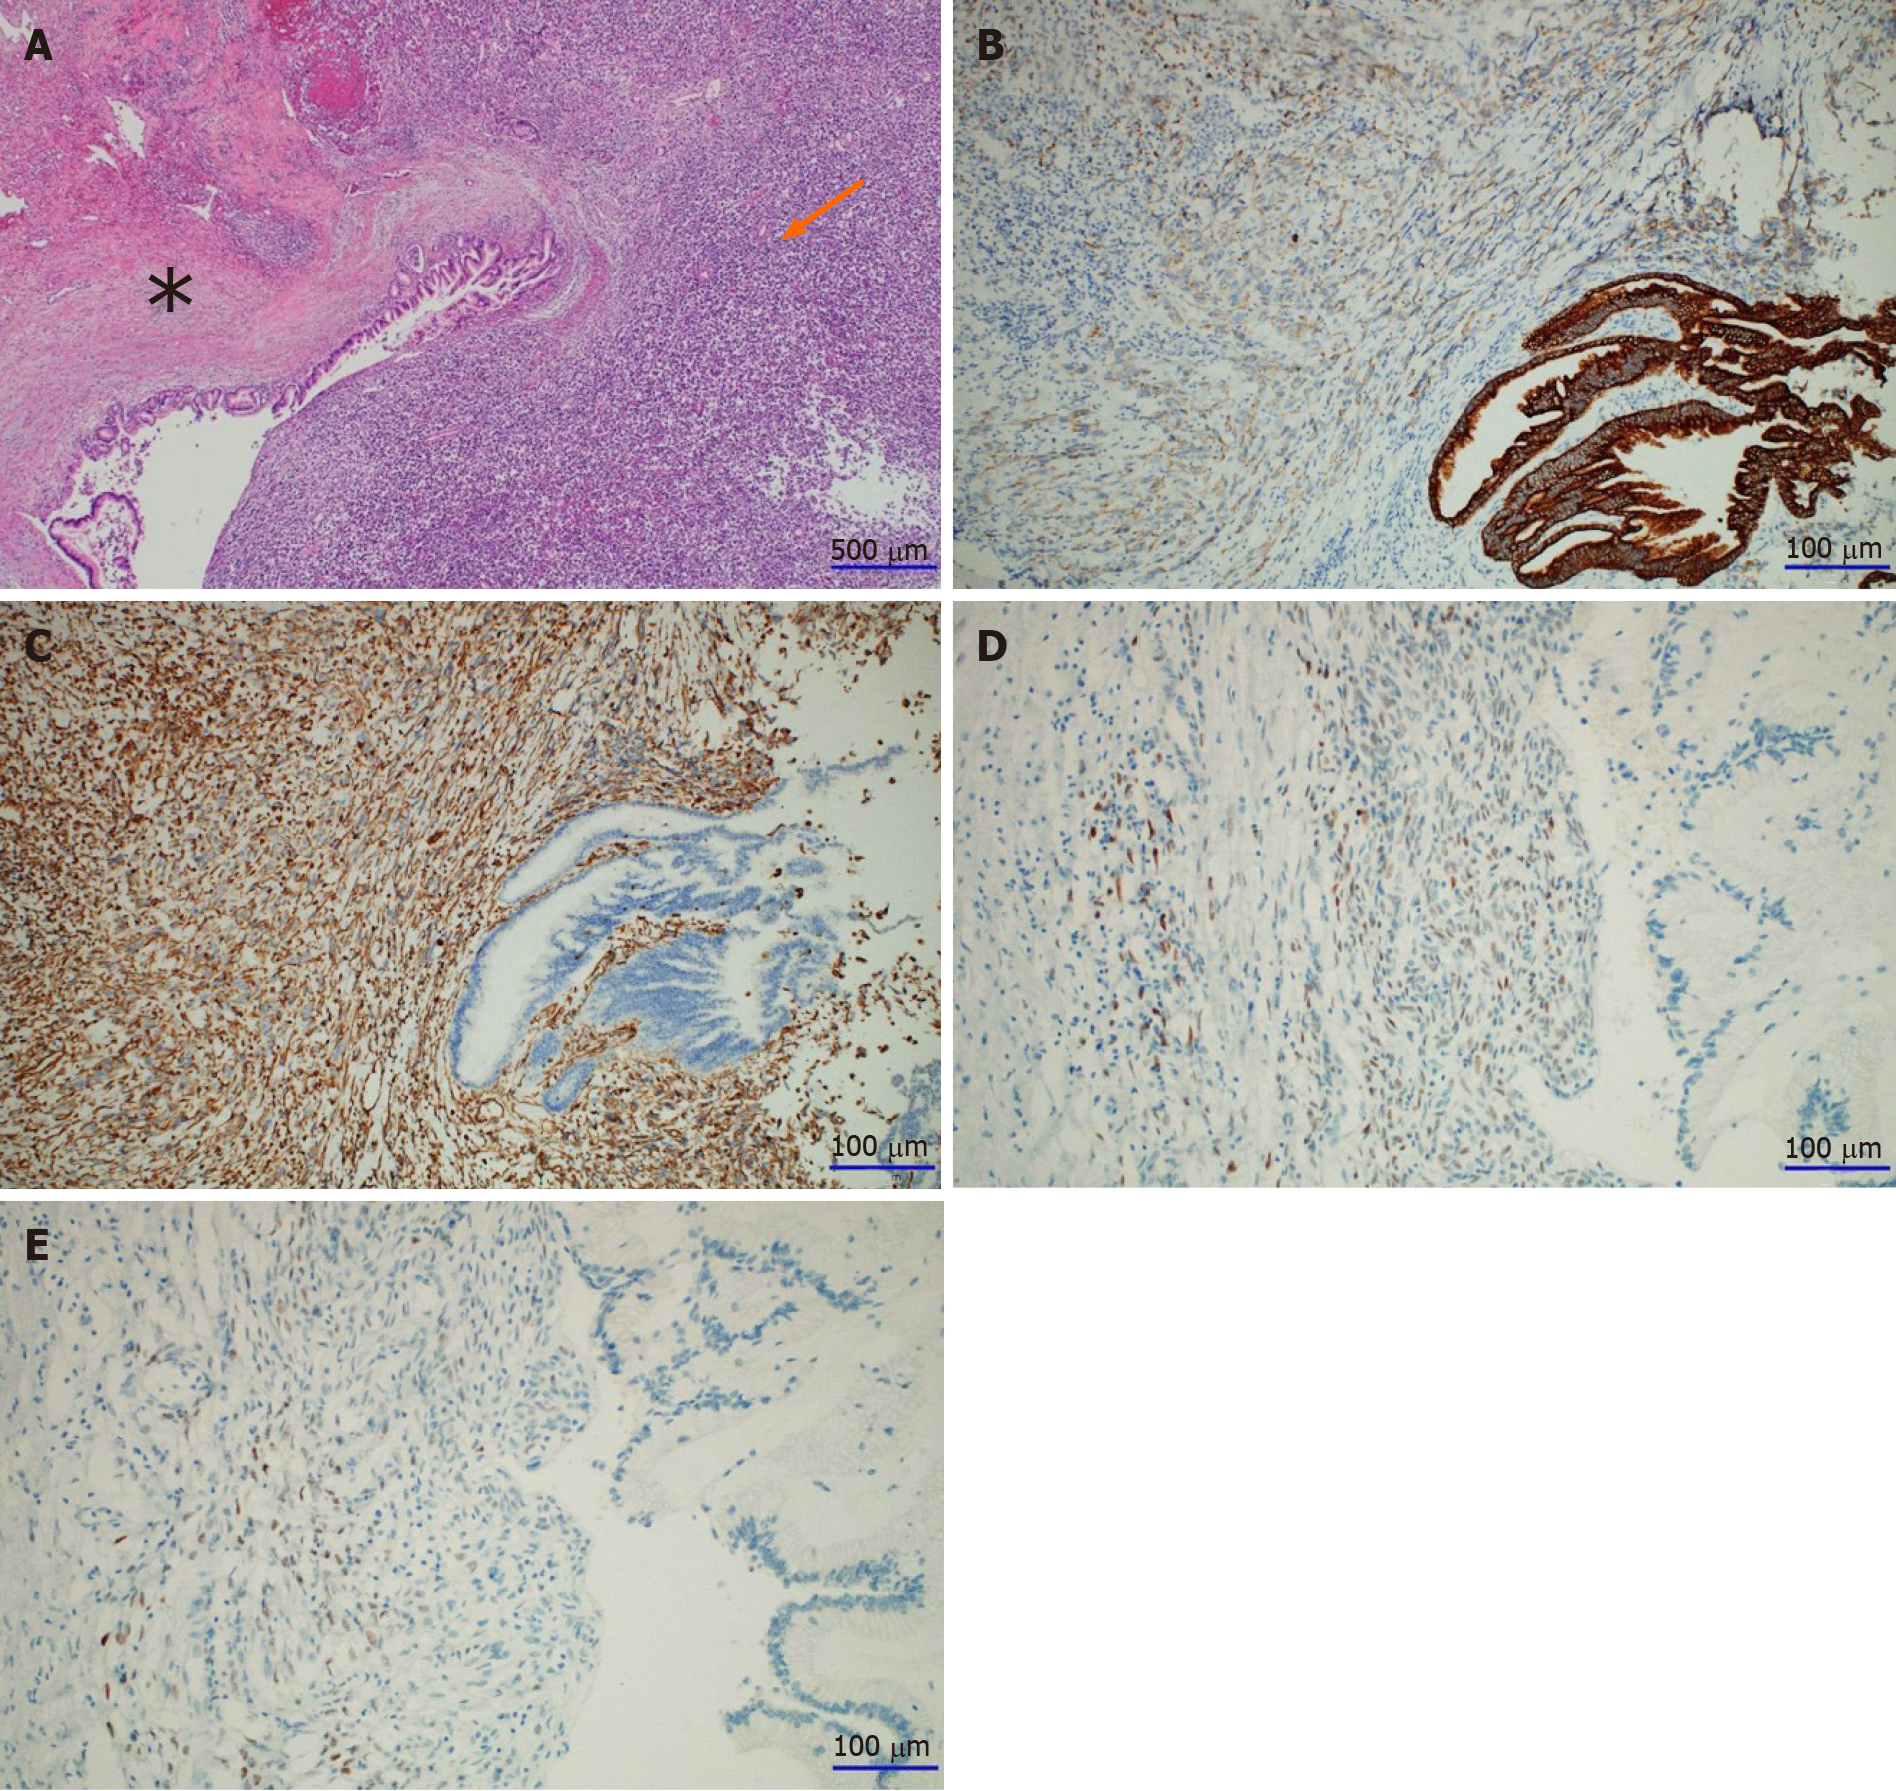
Figure 5 Histological examination of the lesion.
A: Microscopically, the tumor consisted of a central solid portion (arrow) and a thickened peripheral cystic wall (asterisk) on hematoxylin and eosin staining (magnification, × 40). Pathological findings showed that the tumors were adjacent to each other as two different components: sarcomatoid carcinoma (arrow) and mucinous cystic neoplasm (MCN) with high-grade dysplasia (asterisk); B and C: The MCN components were strongly and diffusely positive for pan-cytokeratin on immunostaining (magnification, × 200). The sarcomatoid carcinoma components were weakly positive for pan-cytokeratin (B) but strongly positive for vimentin on immunostaining (magnification, × 200) (C); D and E: The MCN had an ovarian-like stroma, which was immunohistochemically positive for the estrogen receptor (D), and the progesterone receptor (E) (magnification, × 200, respectively).
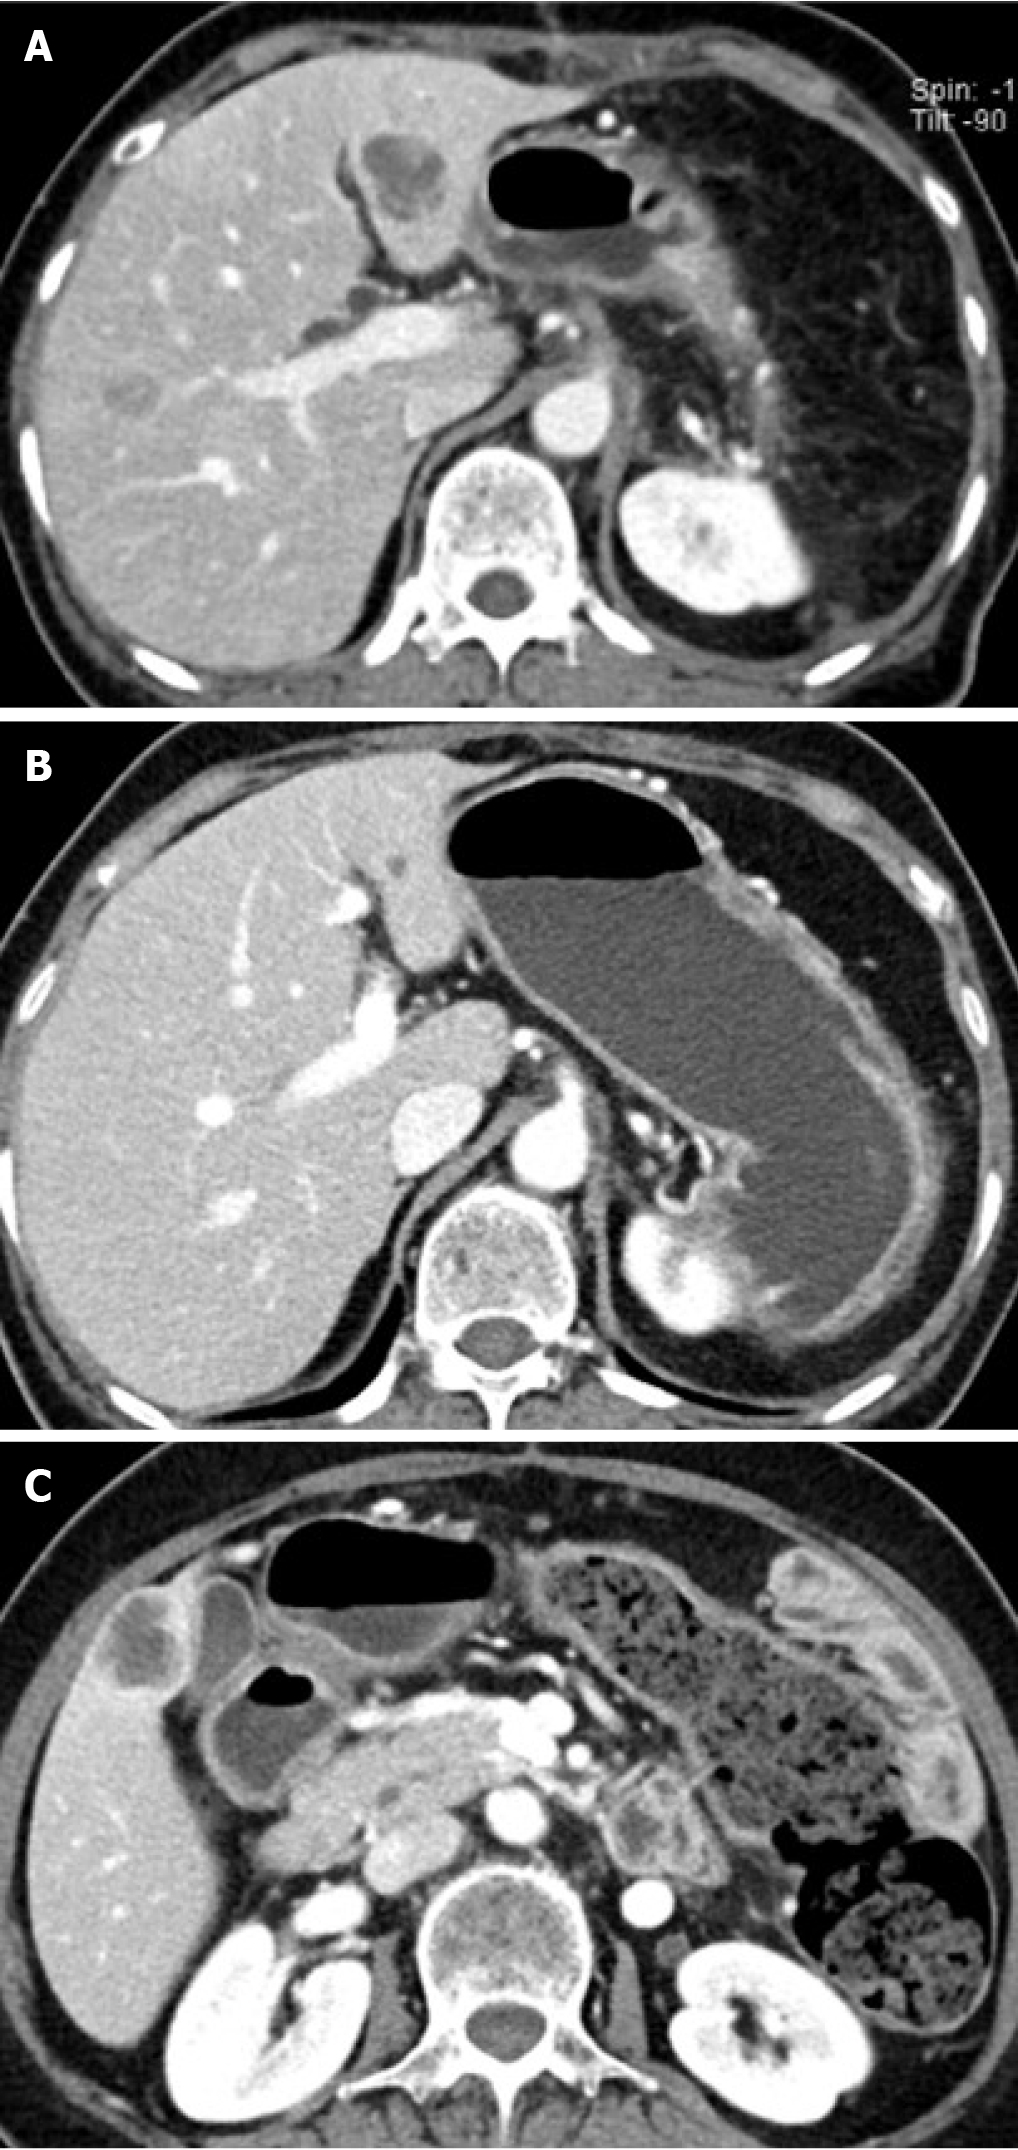
Figure 6 Serial postoperative follow-up computed tomography imaging.
A: Postoperative follow-up computed tomography after 1 mo showed multiple small hepatic metastases; B: After chemotherapy, the lesion reduced in size; C: However, new metastatic lesions had developed by the 7 mo follow-up, as seen in the computed tomography image.
- Citation: Lim HJ, Kang HS, Lee JE, Min JH, Shin KS, You SK, Kim KH. Sarcomatoid carcinoma of the pancreas — multimodality imaging findings with serial imaging follow-up: A case report and review of literature. World J Clin Cases 2021; 9(13): 3102-3113
- URL: https://www.wjgnet.com/2307-8960/full/v9/i13/3102.htm
- DOI: https://dx.doi.org/10.12998/wjcc.v9.i13.3102


