Copyright
©The Author(s) 2021.
World J Clin Cases. May 6, 2021; 9(13): 3079-3089
Published online May 6, 2021. doi: 10.12998/wjcc.v9.i13.3079
Published online May 6, 2021. doi: 10.12998/wjcc.v9.i13.3079
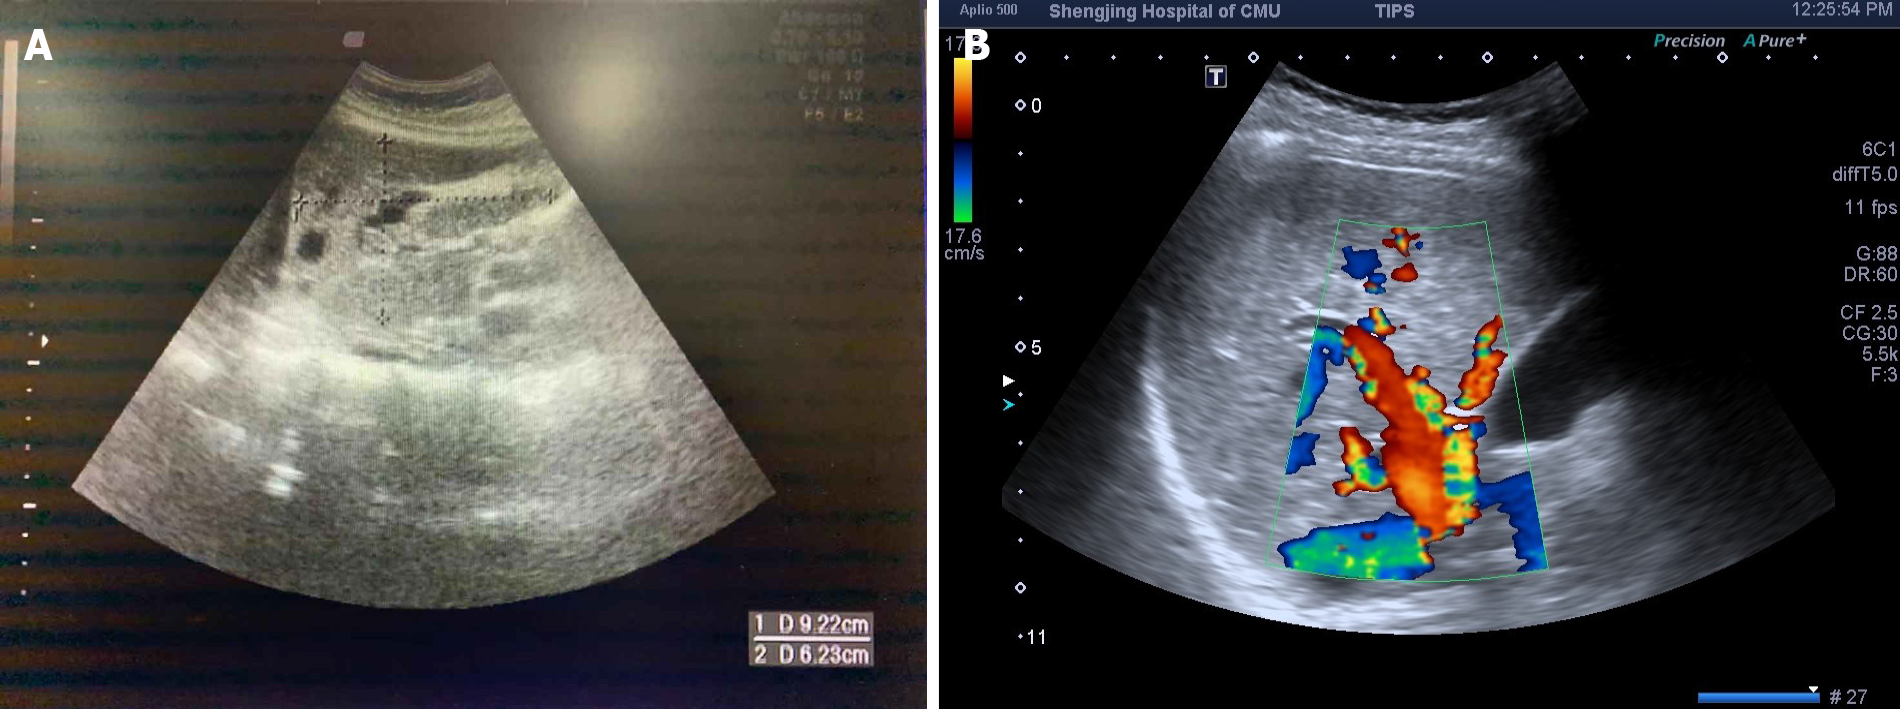
Figure 1 Liver ultrasound images of the proband and her relative.
A: The proband (β) showed vasodilation in the left lobe of the liver; B: The proband's relative (ε) showed hepatic artery dilatation, with a tortuous shape.
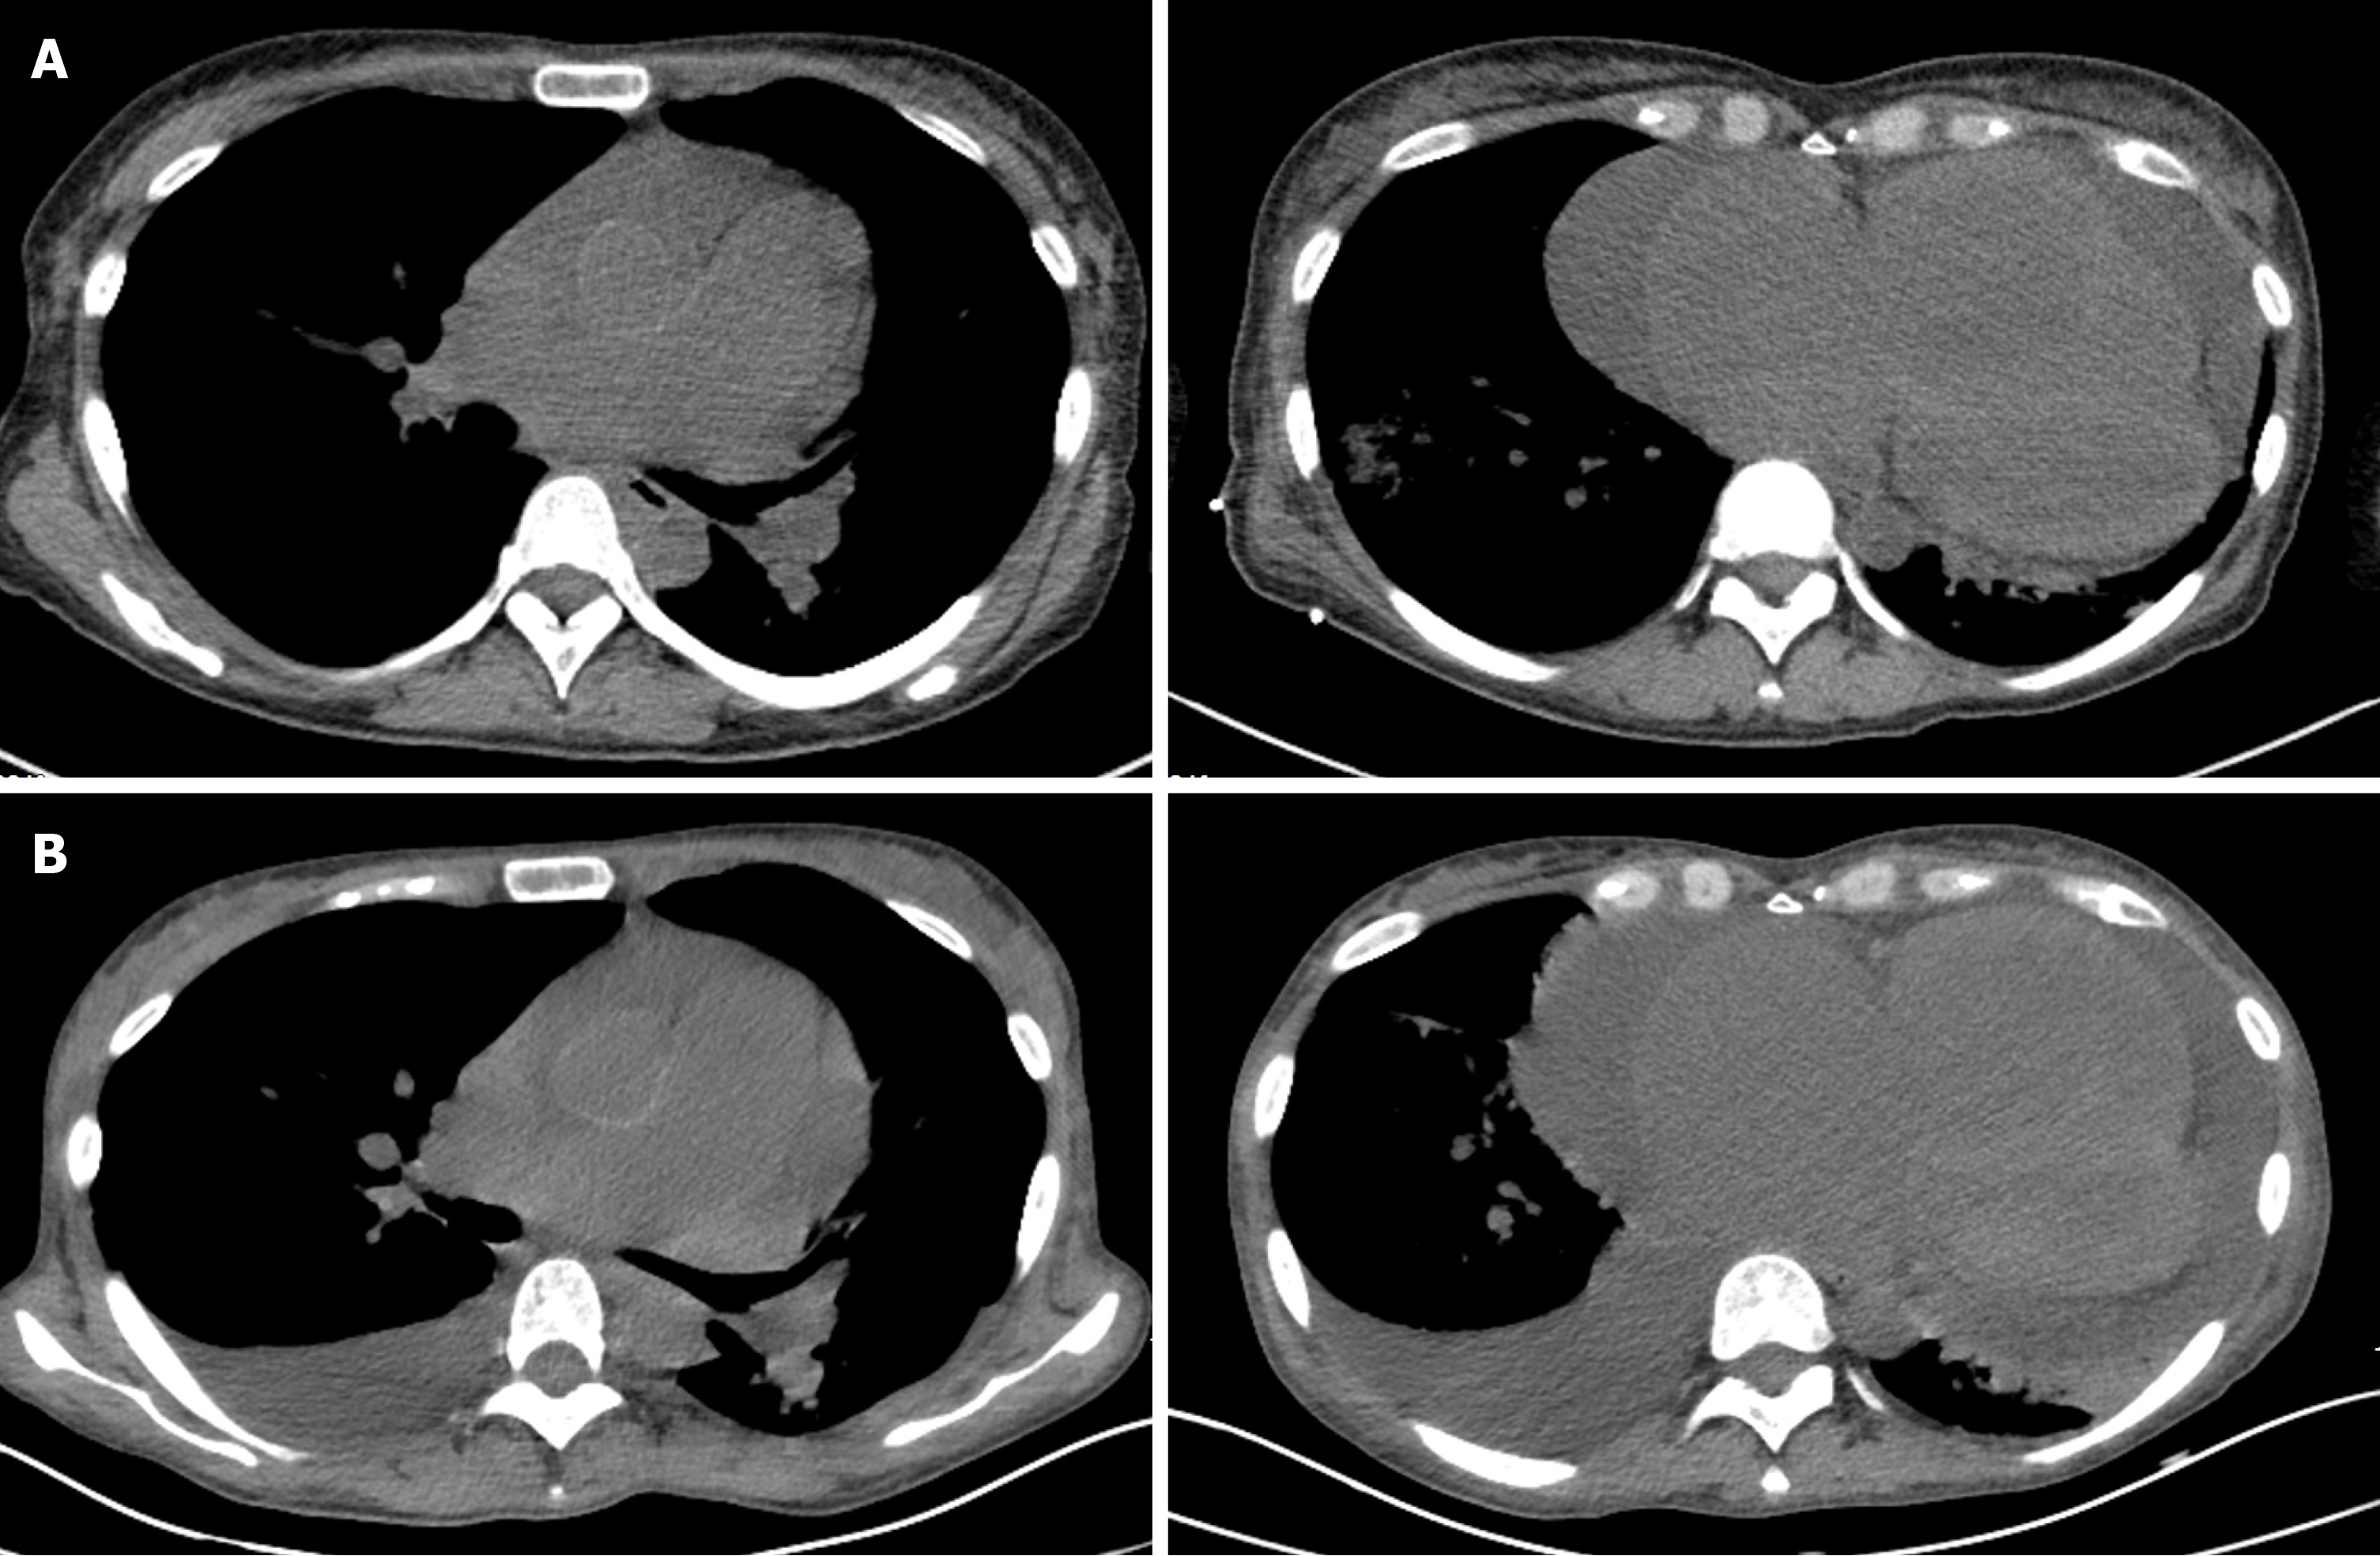
Figure 2 Lung computed tomography images of the proband.
A: Lung computed tomography (CT) performed at the first admission (April 30, 2019) showed (mediastinum window, pulmonary artery layer) the pulmonary artery to be obviously widened (upper left) and (mediastinum window, ventricle layer) an enlarged heart and pericardial effusion (upper right); B: Lung CT performed at the second admission (November 8, 2019) showed (mediastinal window, pulmonary artery layer) that, compared with panel A, bilateral pleural effusions had developed, especially on the right side (lower left), and (mediastinum window, ventricle layer) the pericardial effusion had increased, with bilateral pleural effusions appearing especially on the right side (lower right).
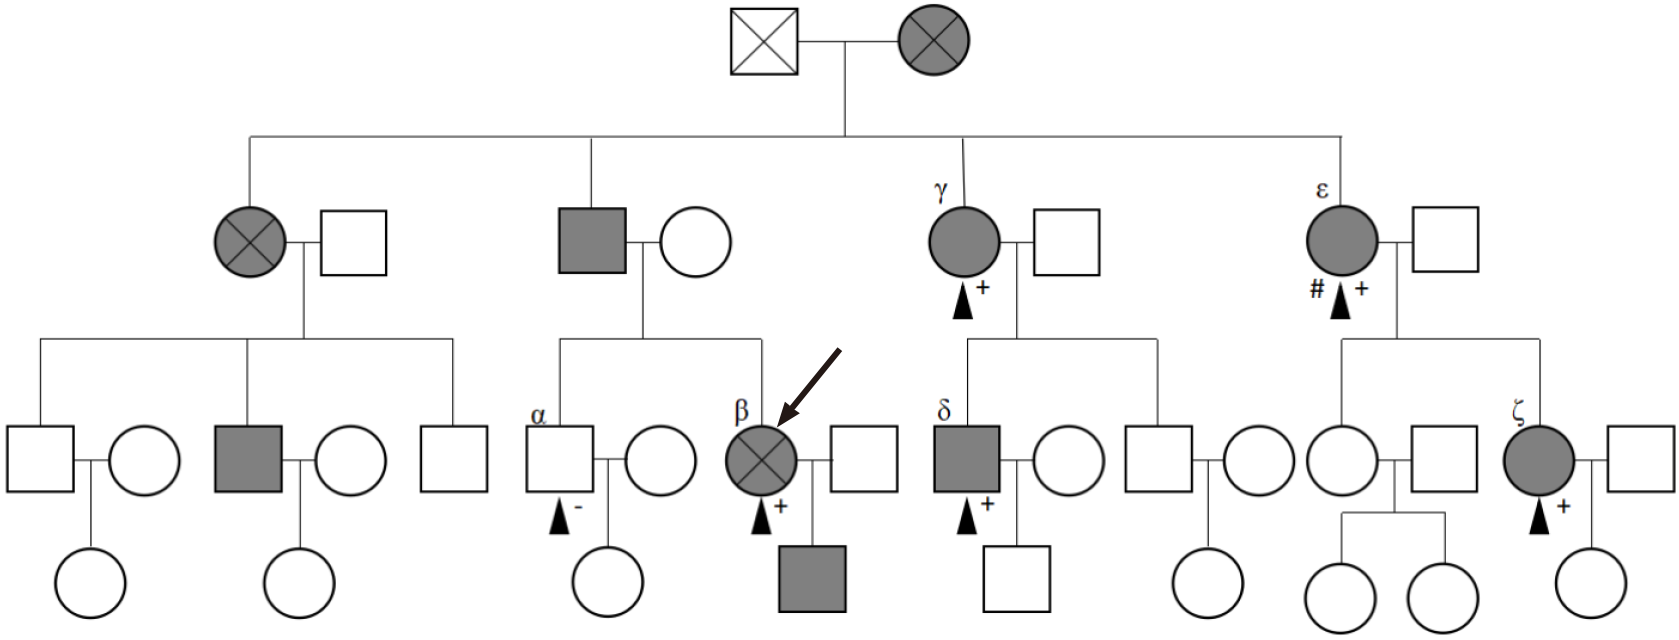
Figure 3 Pedigree chart for the proband and her family.
The black arrow indicates the proband. The black triangles (▲) represent family members (α, β, γ, δ, ε, and ζ) who completed the mutation analysis of whole exons. The pluses (+) represent members who showed positivity for the gene mutation, that is, existence of the ACVRL1 mutation (c. 1232G>A, p. Arg411Gln). The minus (-) represents the member who showed negativity for the gene mutation.
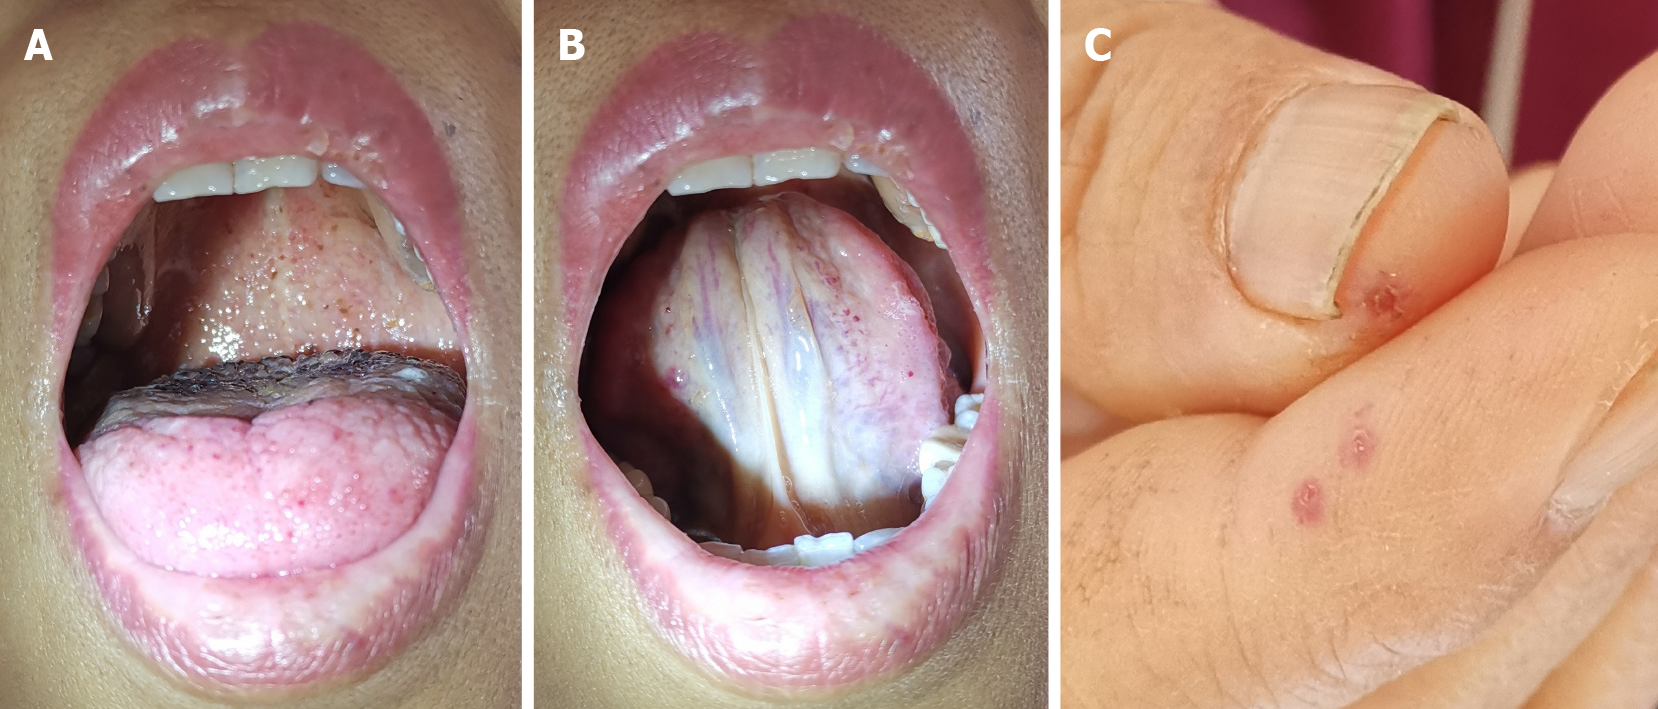
Figure 4 Some positive signs of the proband.
A: Bleeding spots were visible on the tongue and throat wall; B: Bleeding spots were visible on the underside of the tongue; C: Skin lesions were visible on the end of the fingers.
Figure 5 Electrocardiogram during the first hospitalization of the patient (April 22, 2019).
The findings indicated a heart rate of 111 beats/min, V1 R/S > 1, V5 R/S = 1, aVR R/S > 1, sinus tachycardia, possible right ventricular hypertrophy, and lung disease.
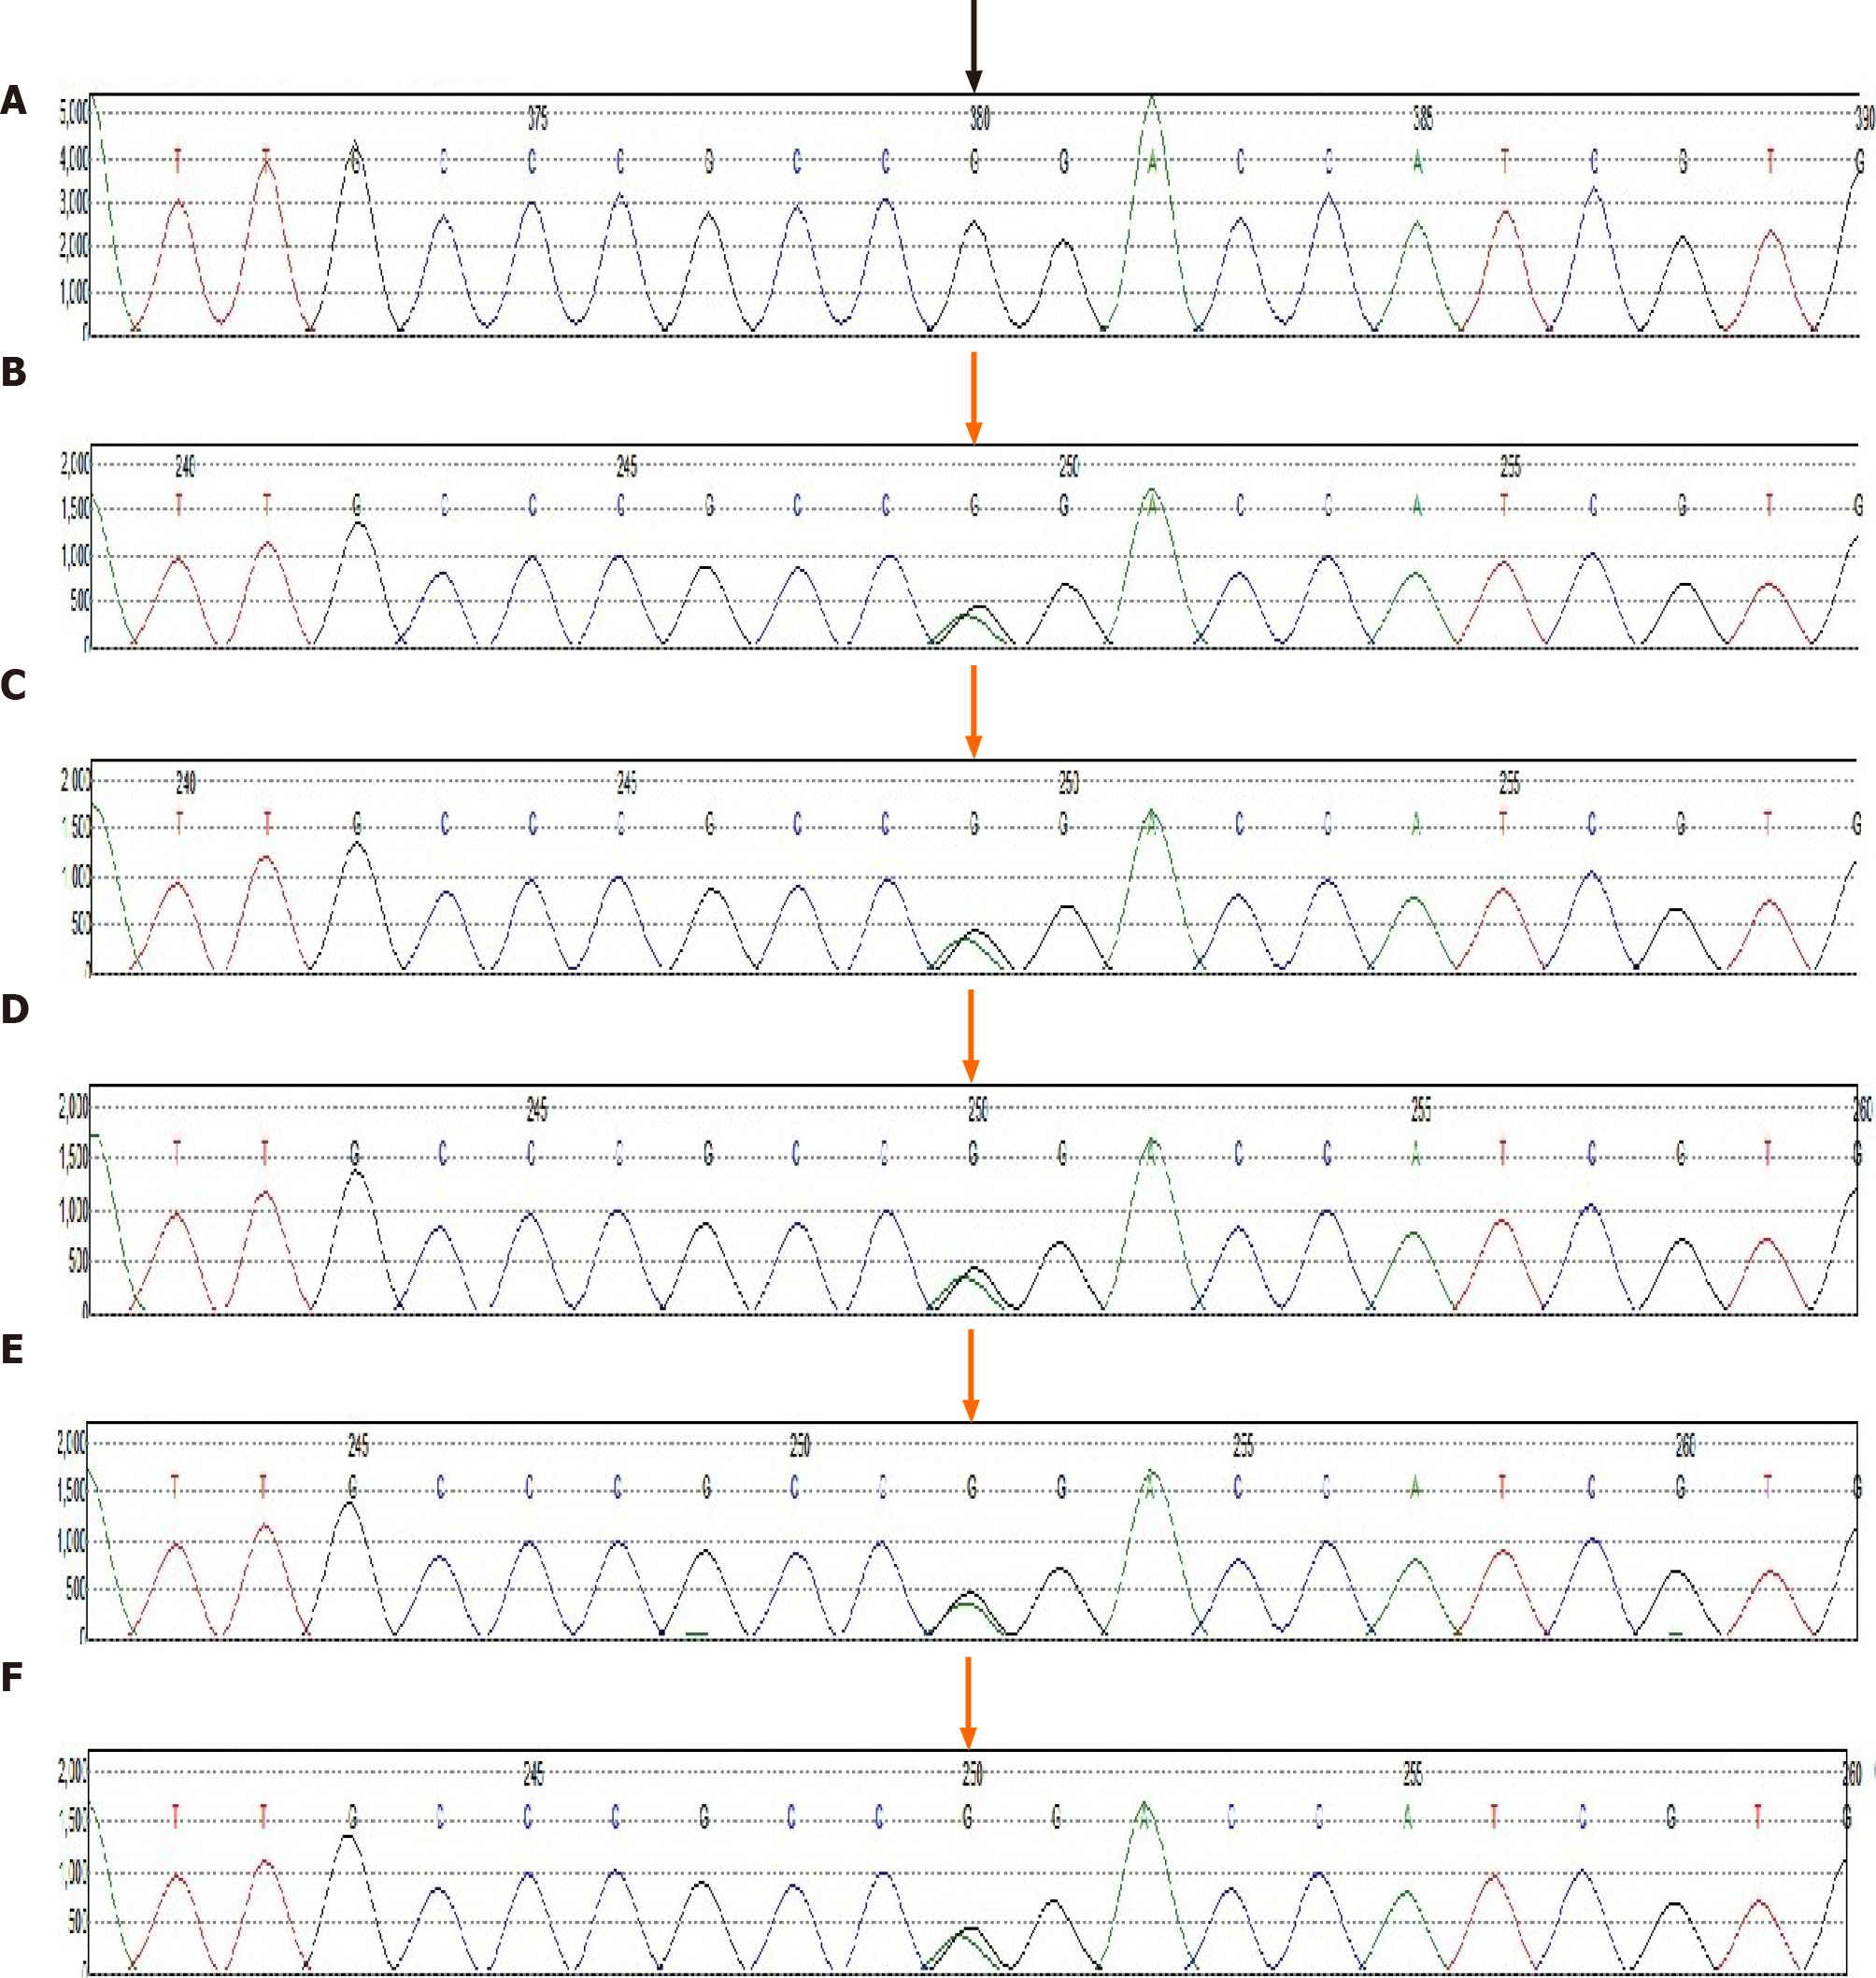
Figure 6 ACVRL1 gene sequencing results.
The black arrow indicates the heterozygous mutation of the exon (12q13.13|NM_000020.2, Exon 8, c. 1232G>A, p. Arg411Gln). β, γ, δ, ε, and ζ are the family members who completed the mutation detection of whole exons, indicating the existence of the mutation. See the pedigree chart for details (Figure 3). A: Reference sequence; B: Proband (β); C: Family member (γ) sequence; D: Family member (δ) sequence; E: Family member (ε) sequence; F: Family member (ζ) sequence.
-
Citation: Wu J, Yuan Y, Wang X, Shao DY, Liu LG, He J, Li P. Pulmonary arterial hyper
tension in a patient with hereditary hemorrhagic telangiectasia and family gene analysis: A case report. World J Clin Cases 2021; 9(13): 3079-3089 - URL: https://www.wjgnet.com/2307-8960/full/v9/i13/3079.htm
- DOI: https://dx.doi.org/10.12998/wjcc.v9.i13.3079


