Copyright
©The Author(s) 2021.
World J Clin Cases. May 6, 2021; 9(13): 3048-3055
Published online May 6, 2021. doi: 10.12998/wjcc.v9.i13.3048
Published online May 6, 2021. doi: 10.12998/wjcc.v9.i13.3048
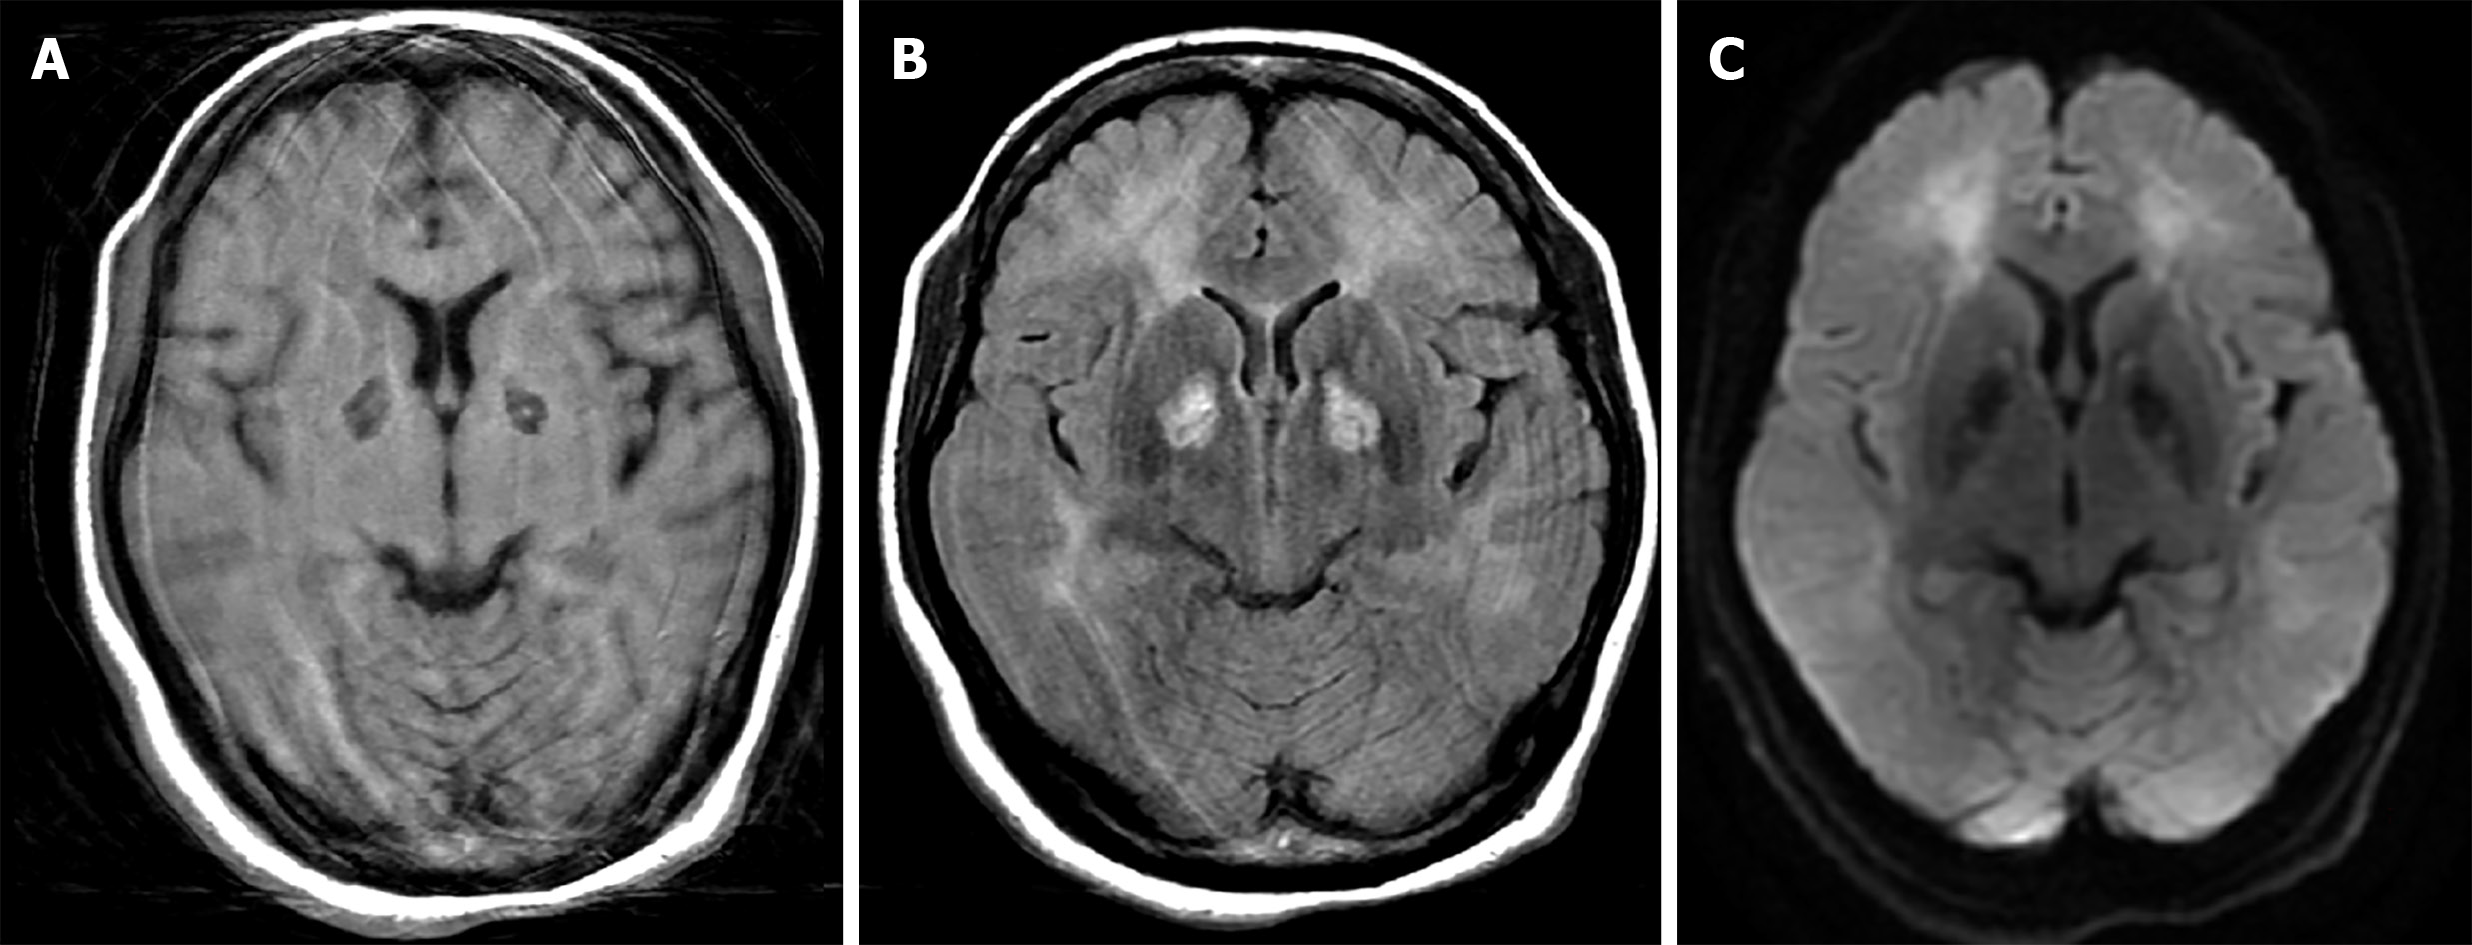
Figure 1 Brain magnetic resonance images of the patient.
A: Axial view of T1-weighted image shows low signal of bilateral globus pallidi, with a tiny high signal indicating minor hemorrhage; B: T2-Fluid-Attenuated Inversion Recovery image shows hyperintensities of bilateral globus pallidi and diffuse leukoencephalopathy in subcortical white matter of the bilateral frontal and occipital lobes; and C: Diffusion-weighted image shows increased diffusion signals. Artifacts were caused by the patient’s movement during image acquisition.
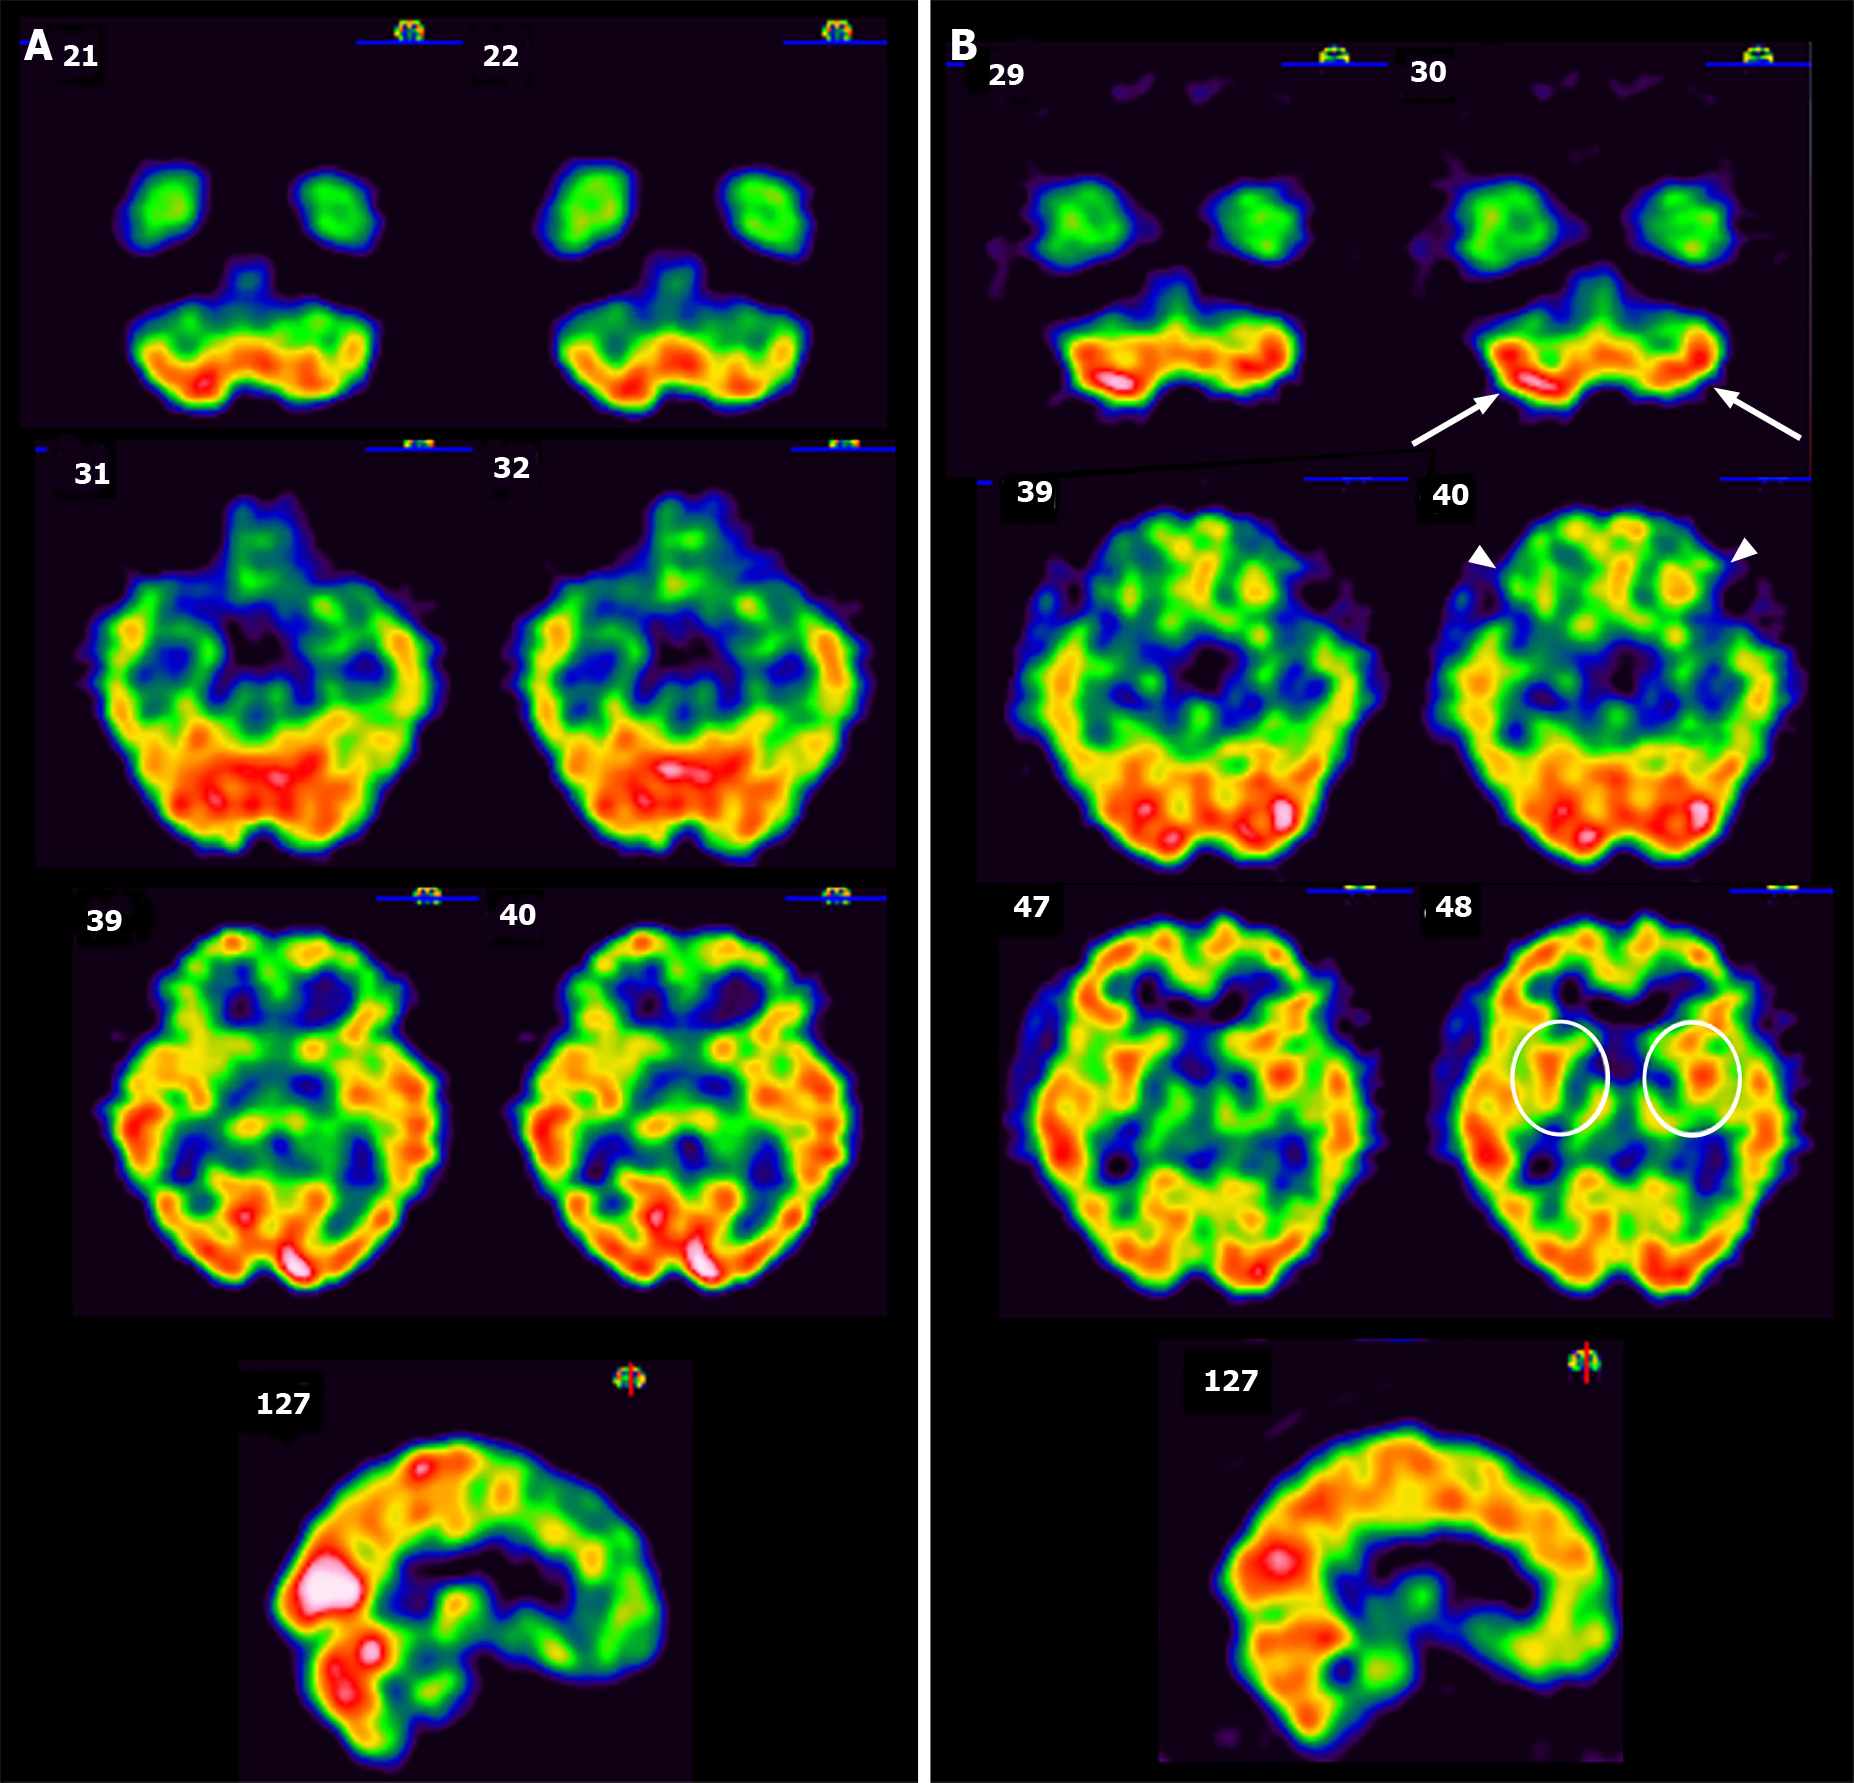
Figure 2 Technetium-99m ethyl cysteinate dimer single-photon emission computed tomography images of the patient.
A: Single-photon emission computed tomography images before intravascular laser irradiation of blood therapy. Prominent hypoperfusion can be seen in the axial views of the left cerebellum, bilateral frontal lobe, and bilateral striata (from top row to bottom row). The sagittal view shows hypoperfusion in the parietal lobe and frontal lobe; B: Follow-up single-photon emission computed tomography images after 3 courses of intravascular laser irradiation of blood. Greatly improved perfusion can be seen in the bilateral cerebellum (arrow), bilateral frontal lobe (arrowhead), bilateral striata (circle), and parietal lobe (sagittal view). Intensity of photon uptake is shown in color, e.g., white represents the strongest signal intensity and thus greater perfusion, followed by red, yellow, green, blue, and finally black.
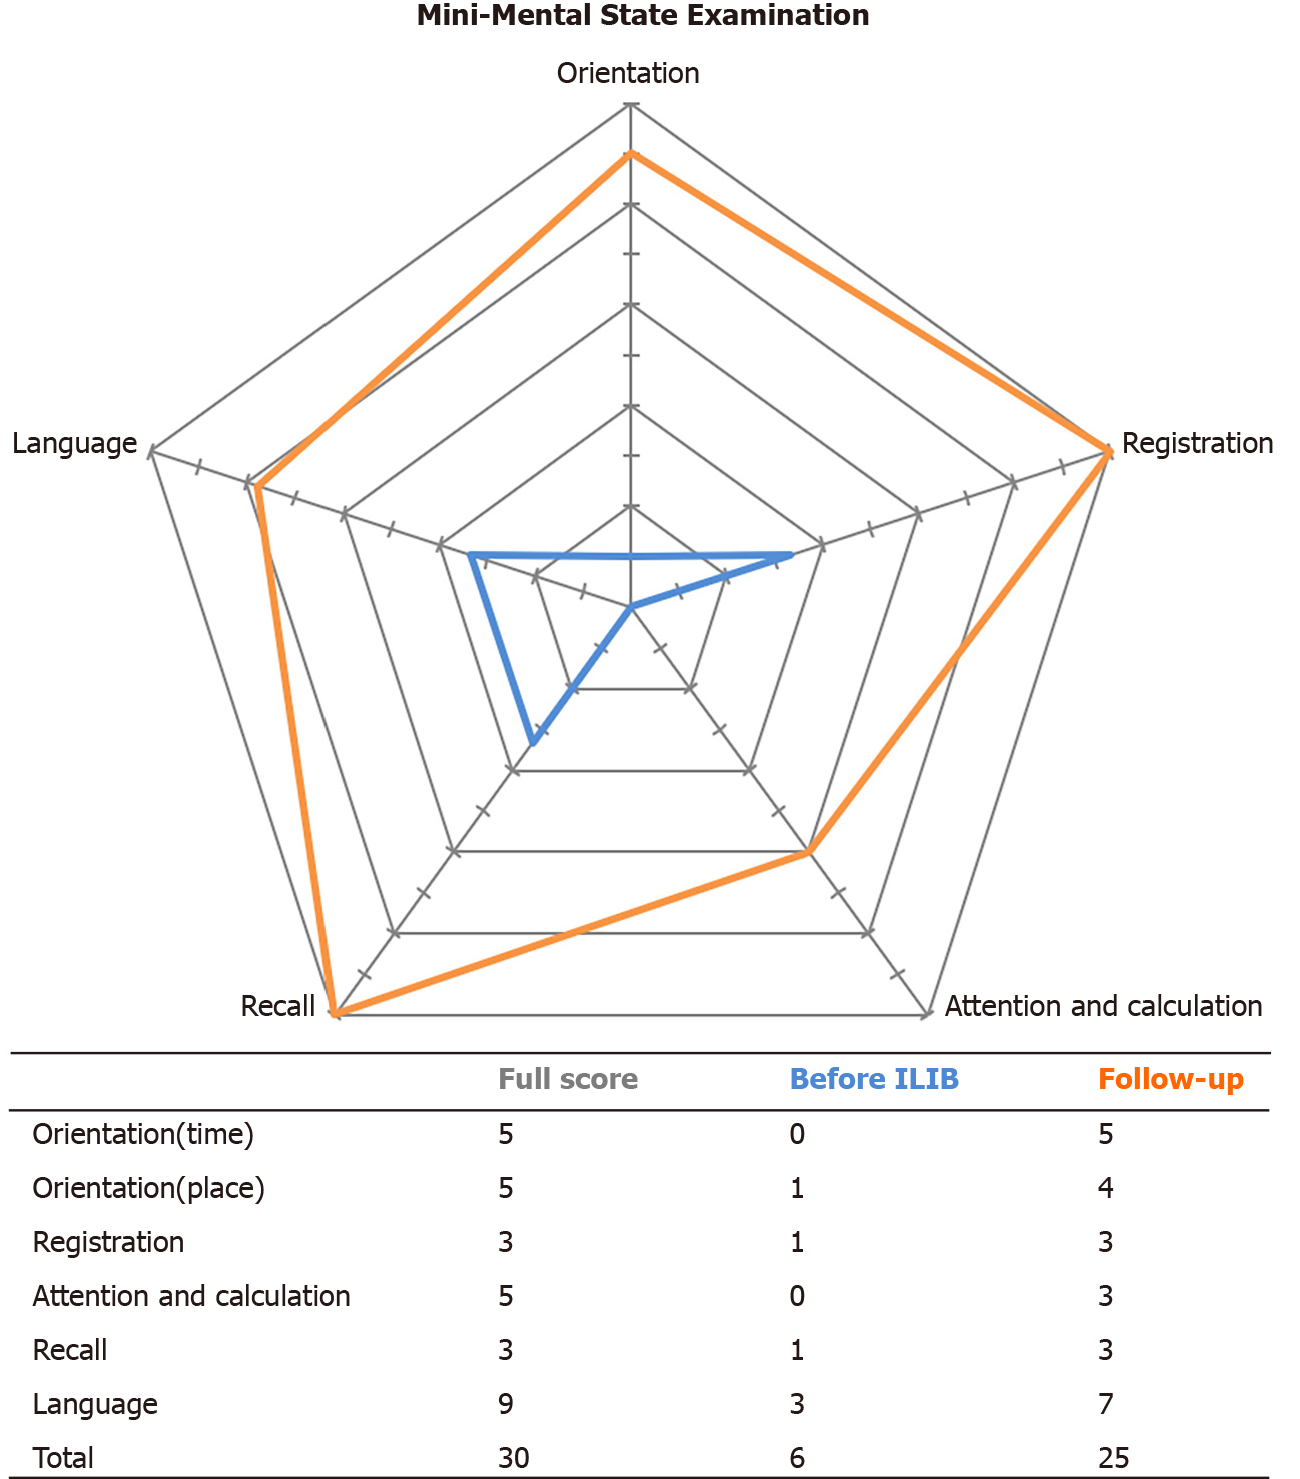
Figure 3 Comparison of Mini-Mental State Examination before intravascular laser irradiation of blood treatment and at follow-up.
Scores are transformed to percentages of total scores in each subgroup in order to create the radar diagram. ILIB: Intravascular laser irradiation of blood.
- Citation: Liu CC, Hsu CS, He HC, Cheng YY, Chang ST. Effects of intravascular laser phototherapy on delayed neurological sequelae after carbon monoxide intoxication as evaluated by brain perfusion imaging: A case report and review of the literature. World J Clin Cases 2021; 9(13): 3048-3055
- URL: https://www.wjgnet.com/2307-8960/full/v9/i13/3048.htm
- DOI: https://dx.doi.org/10.12998/wjcc.v9.i13.3048


