Copyright
©The Author(s) 2021.
World J Clin Cases. Apr 16, 2021; 9(11): 2679-2687
Published online Apr 16, 2021. doi: 10.12998/wjcc.v9.i11.2679
Published online Apr 16, 2021. doi: 10.12998/wjcc.v9.i11.2679
Figure 1 Optimization of the contrast agent mixture in normal volunteers.
A: Gray-scale and contrast-enhanced ultrasound showed mild and insufficient enhancement of the upper gastrointestinal tract at the mixture ratio of 1 mL:500 mL; B: The 2.5 mL:500 mL ratio mixture produced homogenous moderate enhancement with good sound penetrability and margin delineation appearing within the esophagus and stomach. Arrows indicate the esophageal hiatus; C: The 5 mL:500 mL ratio mixture produced strong enhancement reflection with obvious far-field sound attenuation (triangle). ES: Esophagus; ST: Stomach.
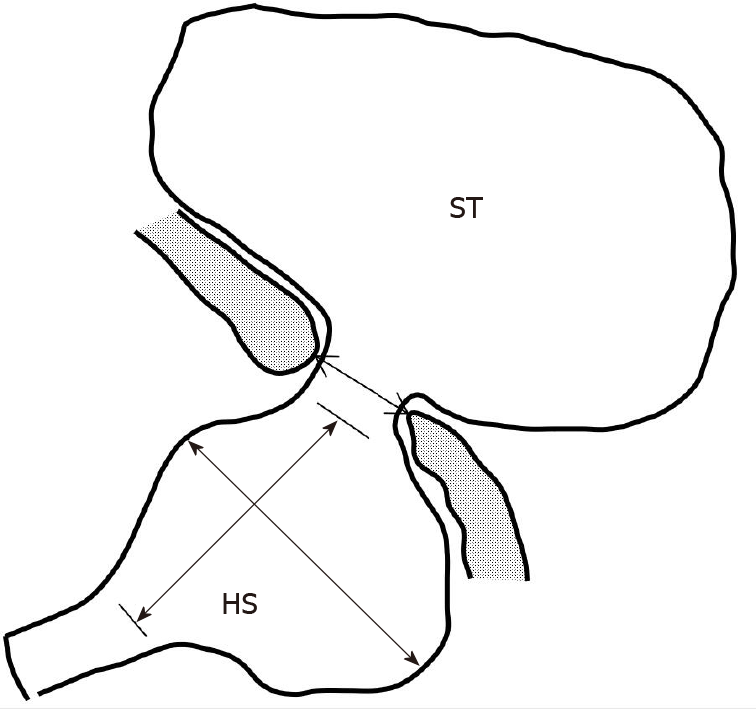
Figure 2 Measurement of the esophageal hiatus and the hernial sac.
The schematic diagram shows the measurement of the esophageal hiatus with fine-head arrows and the hernial sac with solid-head arrows. HS: Hernial sac; ST: Stomach.
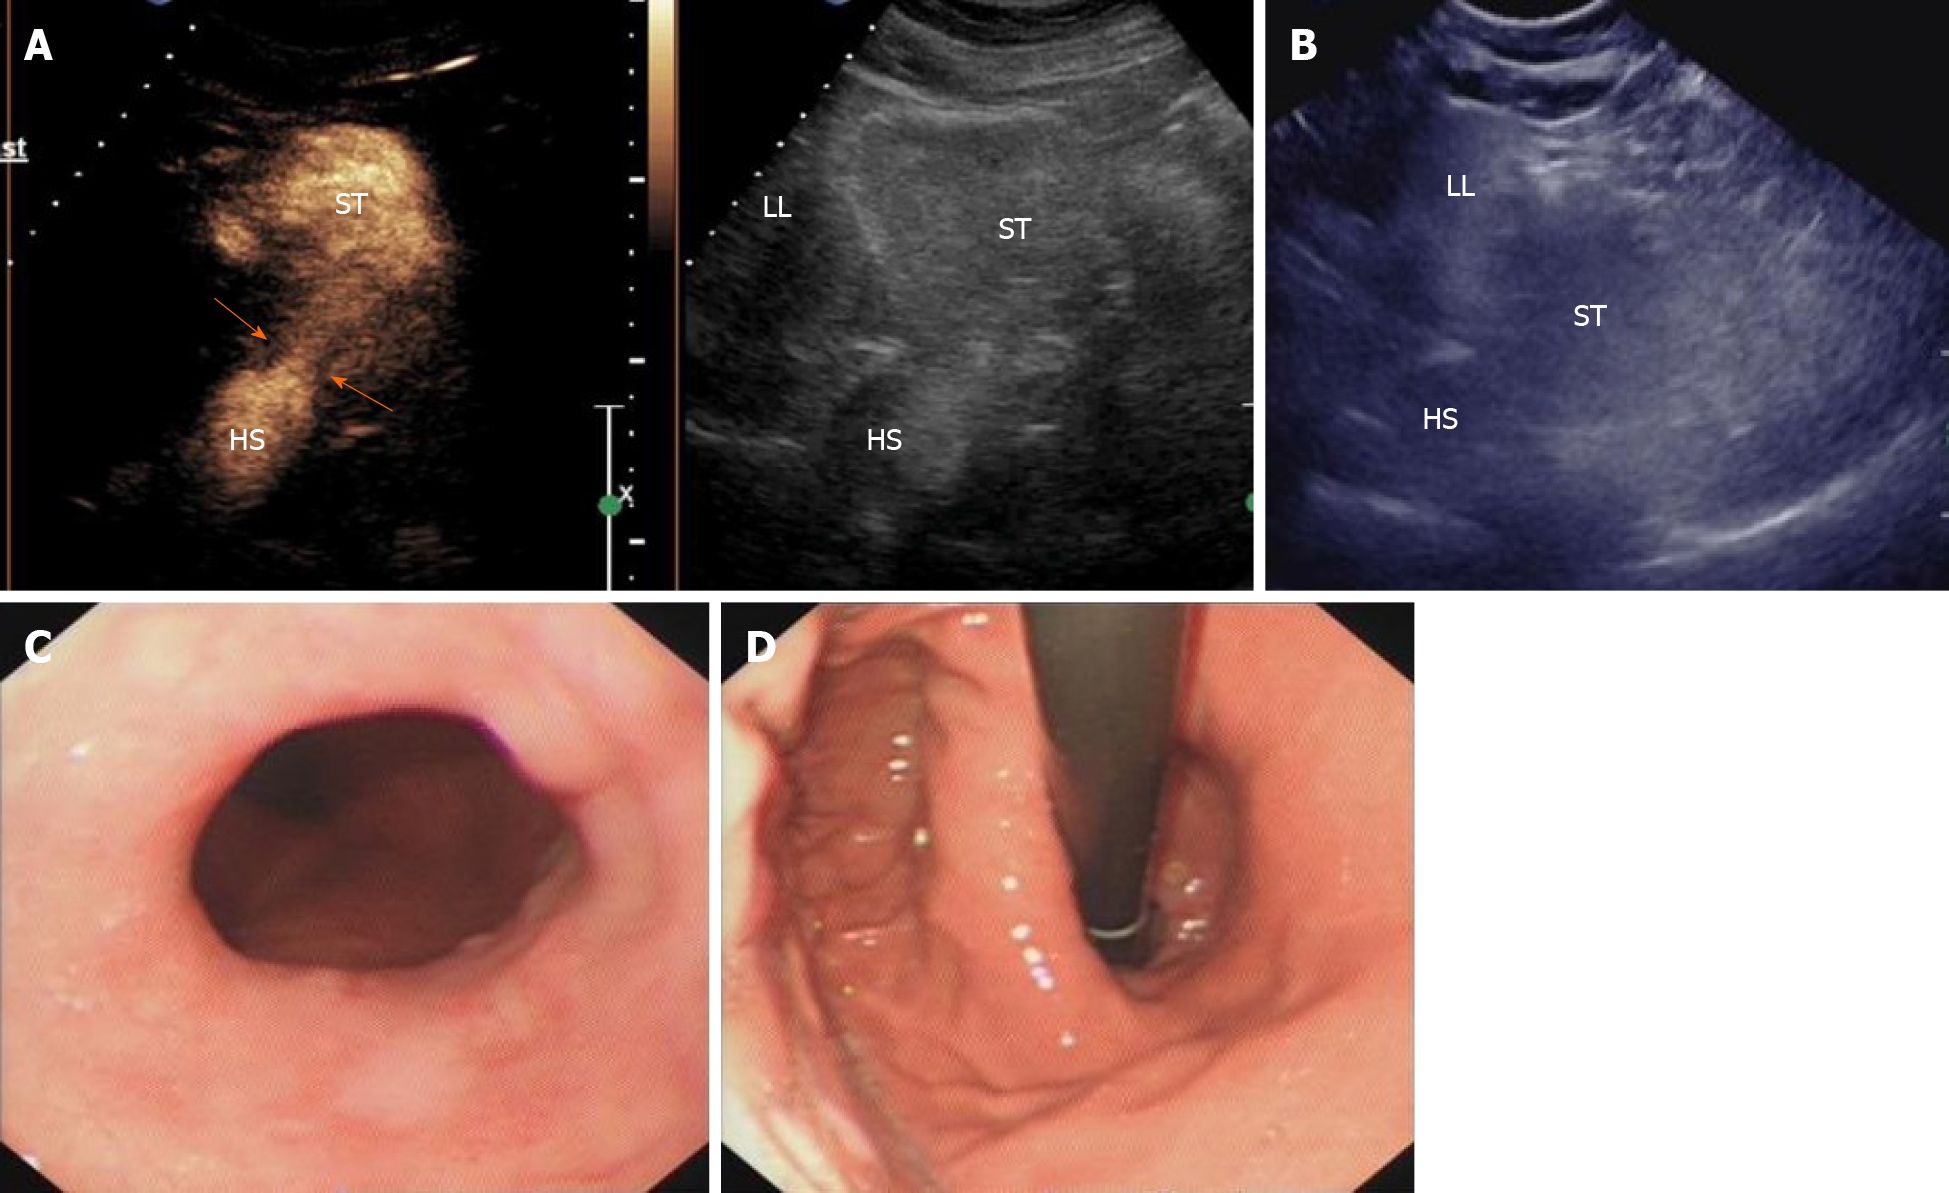
Figure 3 A 63-year-old woman with esophageal hiatal hernia.
A: Compared to the gray-scale imaging (right panel), contrast-enhanced ultrasound imaging clearly showed the esophageal hiatus (arrows) and the supradiaphragmatic hernial sac (HS); B: Ultrasound image obtained with conventional oral contrast agent shows the HS; C: Gastroscopic front view showed the dentate line to be shifted upwards and separated from the gastroesophageal junction; D: In the reverse view, the cardia opening was shown to be loosened and the double ring sign was partially visible. HS: Hernial sac; LL: Left liver lobe; ST: Stomach.
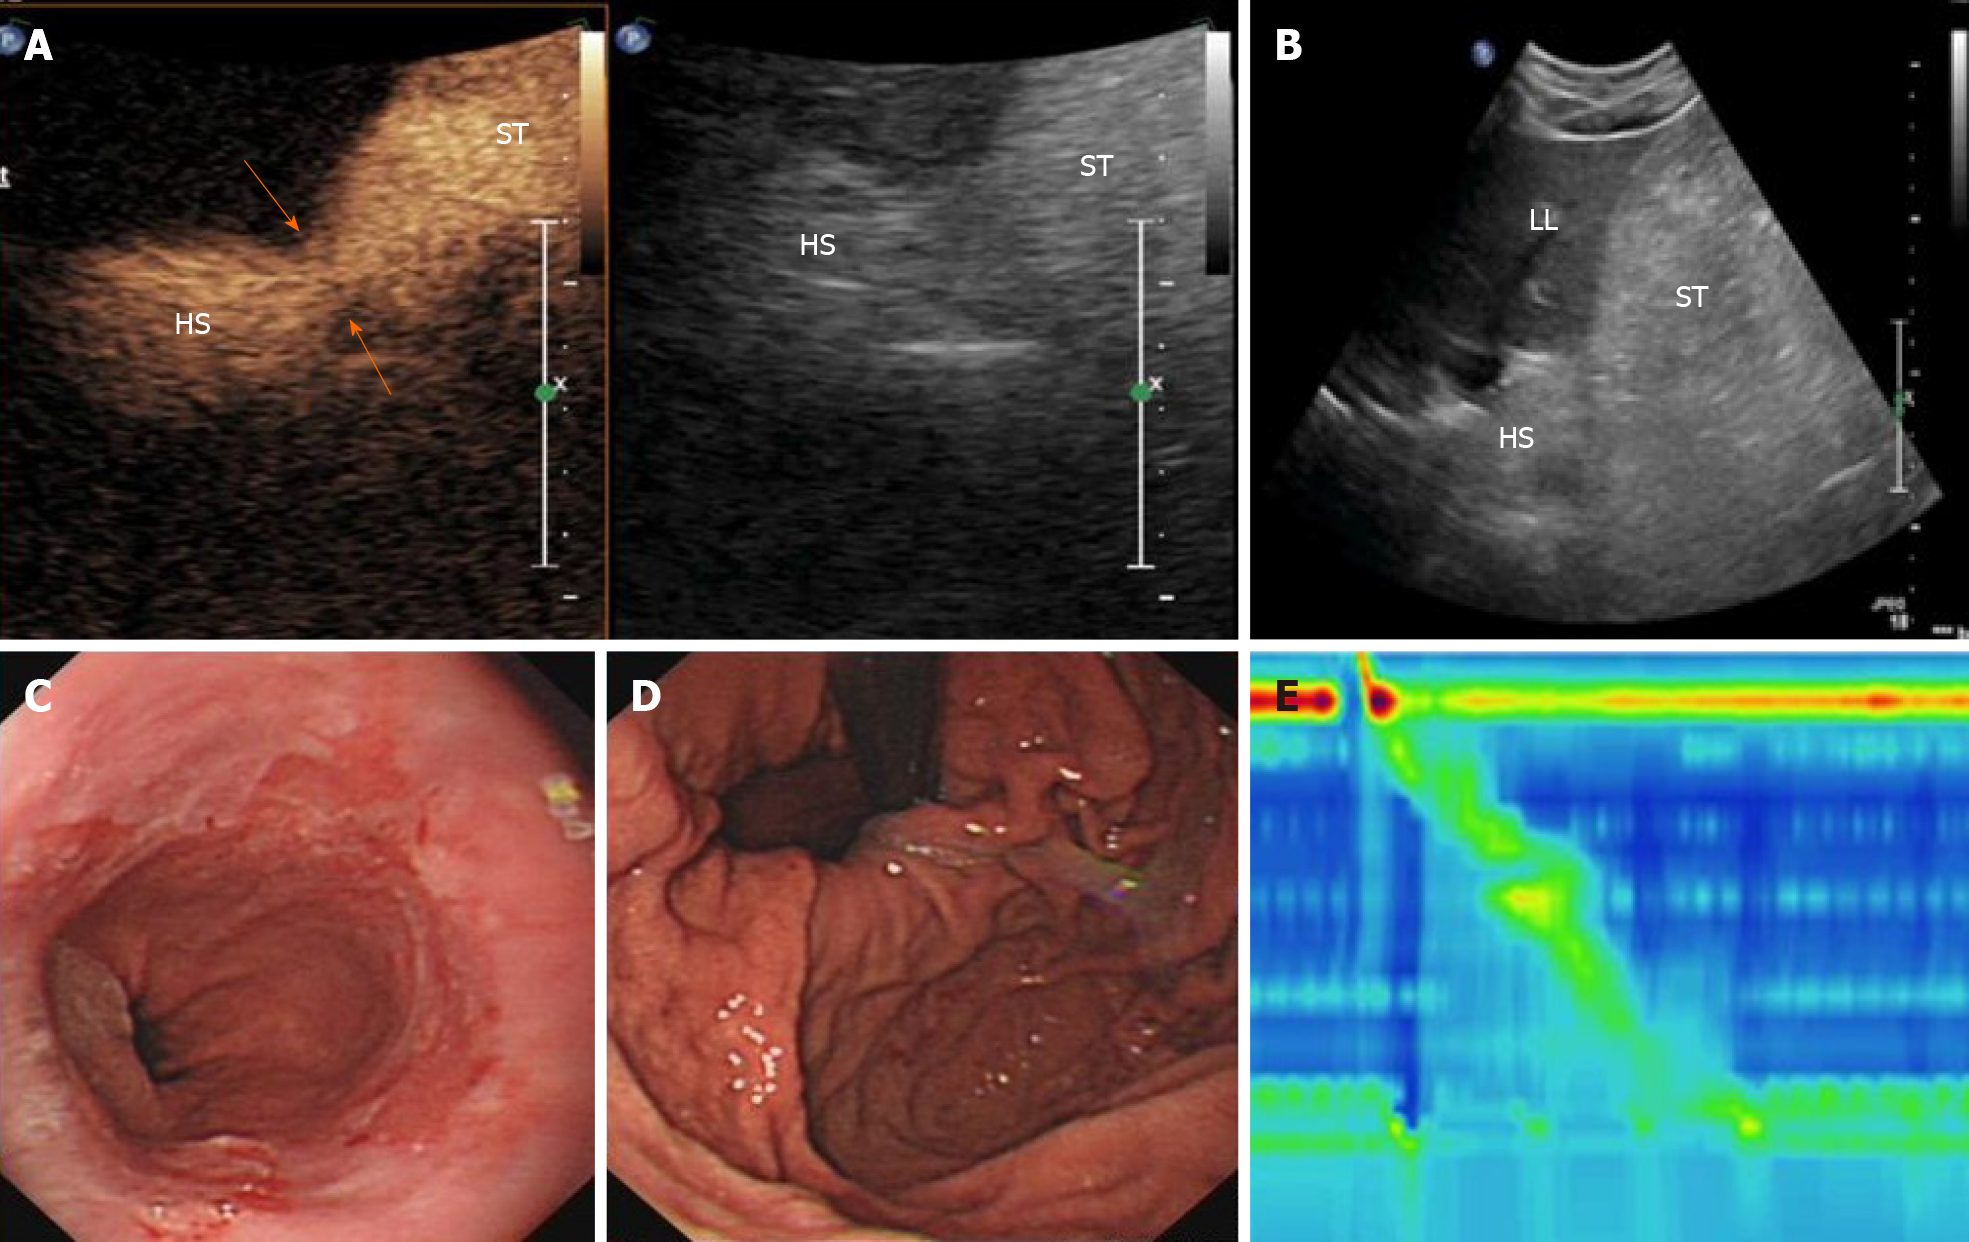
Figure 4 A 46-year-old man with esophageal hiatal hernia.
A: Compared to the gray-scale imaging (right panel), contrast-enhanced ultrasound imaging clearly showed the esophageal hiatus (arrows) and the supradiaphragmatic hernial sac (HS); B: Ultrasound image obtained with conventional oral contrast agent shows the HS; C: Gastroscopic front view showed the reflux esophagitis; D: In the reverse view, the cardia opening was shown to be loosened; E: High-resolution esophageal pressure measurement showed type II esophageal hiatal hernia. HS: Hernial sac; LL: Left liver lobe; ST: Stomach.
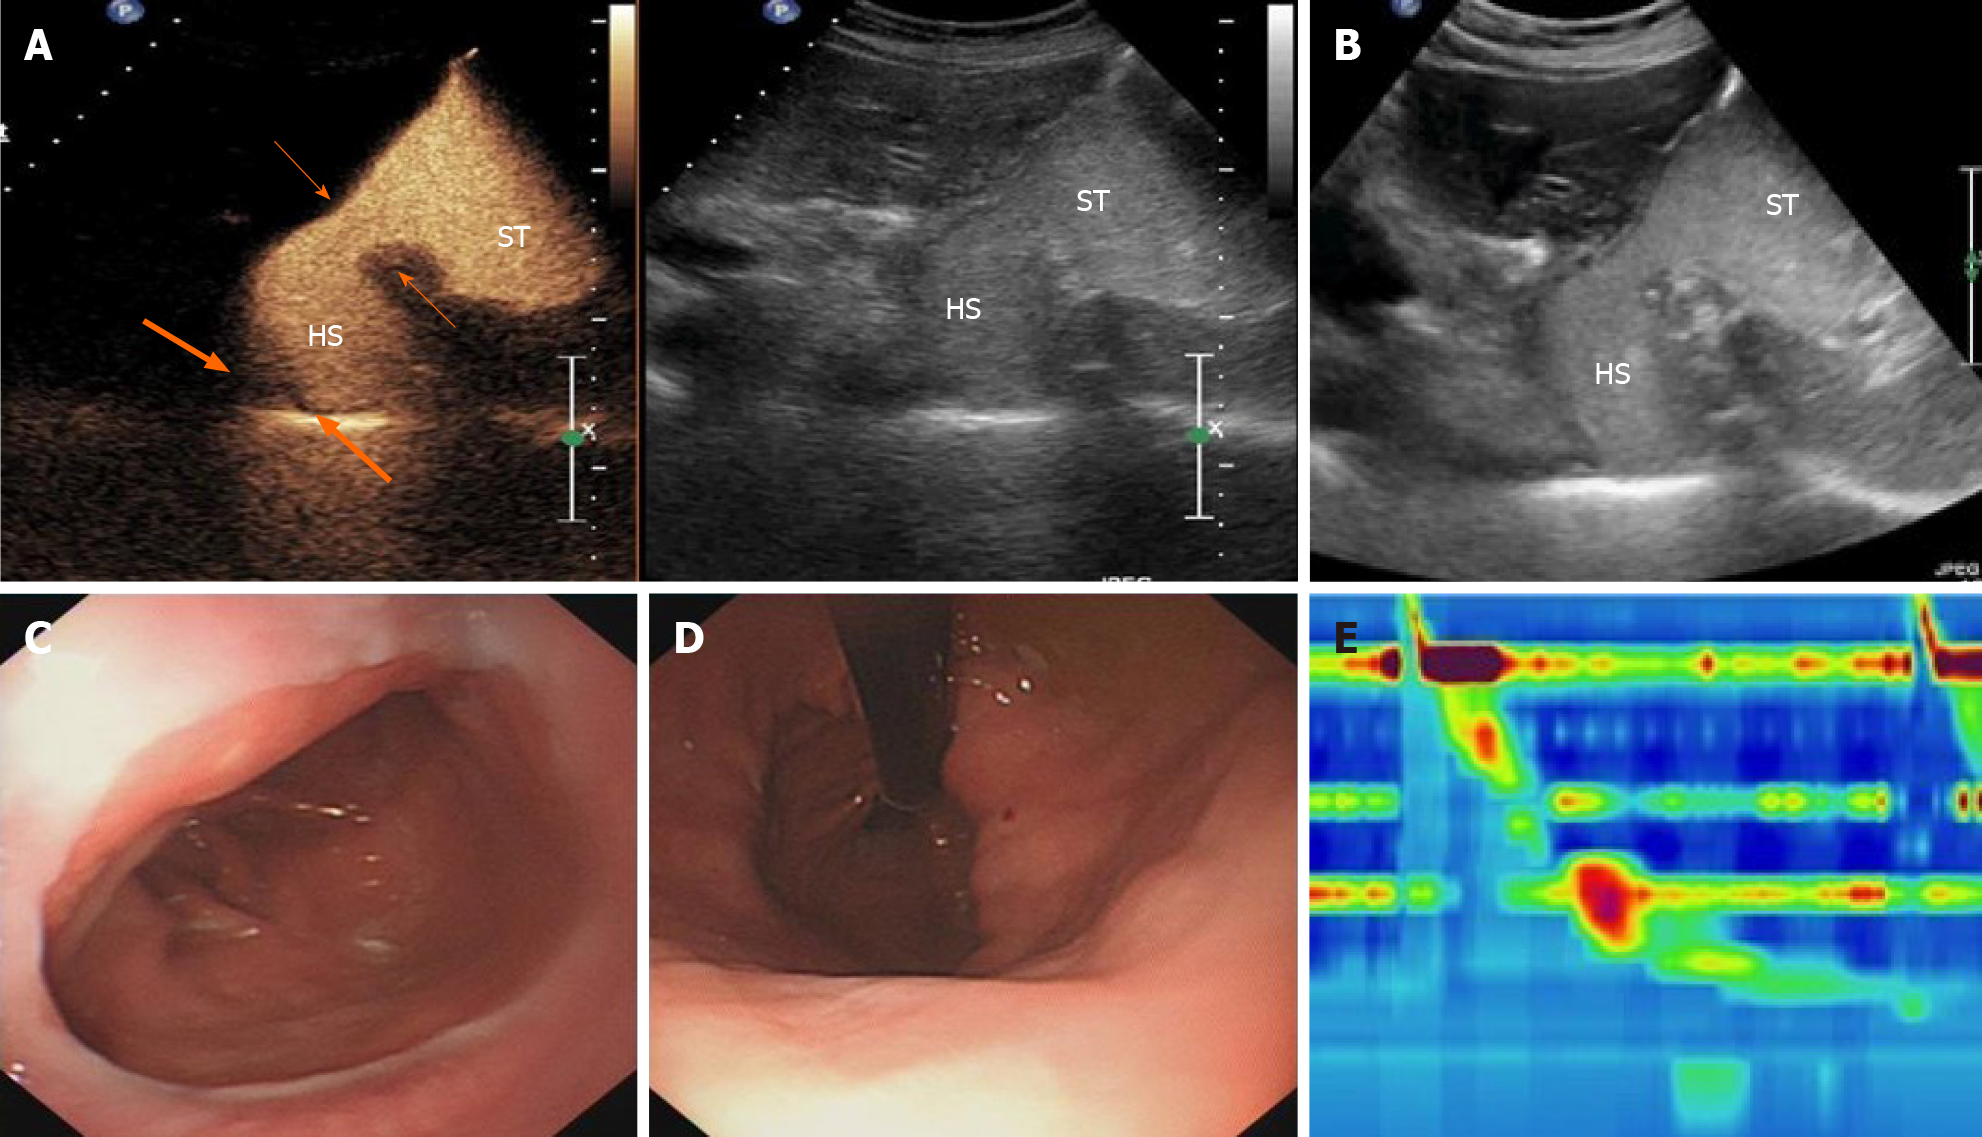
Figure 5 A 78-year-old woman with esophageal hiatal hernia.
A: Compared to the gray-scale imaging (right panel), contrast-enhanced ultrasound imaging clearly showed the esophageal hiatus (large arrows), the supradiaphragmatic hernial sac (HS), and esophagus-gastric echo ring (i.e., the “EG” ring) (small arrows); B: Ultrasound image obtained with conventional oral contrast agent showed the HS; C: Gastroscopic front view showed the dentate line to be shifted upwards and separated from the gastroesophageal junction; D: In the reverse view, the cardia opening was shown to be loosened and the double ring sign was partially visible; E: High-resolution esophageal pressure measurement showed type III esophageal hiatal hernia. HS: Hernial sac; ST: Stomach.
- Citation: Wang JY, Luo Y, Wang WY, Zheng SC, He L, Xie CY, Peng L. Contrast-enhanced ultrasound using SonoVue mixed with oral gastrointestinal contrast agent to evaluate esophageal hiatal hernia: Report of three cases and a literature review. World J Clin Cases 2021; 9(11): 2679-2687
- URL: https://www.wjgnet.com/2307-8960/full/v9/i11/2679.htm
- DOI: https://dx.doi.org/10.12998/wjcc.v9.i11.2679


