Copyright
©The Author(s) 2021.
World J Clin Cases. Apr 16, 2021; 9(11): 2555-2561
Published online Apr 16, 2021. doi: 10.12998/wjcc.v9.i11.2555
Published online Apr 16, 2021. doi: 10.12998/wjcc.v9.i11.2555
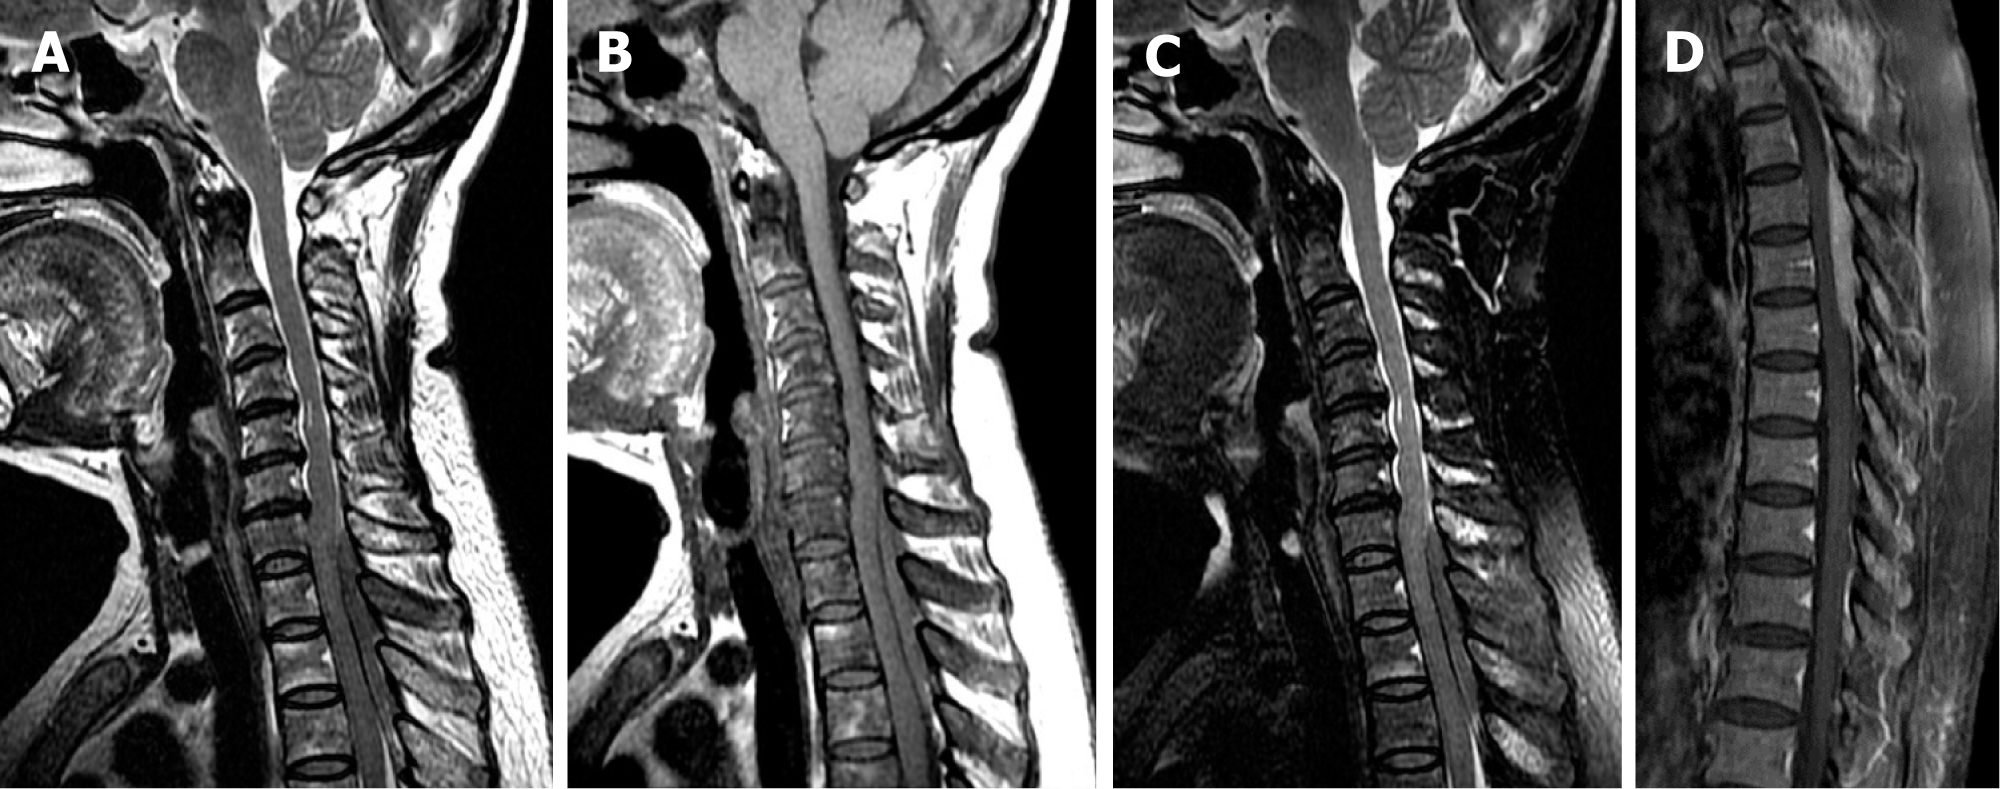
Figure 1 Magnetic resonance imaging showed a posterior spinal epidural mass located from C7 to T3.
A: T1-weighted imaging (T1WI); B: T2-weighted imaging (T2WI); C: T2-weighted fat-saturation imaging; D: Sagittal T1WI of the spine with contrast. The lesion appeared isointense on T1WI, T2WI, and T2-weighted fat-saturation imaging. The spinal cord was significantly compressed, and the dural sac between the mass and spinal cord showed a hypointense signal on all sequences, indicating an extradural tumor location. T1WI showing decreased marrow signal intensity in the vertebrae, suggesting diffuse marrow infiltration. Sagittal T1WI of the spine with contrast showing anterior displacement of the spinal cord with moderate enhancement of the mass.
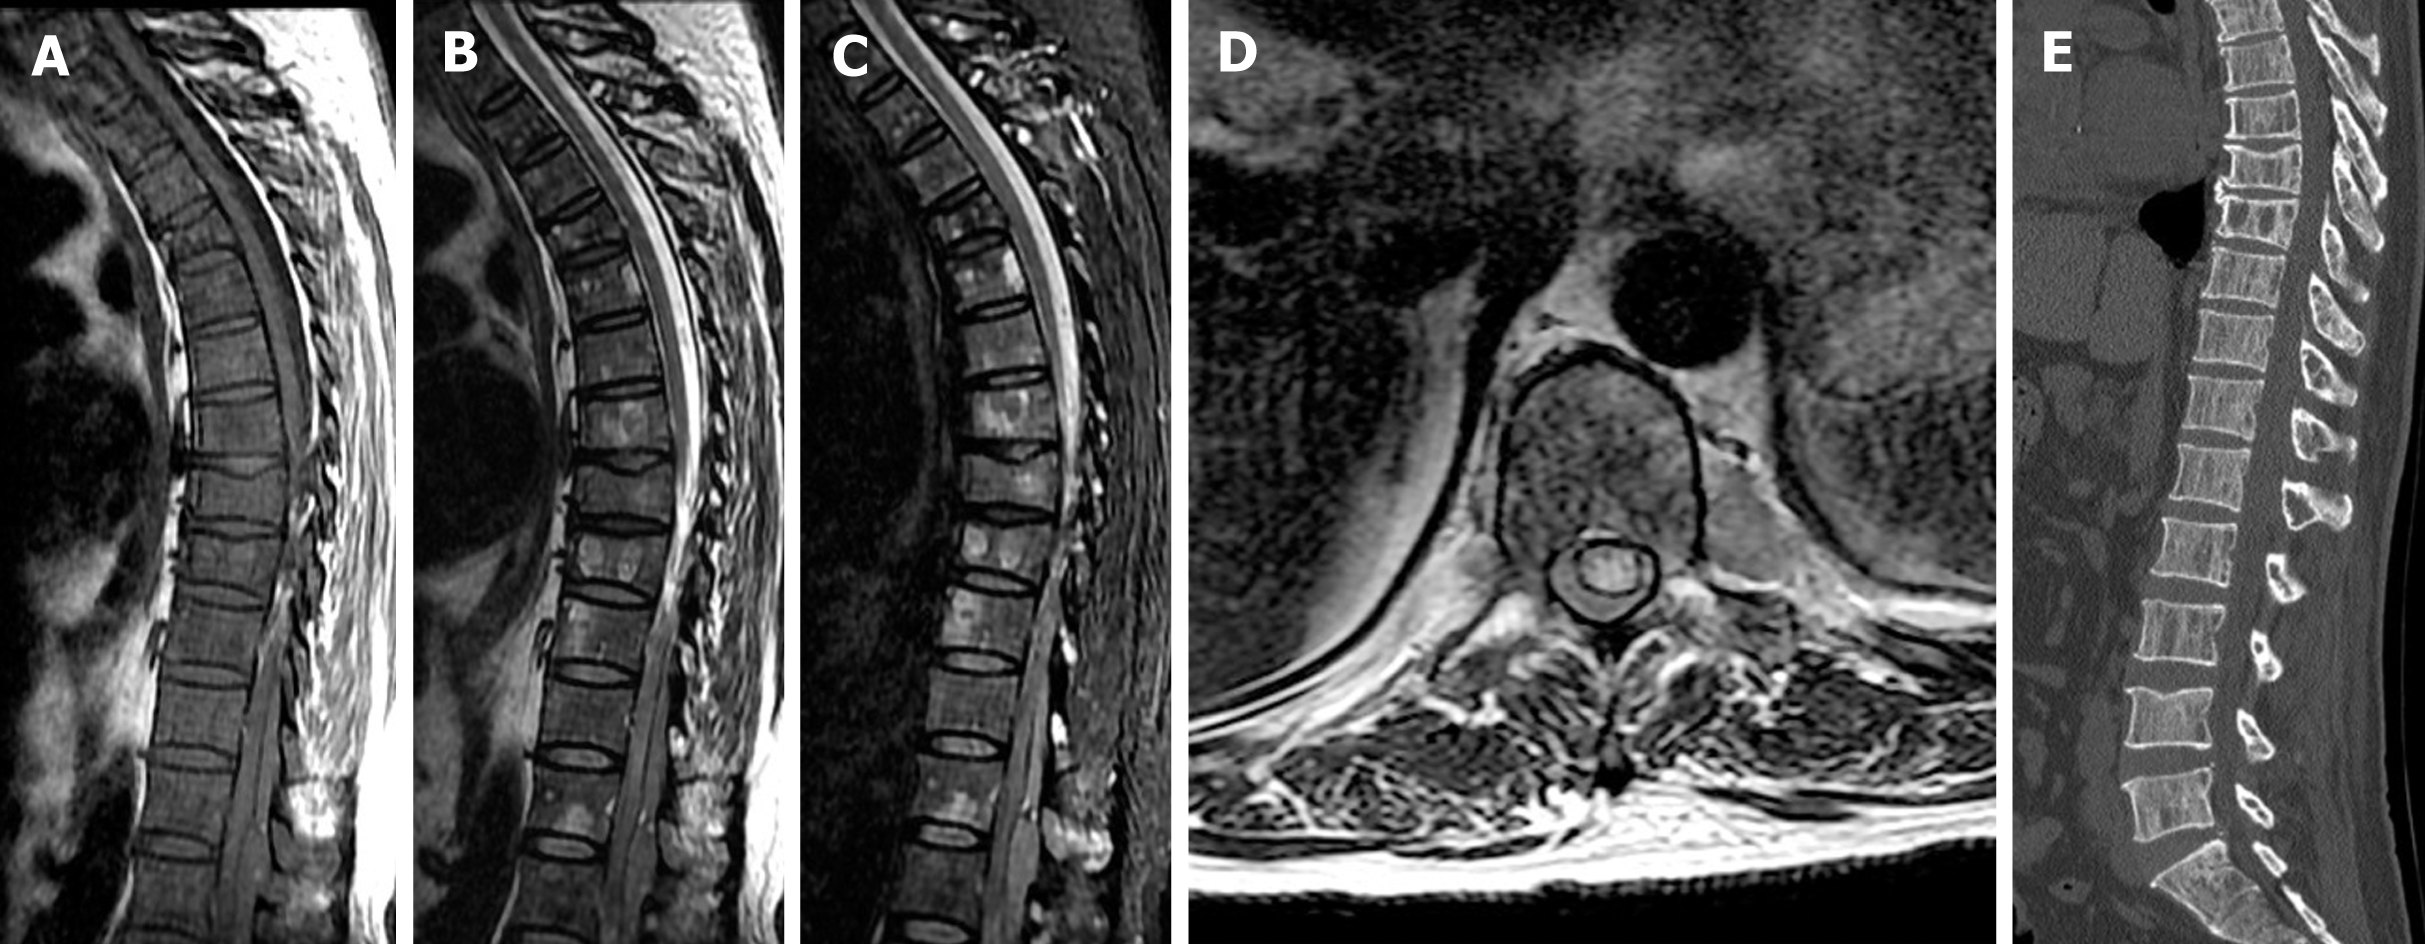
Figure 2 Magnetic resonance imaging showed a posterior epidural mass located from Th11 to L1.
A: Sagittal T1-weighted imaging (T1WI); B: T2-weighted imaging (T2WI); C: T2-weighted fat-saturation imaging; and D: Axial T2WI showing an epidural mass compressing the spinal cord. Diffuse patchy areas of isointense signal on T1WI and slightly hyperintense signal on T2WI were seen in all vertebrae; E: Computed tomography showed multifocal osteolysis and clearly defined cortical margins of the vertebrae from Th11 to L1. The Th8 and Th9 vertebral bodies had collapsed, indicating a compression fracture caused by myeloma-induced bony destruction.
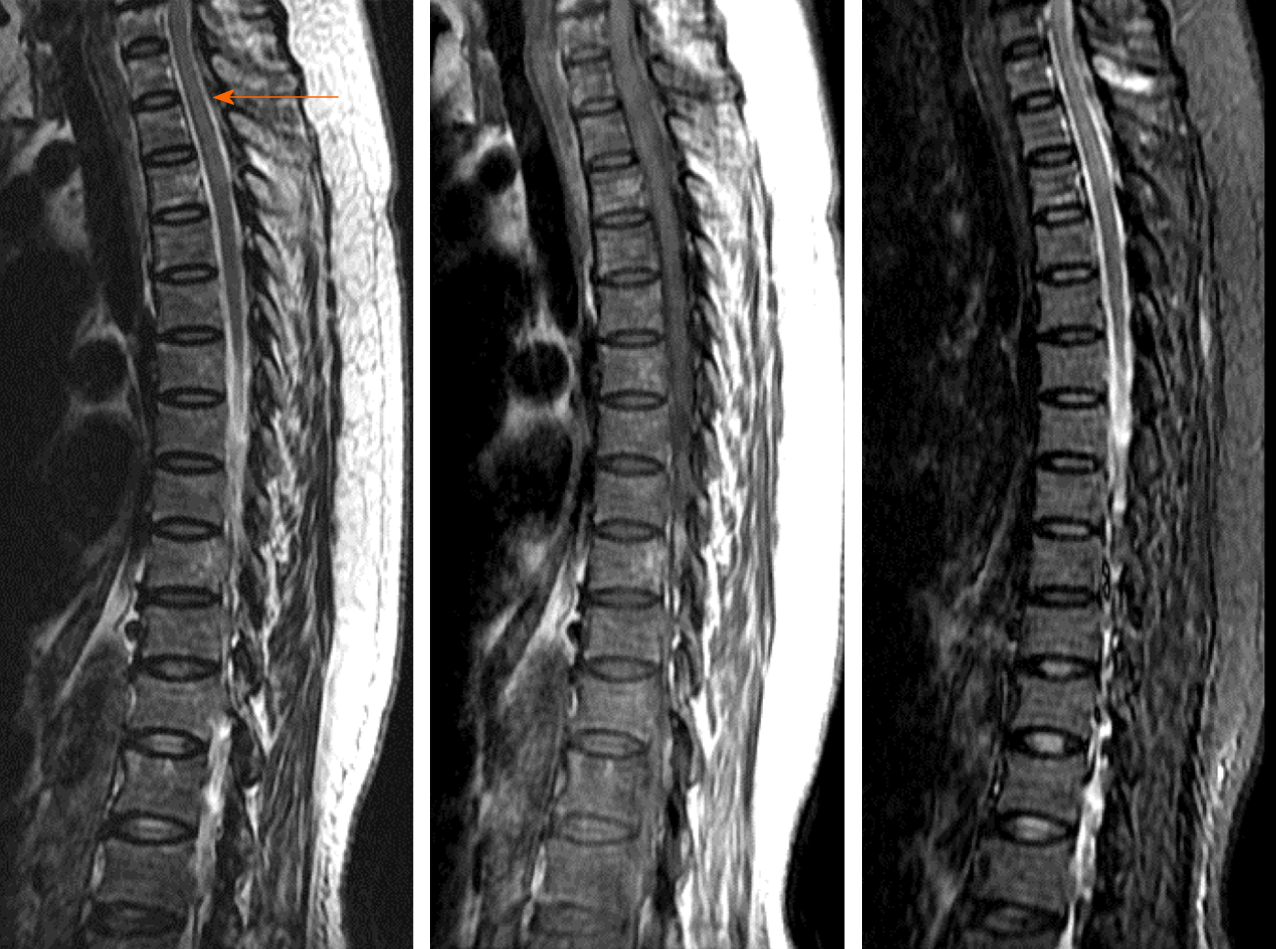
Figure 3 Follow-up magnetic resonance imaging of the patient described in Case 1 after chemotherapy.
The epidural mass size was markedly reduced (arrow) and the subarachnoid space had re-expanded.
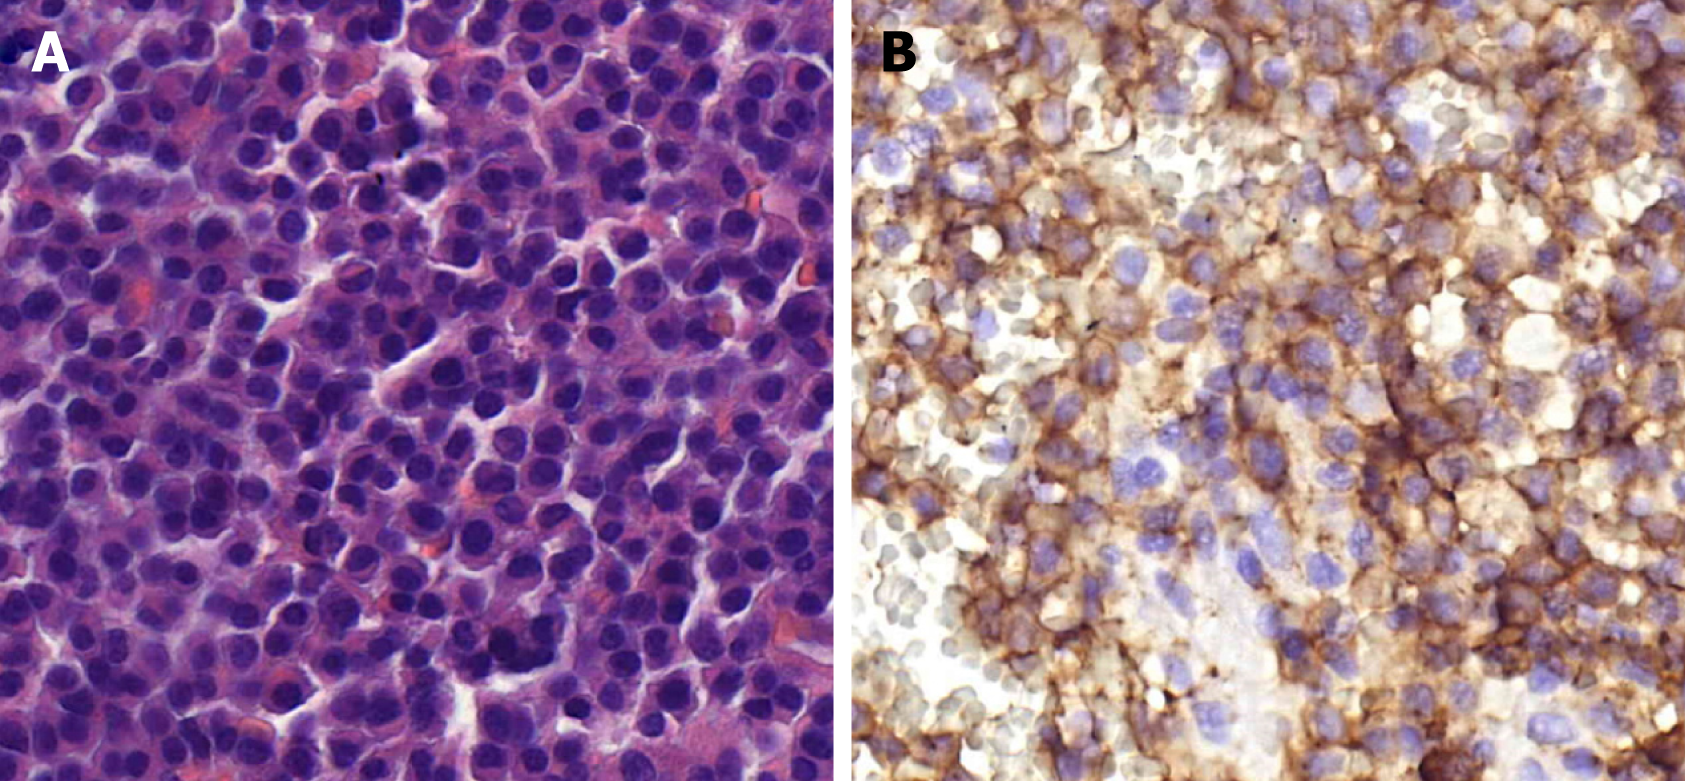
Figure 4 Histological features of the epidural mass in the patient described in Case 2.
A: Histology (hematoxylin and eosin, 400 × magnification) showed sheets of plasma cells with eccentric nuclei, cartwheel chromatin, and abundant cytoplasm with binucleation of some cells; B: Immunohistochemistry staining showed the plasma cells were positive for kappa light chain and cluster of differentiation 138.
- Citation: Cui JF, Sun LL, Liu H, Gao CP. Extraosseous spinal epidural plasmocytoma associated with multiple myeloma: Two case reports. World J Clin Cases 2021; 9(11): 2555-2561
- URL: https://www.wjgnet.com/2307-8960/full/v9/i11/2555.htm
- DOI: https://dx.doi.org/10.12998/wjcc.v9.i11.2555


