Copyright
©The Author(s) 2021.
World J Clin Cases. Apr 16, 2021; 9(11): 2542-2554
Published online Apr 16, 2021. doi: 10.12998/wjcc.v9.i11.2542
Published online Apr 16, 2021. doi: 10.12998/wjcc.v9.i11.2542
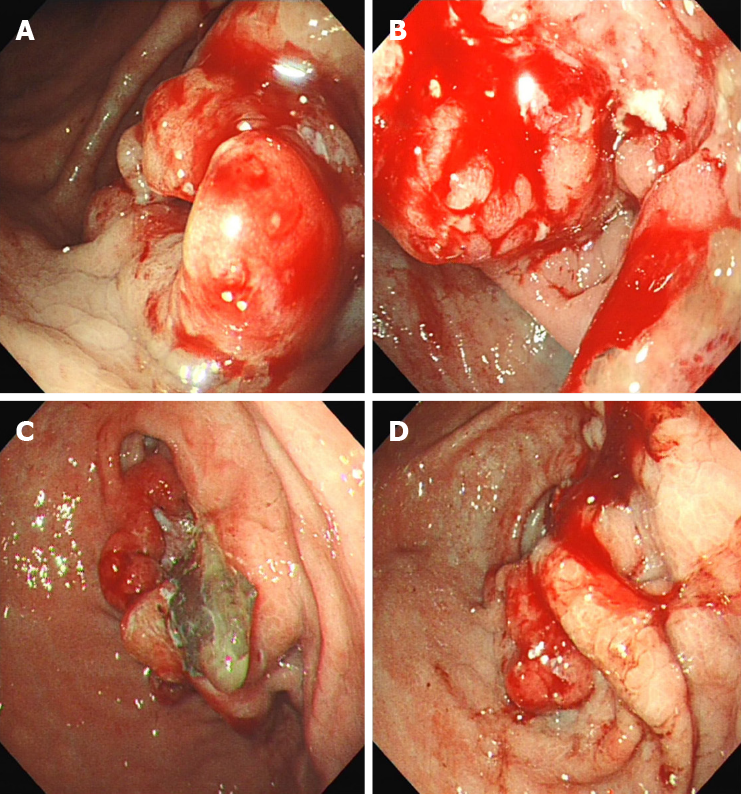
Figure 1 Gastrointestinal fiberscope before chemoradiotherapy showed an ulcerative lesion located surrounding the gastric antrum with ulceration causing stenosis.
A-D: Tumor surface identified from different angles and distances.
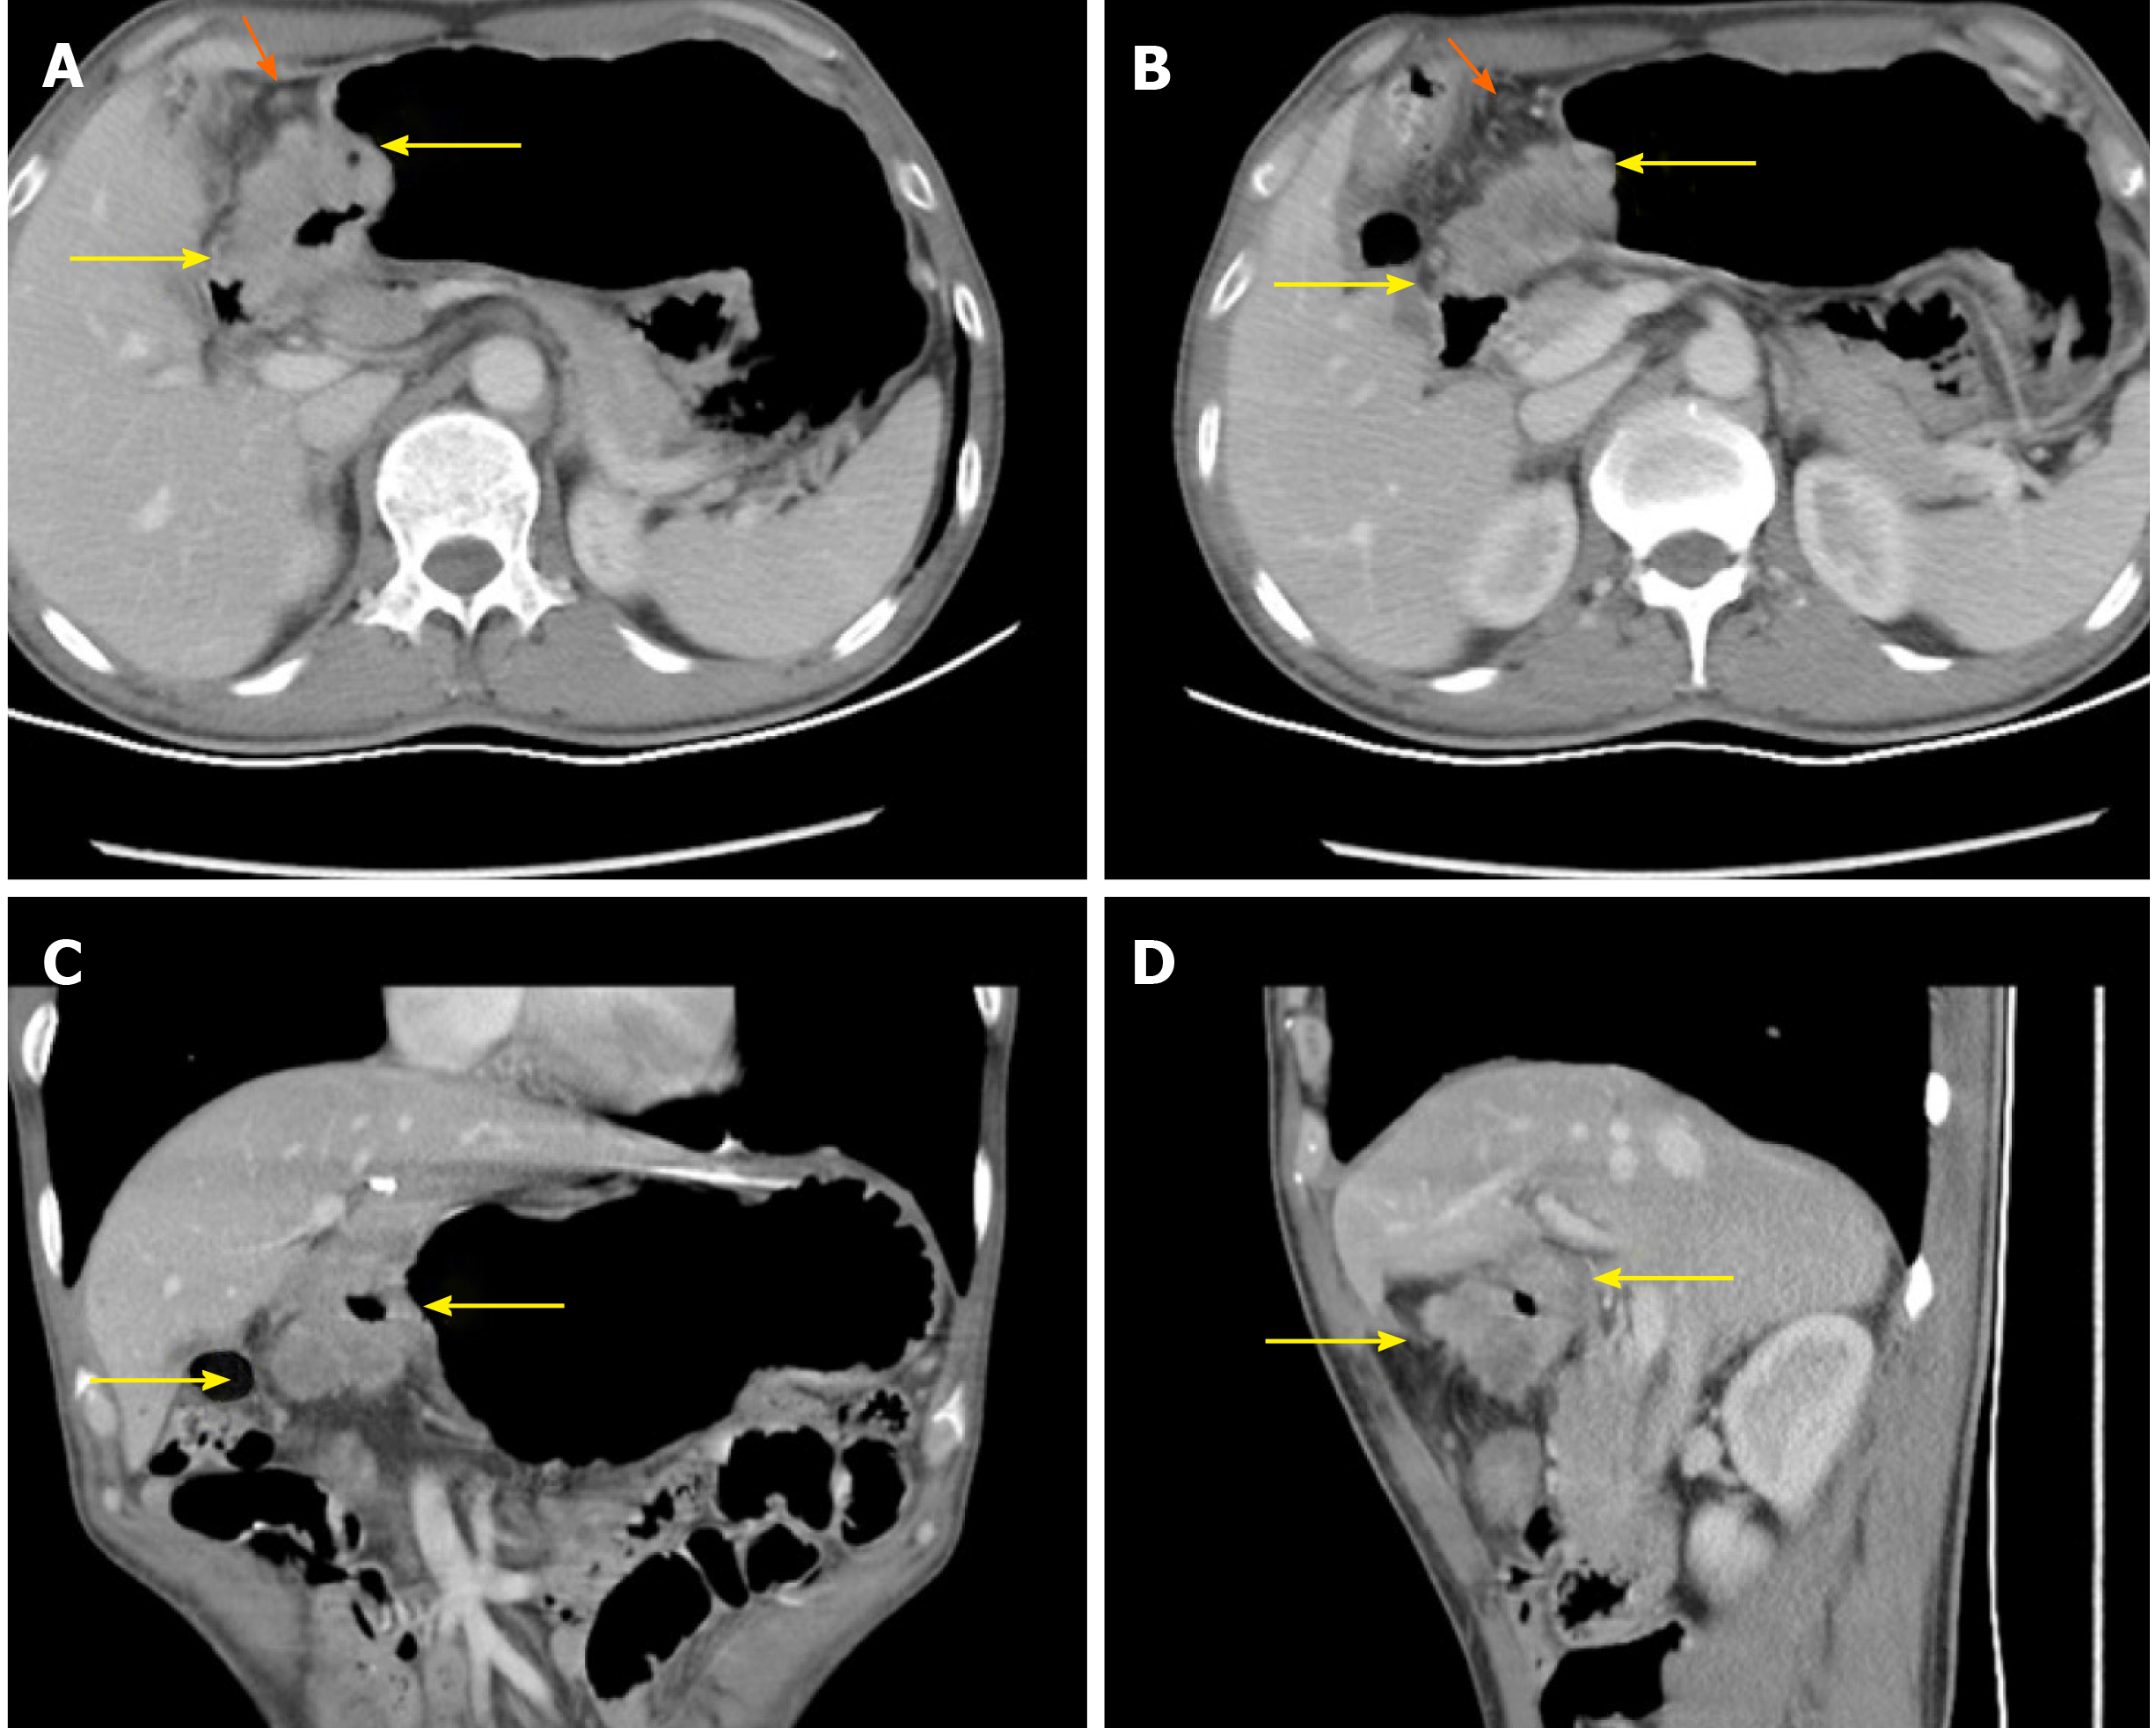
Figure 2 Enhanced abdominal computerized tomography indicated that the wall of the antrum was thickened with significant enhancement.
The surface of serosa was fuzzy, but the border near the pancreas was still clear (yellow arrowheads). Multiple enlarged lymph nodes were found in the lesser gastric curvature (orange arrowheads). A-B: Transverse views of the primary lesion in different layers; C: Coronal view of the primary lesion; D: Sagittal view of the primary lesion.
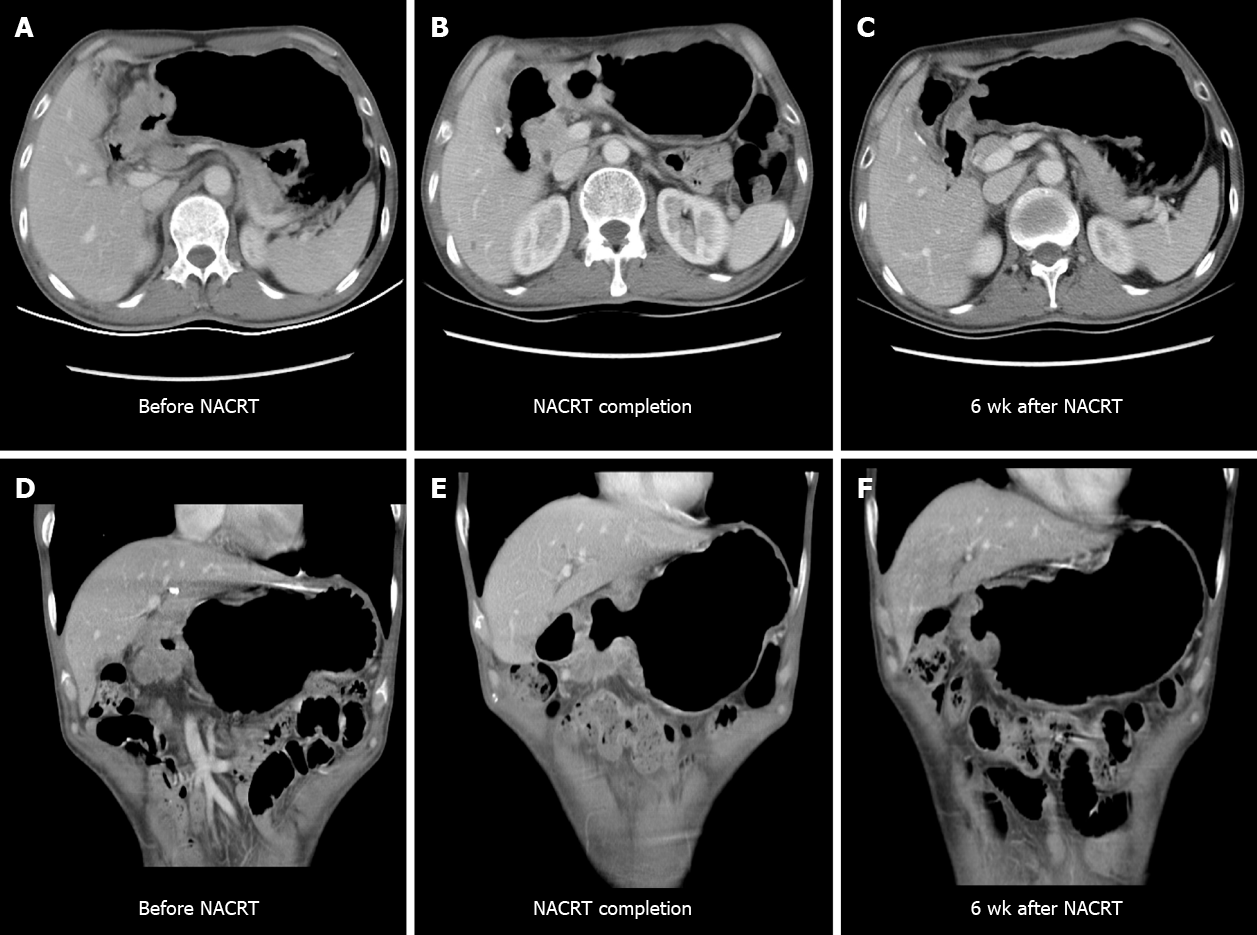
Figure 3 Enhanced abdominal computerized tomography performed before, immediately after, and 6 wk after neoadjuvant chemoradiotherapy to evaluate the response to neoadjuvant chemoradiotherapy.
Imaging after neoadjuvant chemoradiotherapy (NACRT) imaging revealed maximum thickness change from 21 mm to 12 mm (shrinking 42.9%) with lymph nodes (diameter 7 mm) in the great curvature shrinking so obviously that they could not be clearly detected in the computed tomography, but the surface of serosa was still fuzzy. The computed tomography 6 wk after neoadjuvant chemotherapy indicated a change from 12 mm to 10 mm (shrinking 16.7%) with no obviously enlarged lymph nodes around the stomach, retroperitoneal area, or pelvis. A-C: Transverse views of the lesion's change from pre-NACRT to post-NACRT; D-E: Coronal views of the lesion's change from pre-NACRT to post-NACRT.
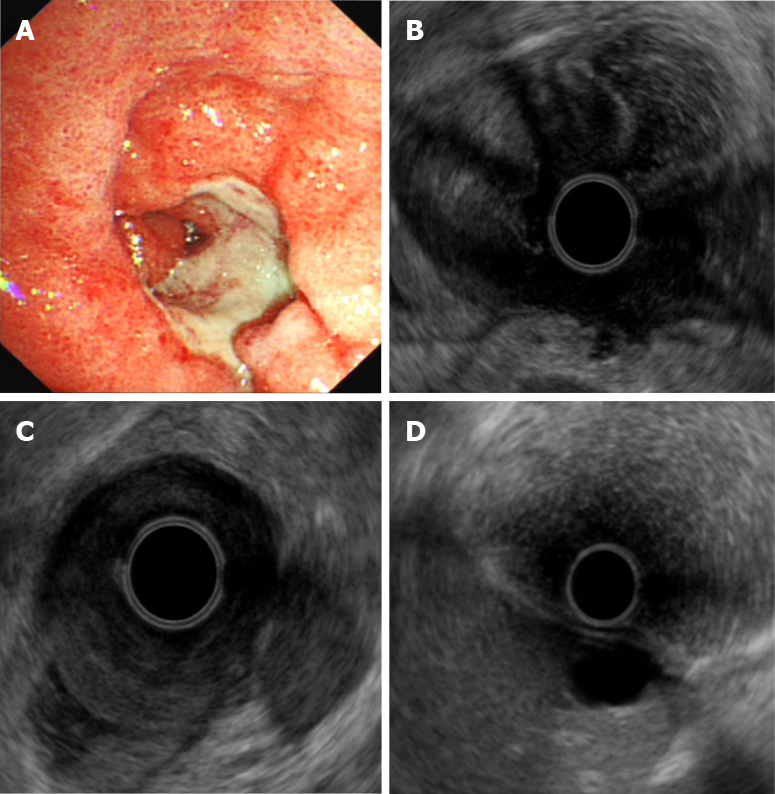
Figure 4 Endoscopic ultrasound was also applied to evaluate the response to neoadjuvant chemoradiotherapy, indicating that the ulcerative lesion location surrounded the gastric antrum with pyloric stenosis.
A: Endoscopic view of the posttreatment lesion; B-D: Endoscopic ultrasound image of post-treatment lesion.
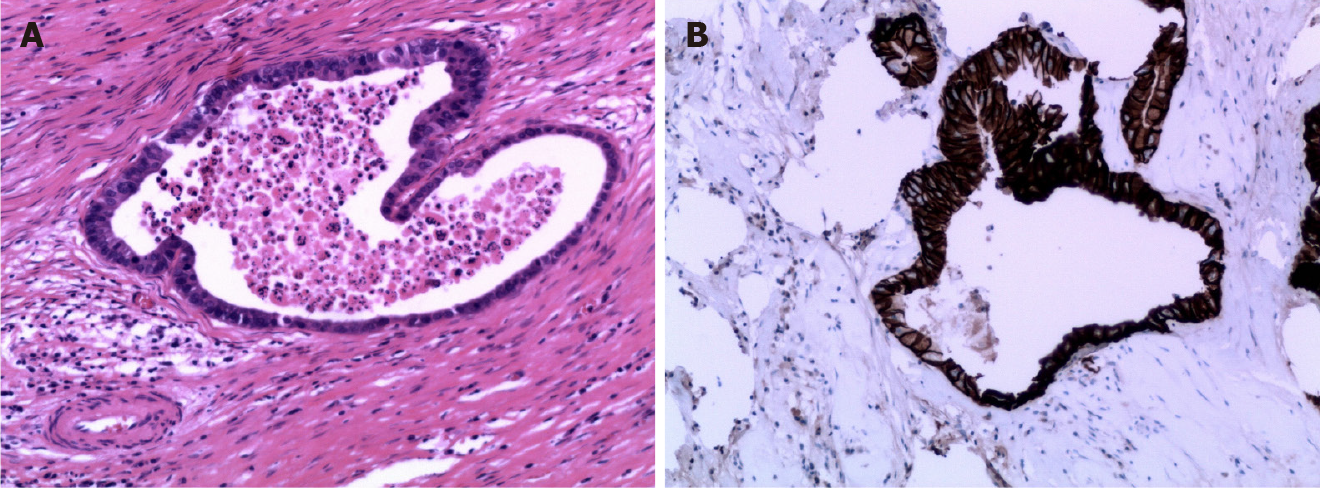
Figure 5 Postoperative pathological evaluation showed that the pathological stage after neoadjuvant chemoradiotherapy was T3N0M0, with necrosis rate > 90%.
A: Hematoxylin and eosin stain; B: Human epidermal growth factor receptor 2 immunohistochemical stain highlights carcinoma cells (stained brown).
- Citation: Liu ZN, Wang YK, Li ZY. Neoadjuvant chemoradiotherapy followed by laparoscopic distal gastrectomy in advanced gastric cancer: A case report and review of literature. World J Clin Cases 2021; 9(11): 2542-2554
- URL: https://www.wjgnet.com/2307-8960/full/v9/i11/2542.htm
- DOI: https://dx.doi.org/10.12998/wjcc.v9.i11.2542


