Copyright
©The Author(s) 2021.
World J Clin Cases. Apr 16, 2021; 9(11): 2487-2502
Published online Apr 16, 2021. doi: 10.12998/wjcc.v9.i11.2487
Published online Apr 16, 2021. doi: 10.12998/wjcc.v9.i11.2487
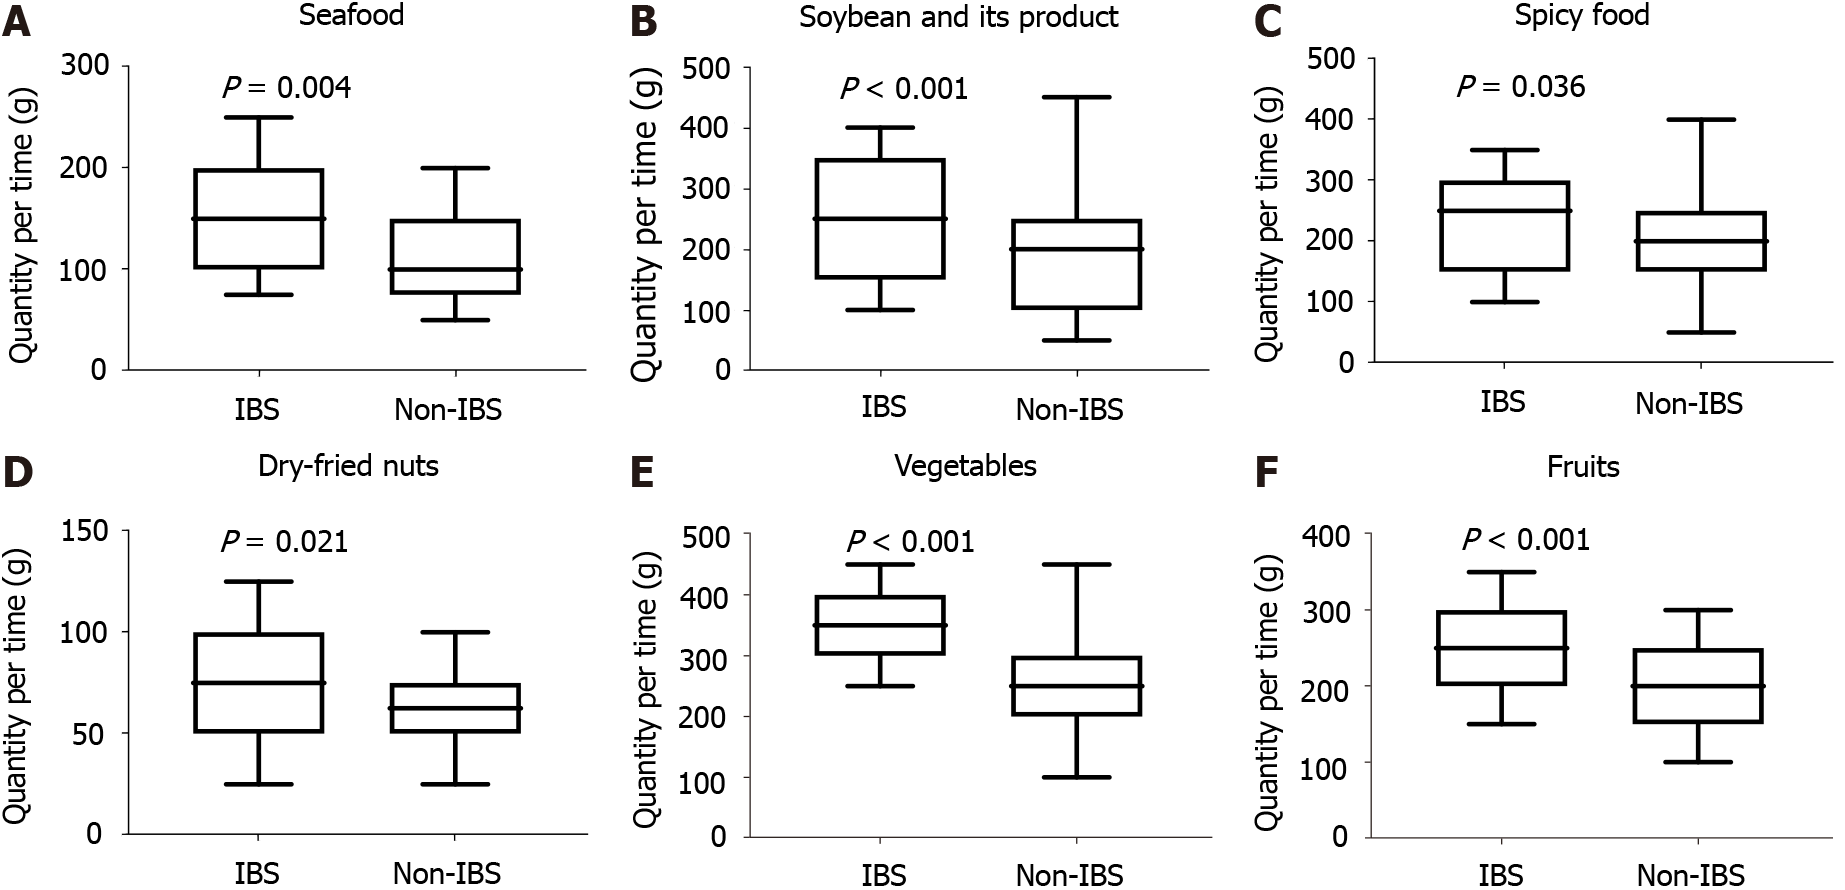
Figure 1 Comparison of quantity per time between irritable bowel syndrome patients and non-irritable bowel syndrome participants.
A: Seafood; B: Soybean and its products; C: Spicy food; D: Dry-fried nuts; E: Vegetables; F: Fruits. All P < 0.05 vs controls. IBS: Irritable bowel syndrome.
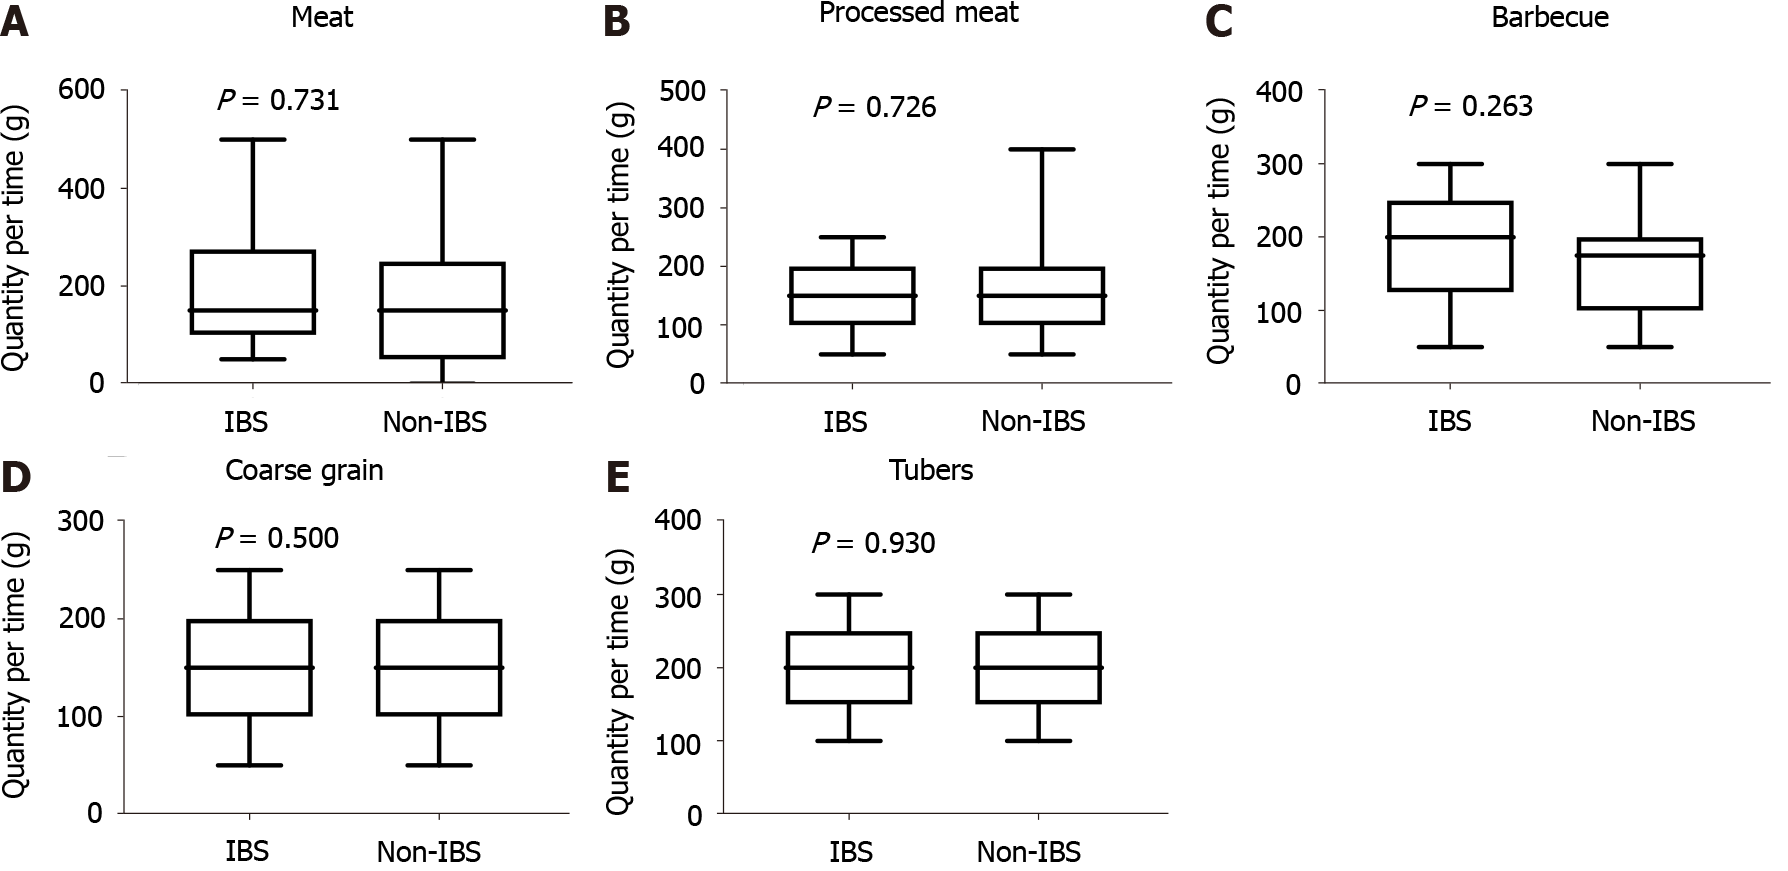
Figure 2 Comparison of quantity per time between irritable bowel syndrome patients and non-irritable bowel syndrome participants.
A: Meat; B: Processed meat; C: Barbecue; D: Coarse grain; E: Tubers. All P > 0.05 vs controls. IBS: Irritable bowel syndrome.
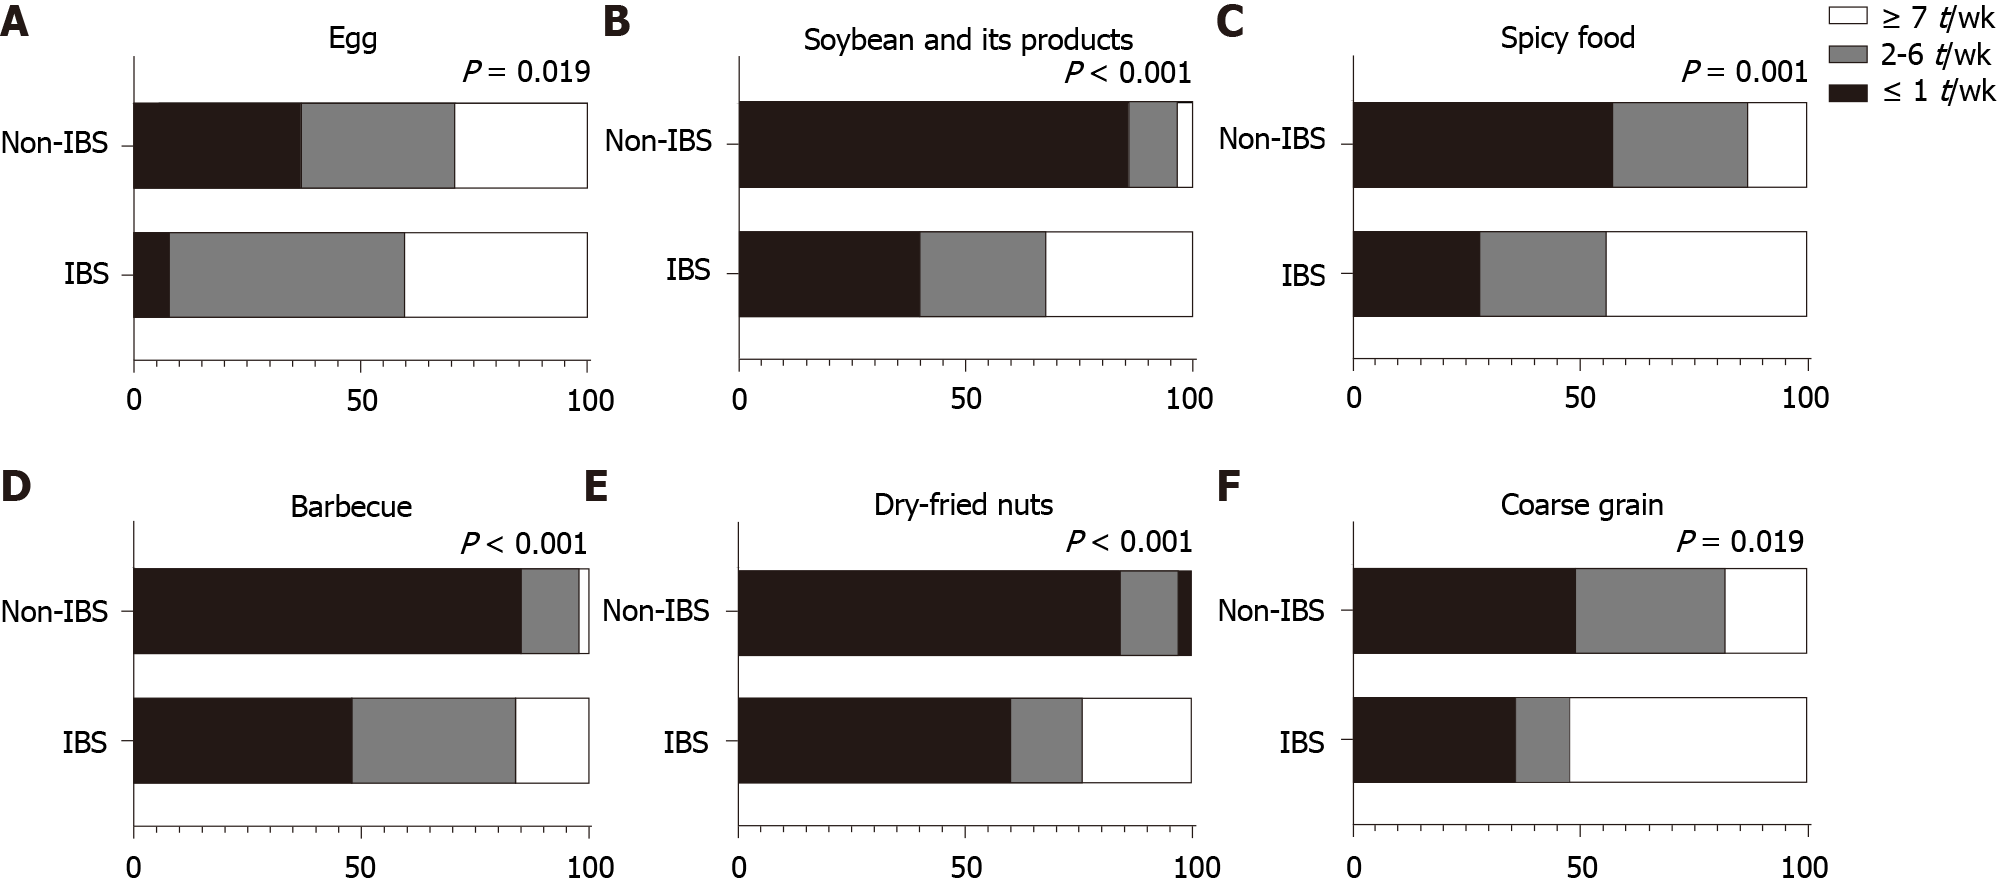
Figure 3 Comparison of intake frequency between irritable bowel syndrome patients and non-irritable bowel syndrome participants.
A: Egg; B: Soybean and its products; C: Spicy food; D: Barbecue; E: Dry-fried nuts; F: Coarse grain. All P < 0.05 vs controls. IBS: Irritable bowel syndrome.
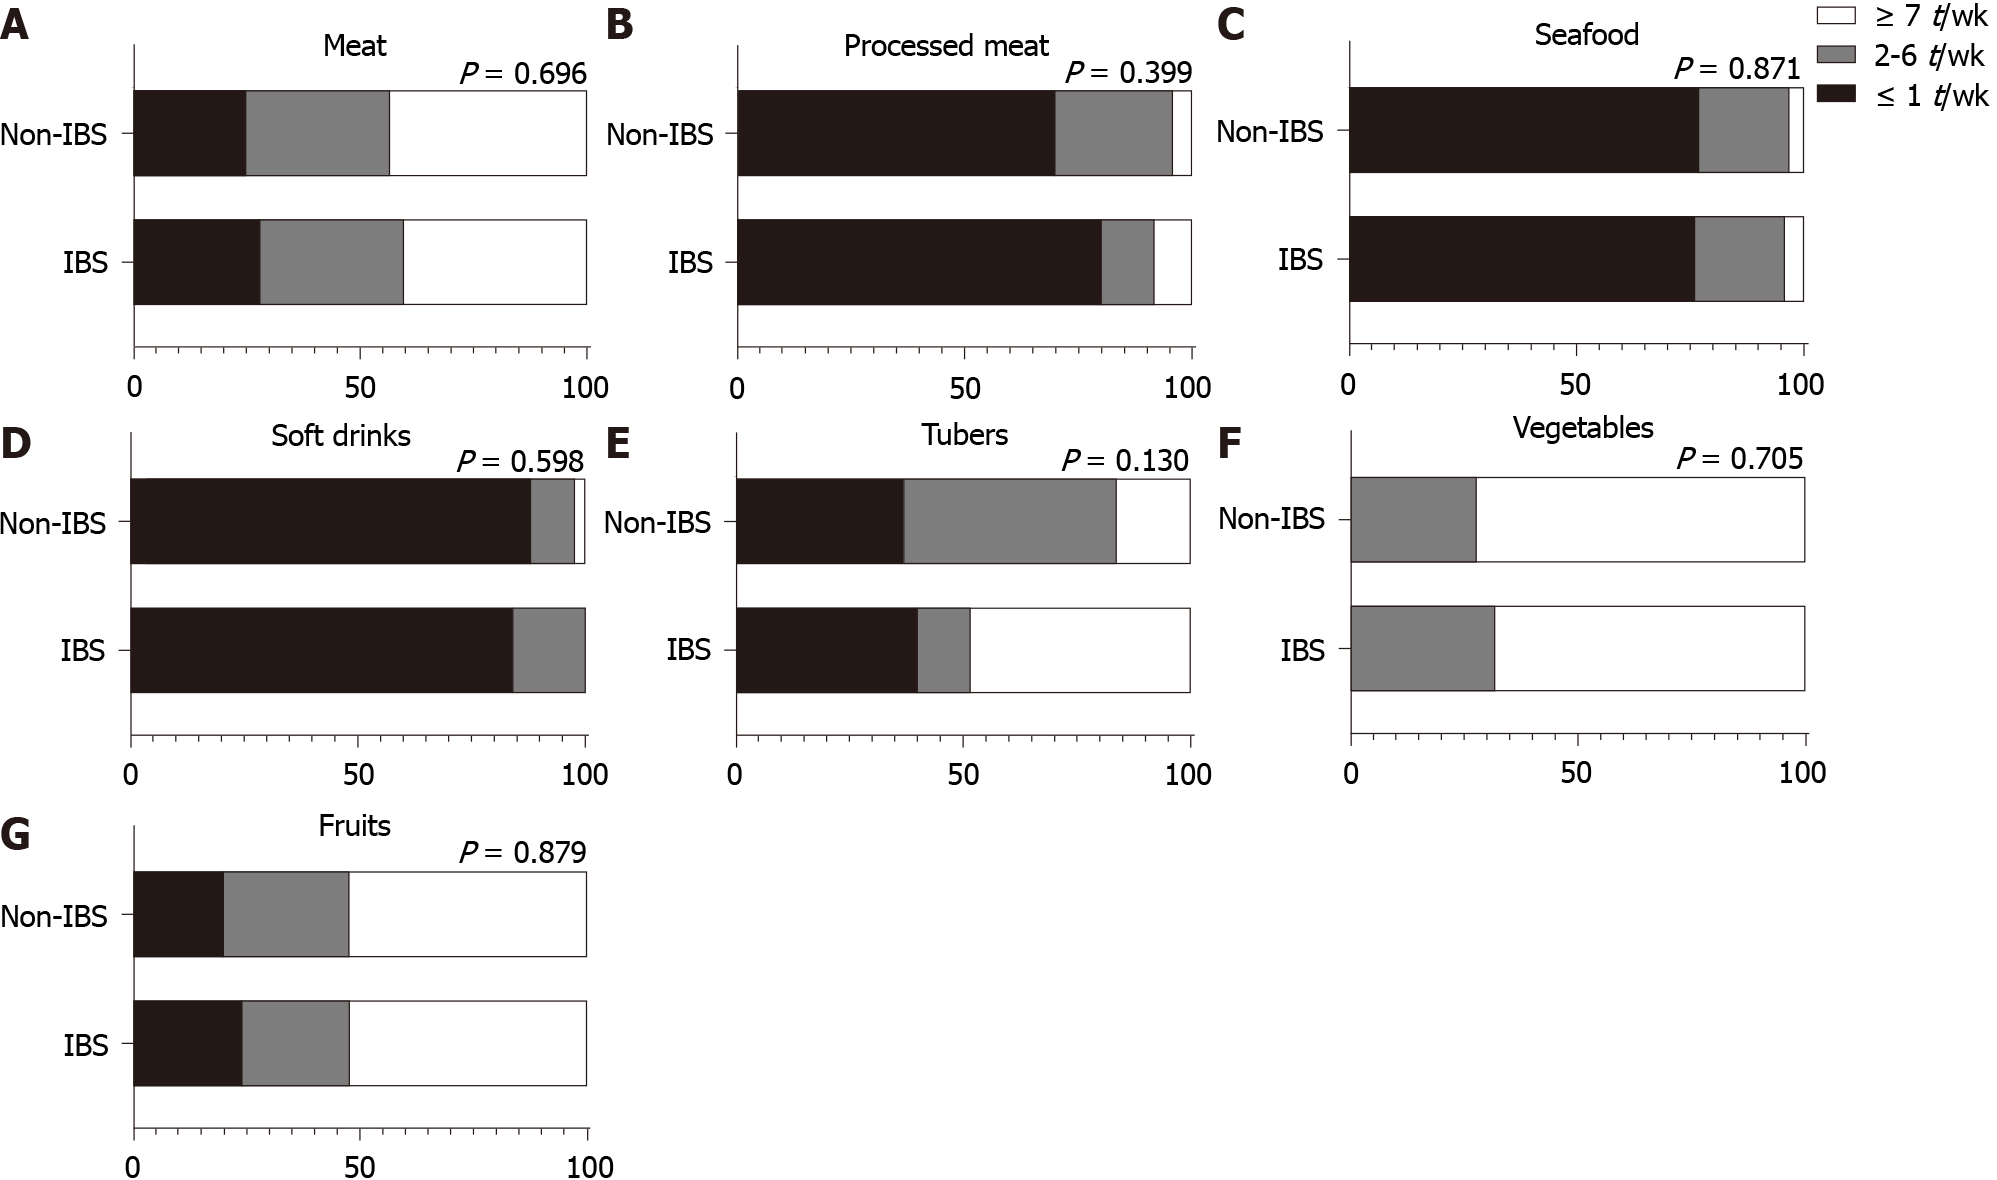
Figure 4 Comparison of intake frequency between irritable bowel syndrome patients and non-irritable bowel syndrome participants.
A: Meat; B: Processed meat; C: Seafood; D: Soft drinks; E: Tubers; F: Vegetables; G: Fruits. All P > 0.05 vs controls. IBS: Irritable bowel syndrome.
- Citation: Meng Q, Qin G, Yao SK, Fan GH, Dong F, Tan C. Differences in dietary habits of people with vs without irritable bowel syndrome and their association with symptom and psychological status: A pilot study. World J Clin Cases 2021; 9(11): 2487-2502
- URL: https://www.wjgnet.com/2307-8960/full/v9/i11/2487.htm
- DOI: https://dx.doi.org/10.12998/wjcc.v9.i11.2487


