Copyright
©The Author(s) 2021.
World J Clin Cases. Apr 6, 2021; 9(10): 2352-2356
Published online Apr 6, 2021. doi: 10.12998/wjcc.v9.i10.2352
Published online Apr 6, 2021. doi: 10.12998/wjcc.v9.i10.2352
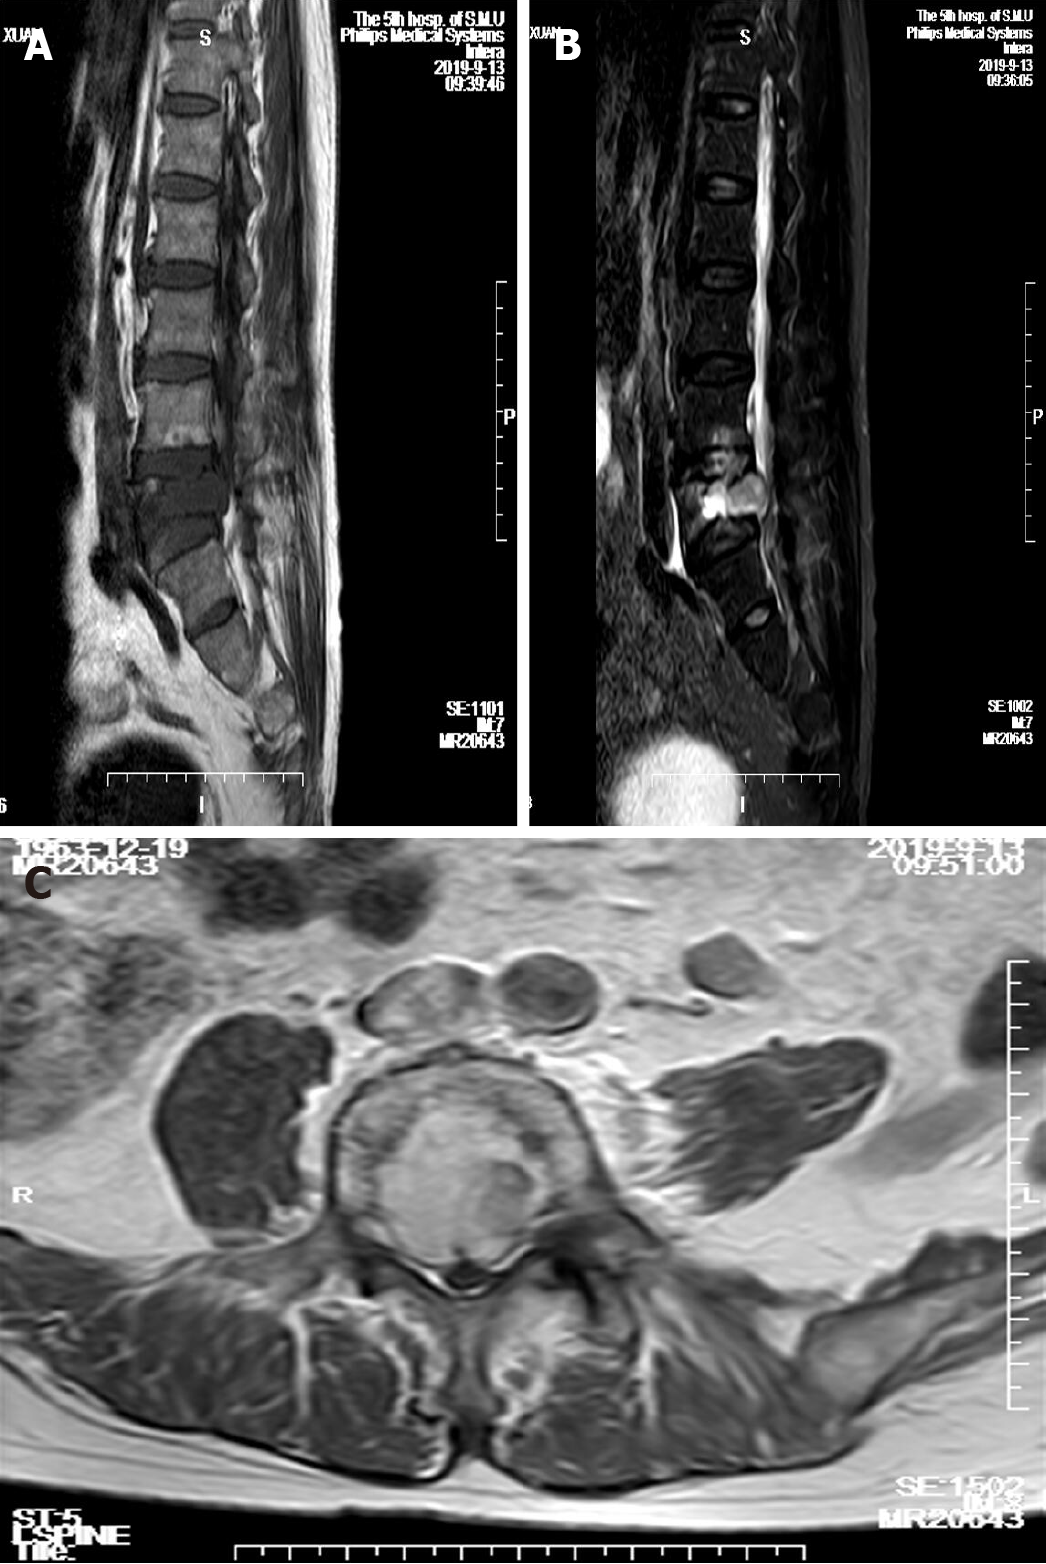
Figure 1 Magnetic resonance imaging analysis of spinal cord lesion.
A: Sagittal T1-weighted magnetic resonance imaging (MRI); B: Sagittal T2-weighted MRI; C: Homogeneous contrast enhancement on axial T1-weighted images with gadolinium.
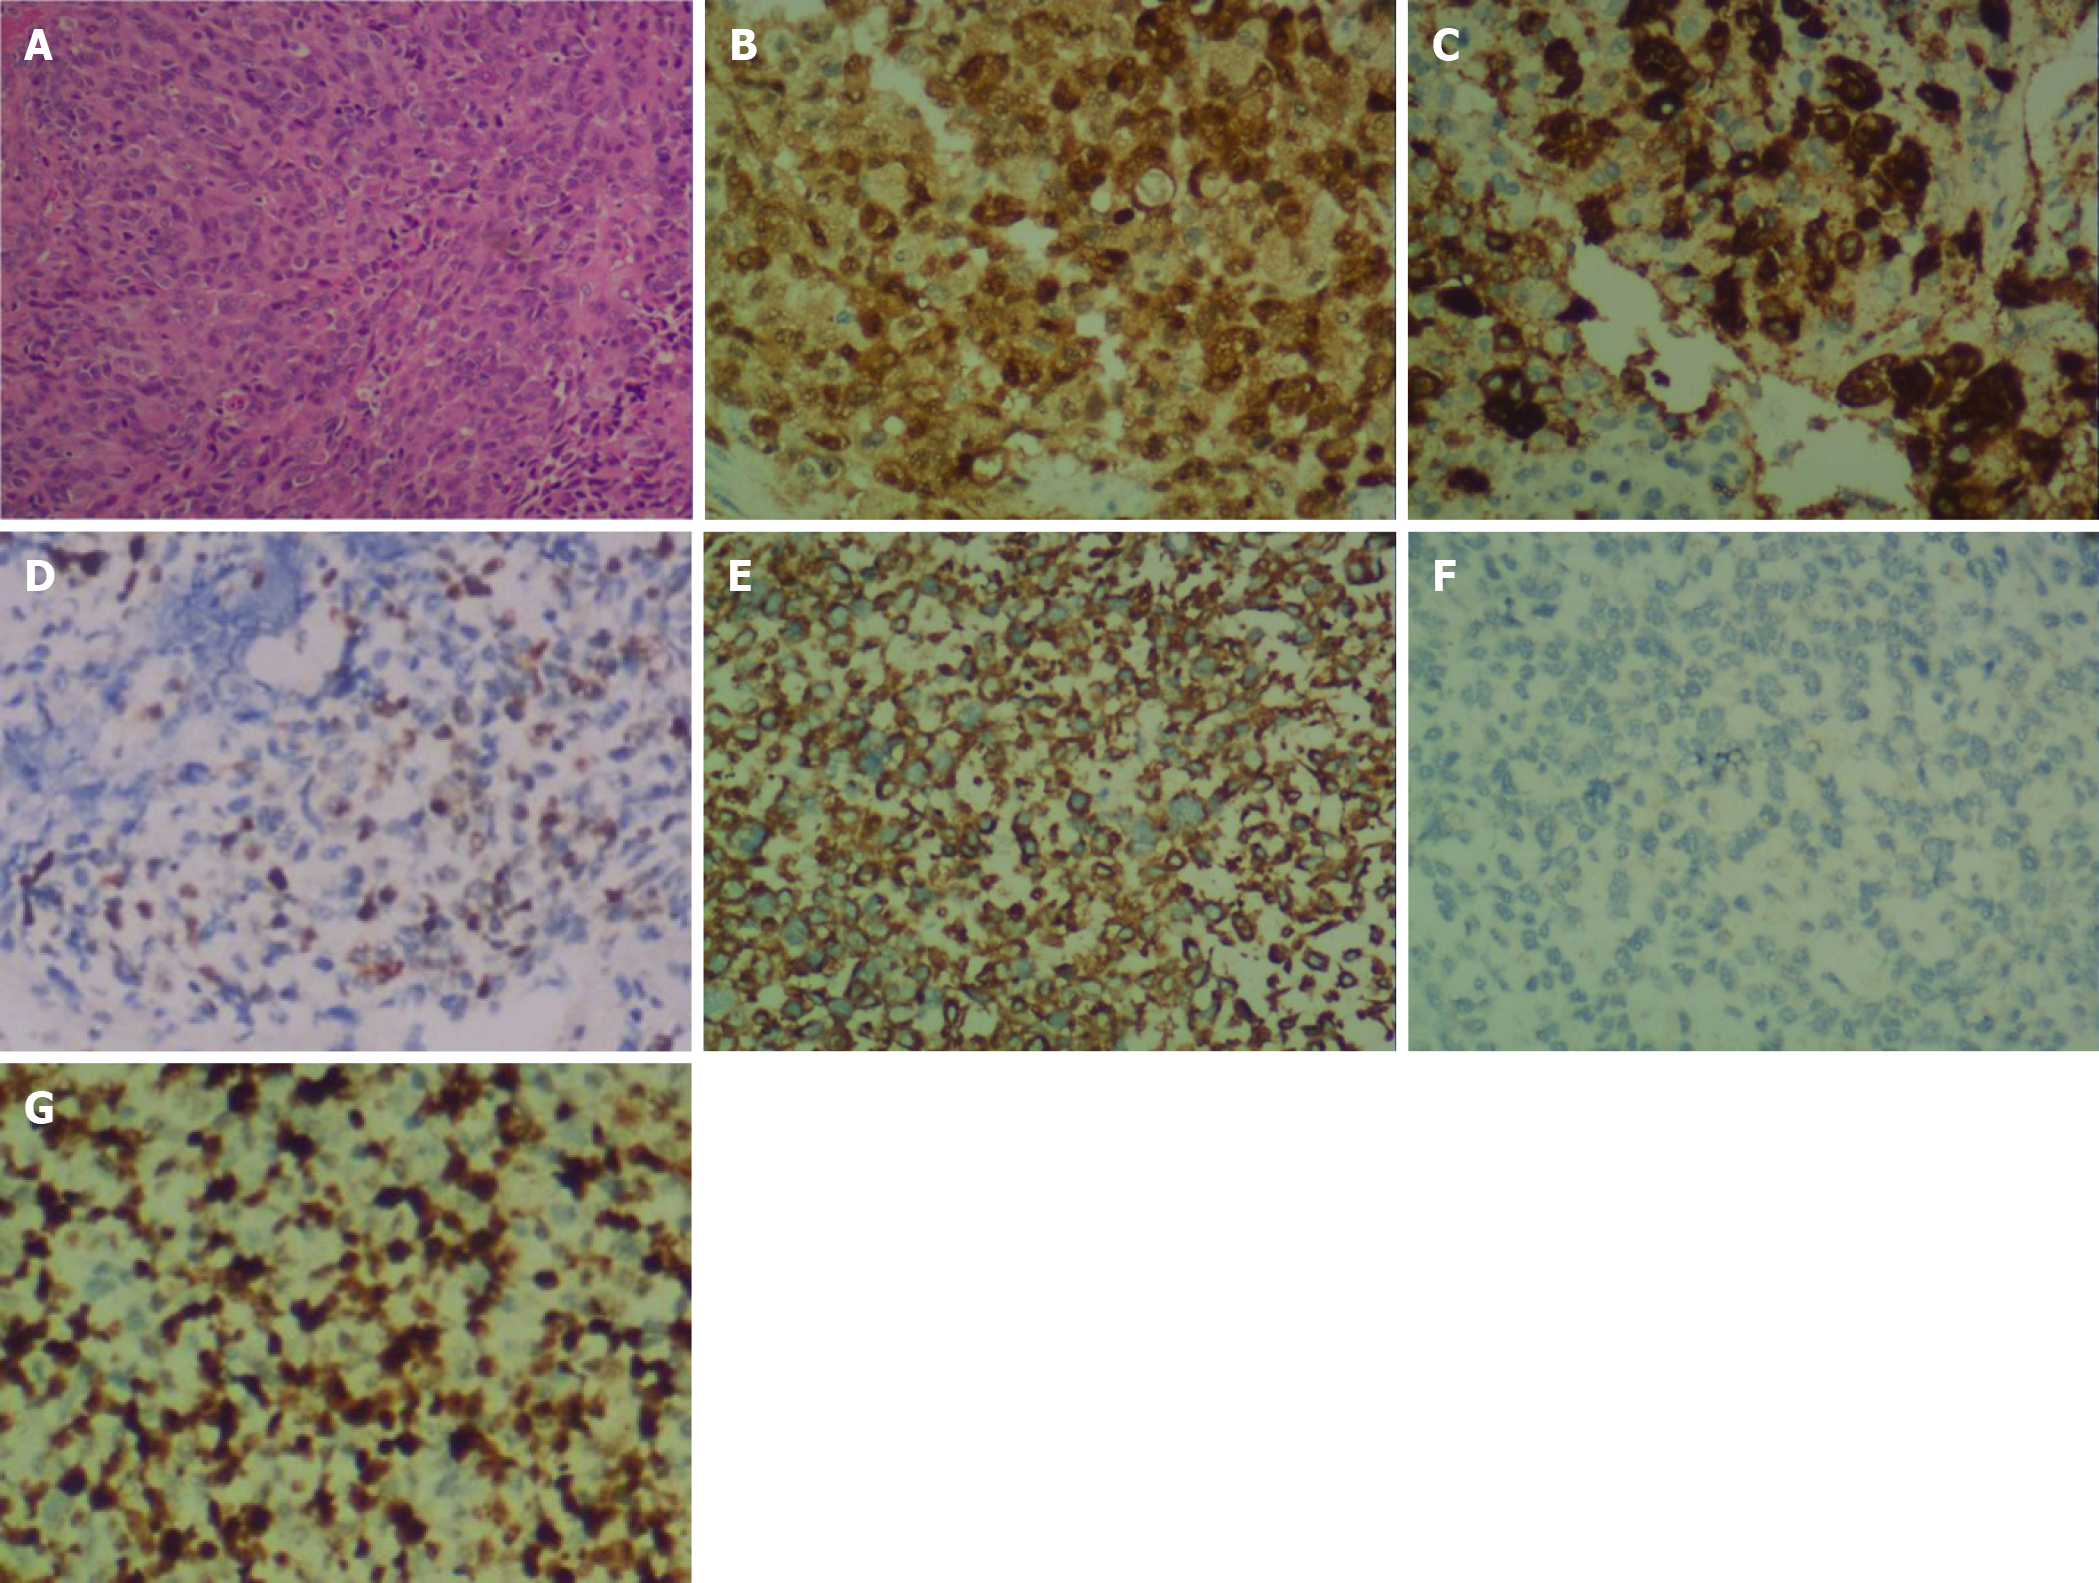
Figure 2 Histological analysis of the tumor tissue.
A: Hematoxylin and eosin staining showing the tumor cells (× 200); B-G: Immunohistochemical staining for S-100, homatropine methylbromide-45, p53, vimentin, cytokeratin, and Ki67, respectively (× 400).
- Citation: Sun LD, Chu X, Xu L, Fan XZ, Qian Y, Zuo DM. Primary intramedullary melanoma of lumbar spinal cord: A case report. World J Clin Cases 2021; 9(10): 2352-2356
- URL: https://www.wjgnet.com/2307-8960/full/v9/i10/2352.htm
- DOI: https://dx.doi.org/10.12998/wjcc.v9.i10.2352


