Copyright
©The Author(s) 2021.
World J Clin Cases. Apr 6, 2021; 9(10): 2320-2325
Published online Apr 6, 2021. doi: 10.12998/wjcc.v9.i10.2320
Published online Apr 6, 2021. doi: 10.12998/wjcc.v9.i10.2320
Figure 1 Dynamic changes of the sigmoid sinus wall on computed tomography venography.
A: Preoperative image; B: Image on the second day after surgery; C: Compared to A and B, a decrease in the sigmoid sinus diverticulum (orange arrow) with new bone remodeling (orange arrowhead) was observed on the image obtained 6 mo after surgery; D: The density of the remodeled bone was increased on the image obtained one year after surgery; E: The formation of a hardened remodeled edge was observed on the image obtained 2 years after surgery. Sigmoid sinus wall dehiscence (white arrow) revealed no changes on the computed tomography images obtained at various time points.
Figure 2 Dynamic changes of the transverse sinus and stent on computed tomography venography.
A: Severe transverse sinus stenosis was observed on the left side on pre-operative computed tomography, which may be formed by arachnoid granulations; B-C: The transverse sinus stenosis was well expanded by the stent; D: A slight filling defect in the stent was observed on the image obtained 1 year after surgery; E: The filling defect was enlarged after another year.
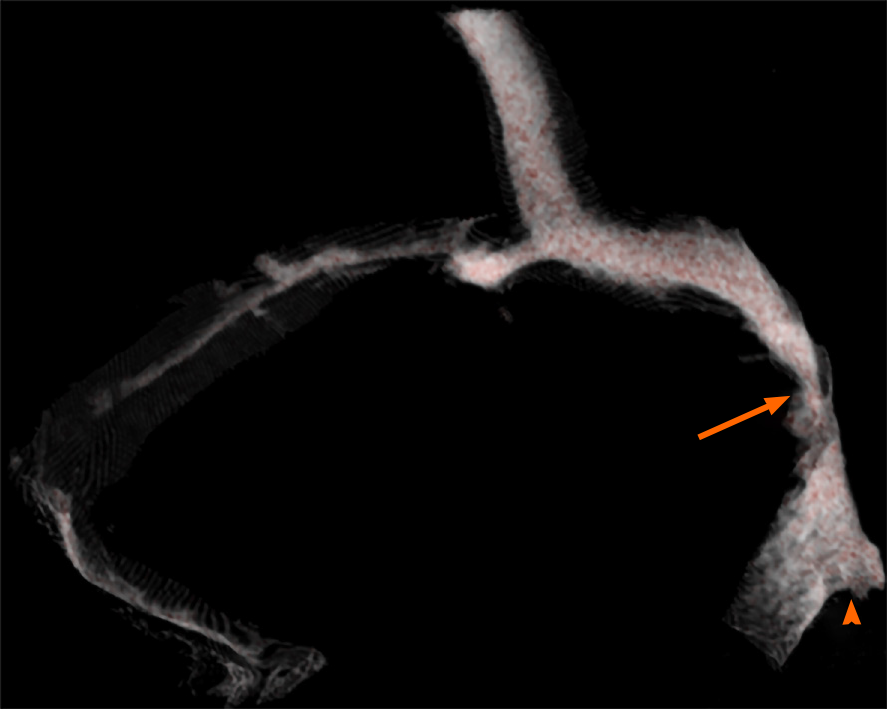
Figure 3 Three-dimensional reconstruction of the pre-operative computed tomography images.
Left-sided outflow dominance, left sigmoid sinus diverticulum (orange arrowhead), and bilateral localized TSS (orange arrow) were observed.
- Citation: Qiu XY, Zhao PF, Ding HY, Li XS, Lv H, Yang ZH, Gong SS, Jin L, Wang ZC. Bone remodeling in sigmoid sinus diverticulum after stenting for transverse sinus stenosis in pulsatile tinnitus: A case report. World J Clin Cases 2021; 9(10): 2320-2325
- URL: https://www.wjgnet.com/2307-8960/full/v9/i10/2320.htm
- DOI: https://dx.doi.org/10.12998/wjcc.v9.i10.2320


