Copyright
©The Author(s) 2021.
World J Clin Cases. Apr 6, 2021; 9(10): 2247-2258
Published online Apr 6, 2021. doi: 10.12998/wjcc.v9.i10.2247
Published online Apr 6, 2021. doi: 10.12998/wjcc.v9.i10.2247
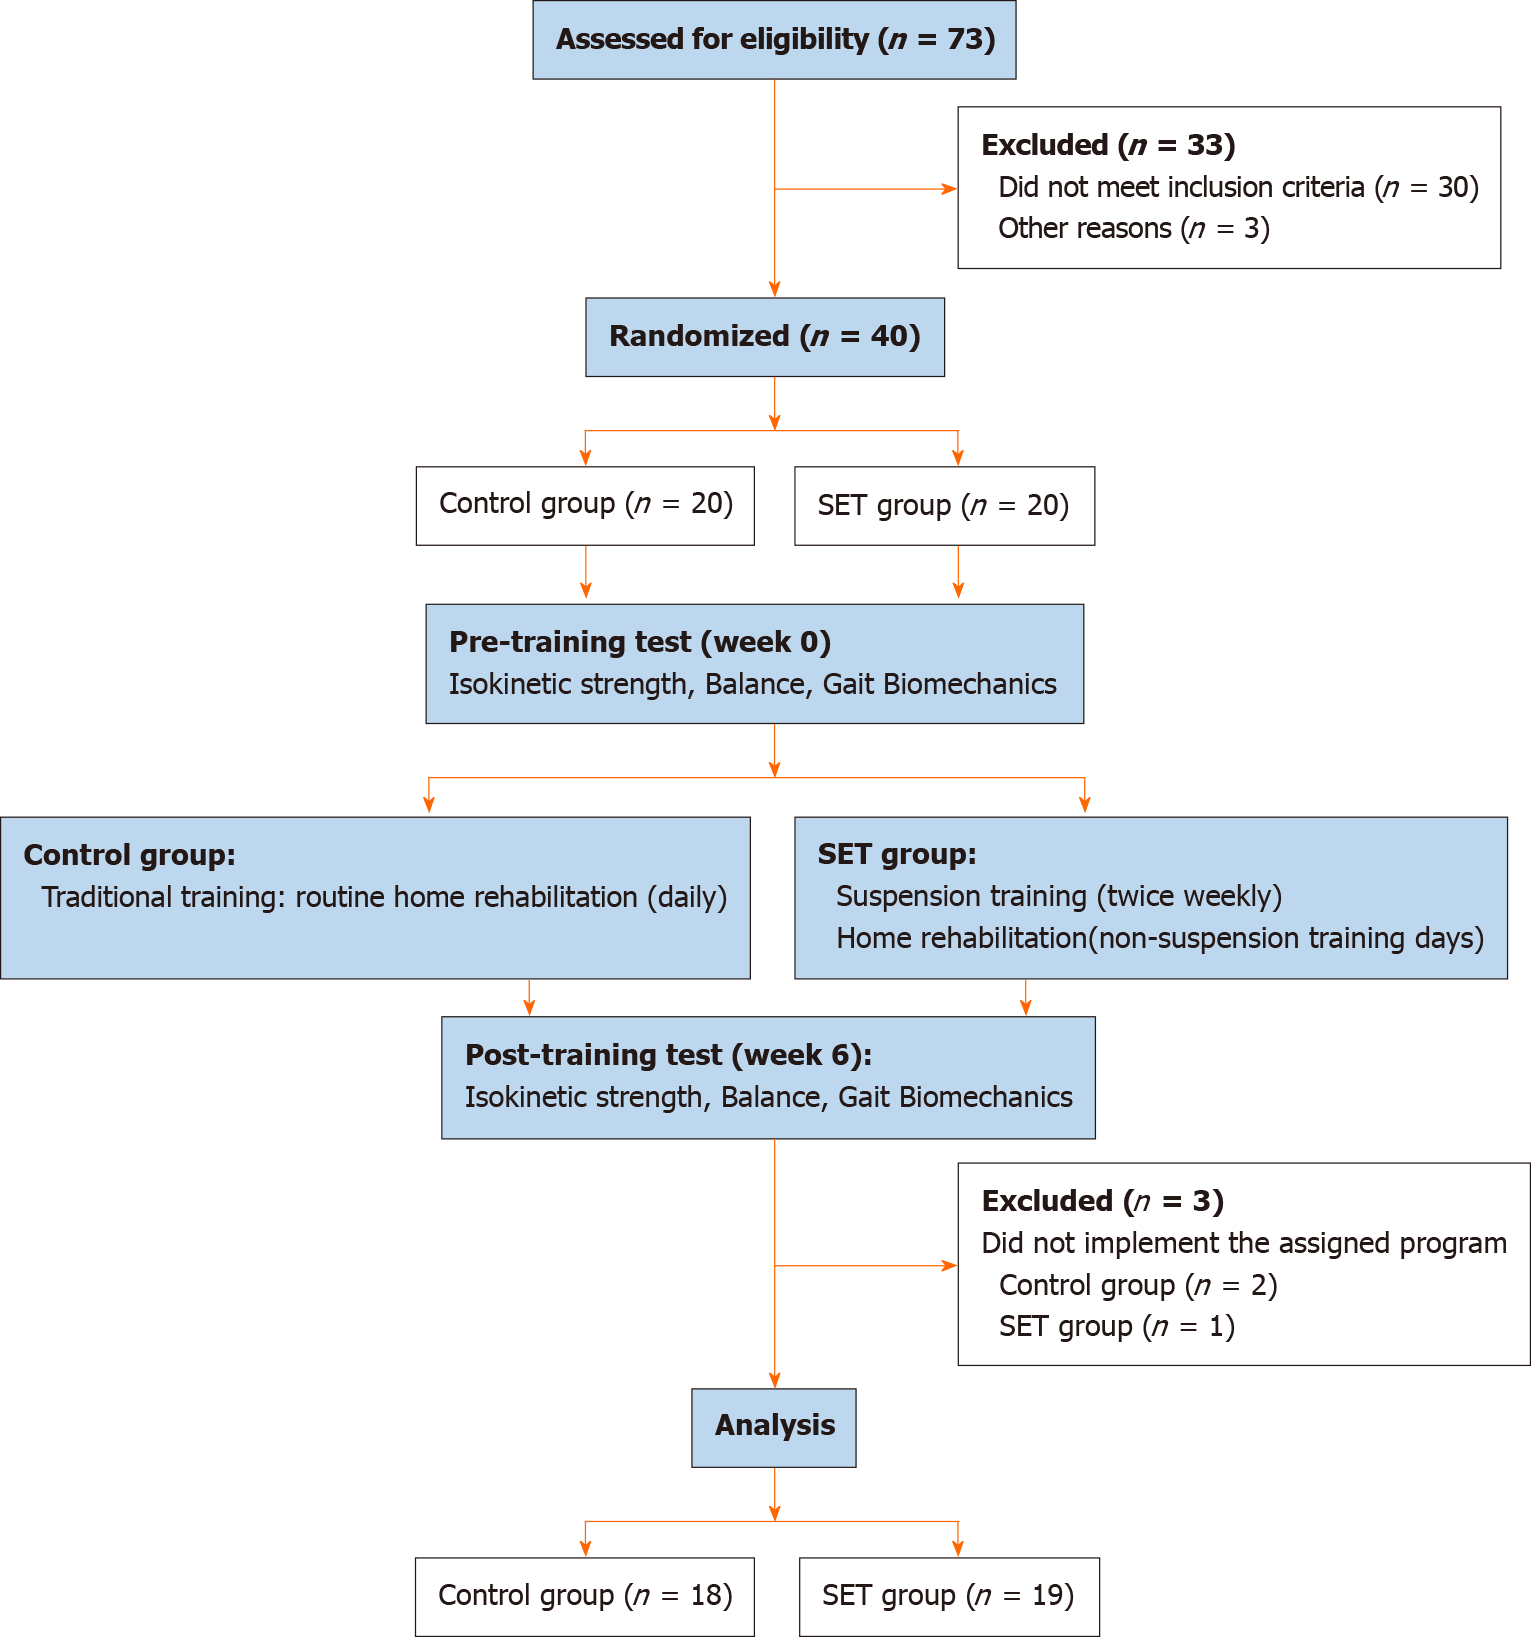
Figure 1 CONSORT flow diagram.
SET: Suspension training.
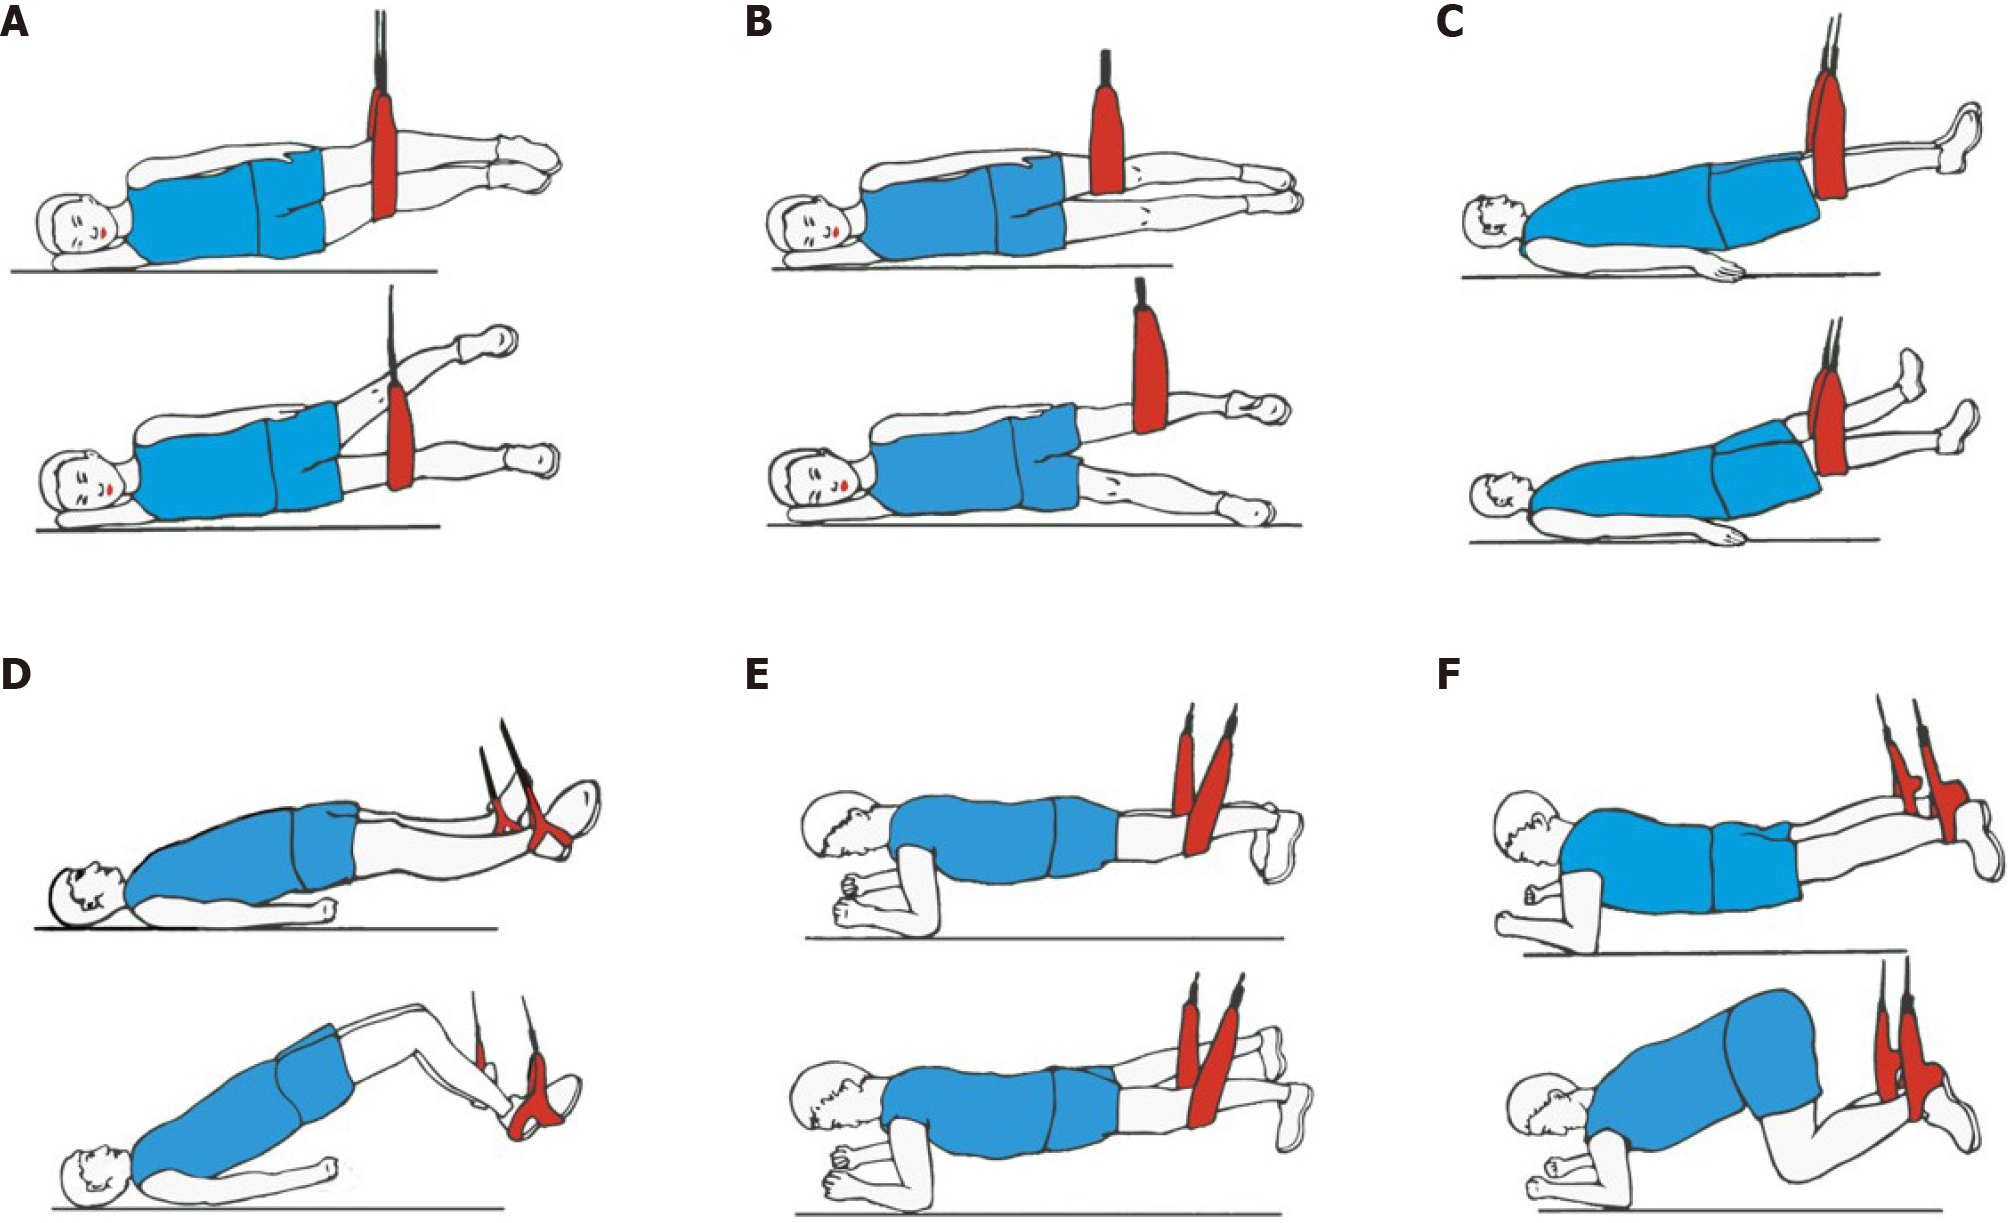
Figure 2
Suspension training program.
Figure 3 Scaled peak torque of the quadriceps and hamstrings of the injured leg.
aP < 0.05 indicates a significant difference between pre-training and post-training. SET: Suspension training.
Figure 4 Percent change and symmetry index of the scaled peak torque.
A: Percent change of the scaled peak torque pre- to post-training; B: Comparison the scaled peak torque between the injured side and the non-injured side. SET: Suspension training.
- Citation: Huang DD, Chen LH, Yu Z, Chen QJ, Lai JN, Li HH, Liu G. Effect of suspension training on neuromuscular function, postural control, and knee kinematics in anterior cruciate ligament reconstruction patients. World J Clin Cases 2021; 9(10): 2247-2258
- URL: https://www.wjgnet.com/2307-8960/full/v9/i10/2247.htm
- DOI: https://dx.doi.org/10.12998/wjcc.v9.i10.2247


