Copyright
©The Author(s) 2020.
World J Clin Cases. Jan 6, 2021; 9(1): 148-162
Published online Jan 6, 2021. doi: 10.12998/wjcc.v9.i1.148
Published online Jan 6, 2021. doi: 10.12998/wjcc.v9.i1.148
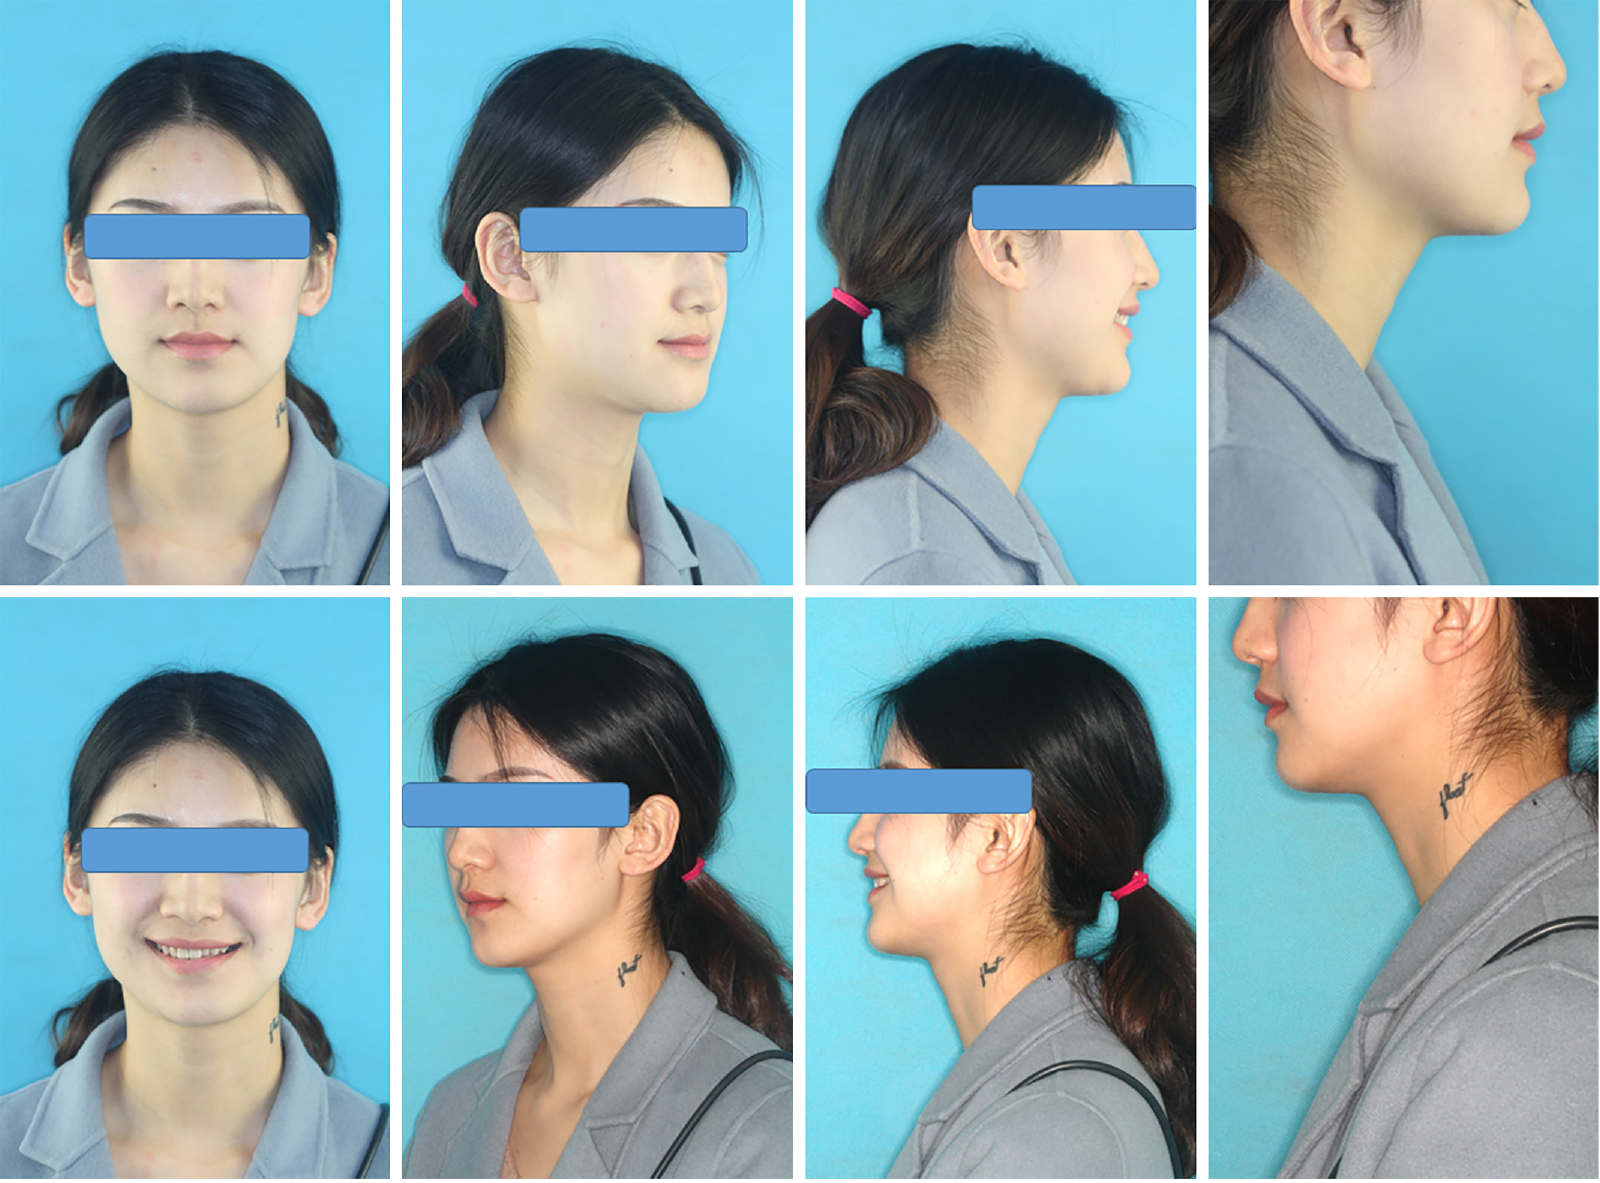
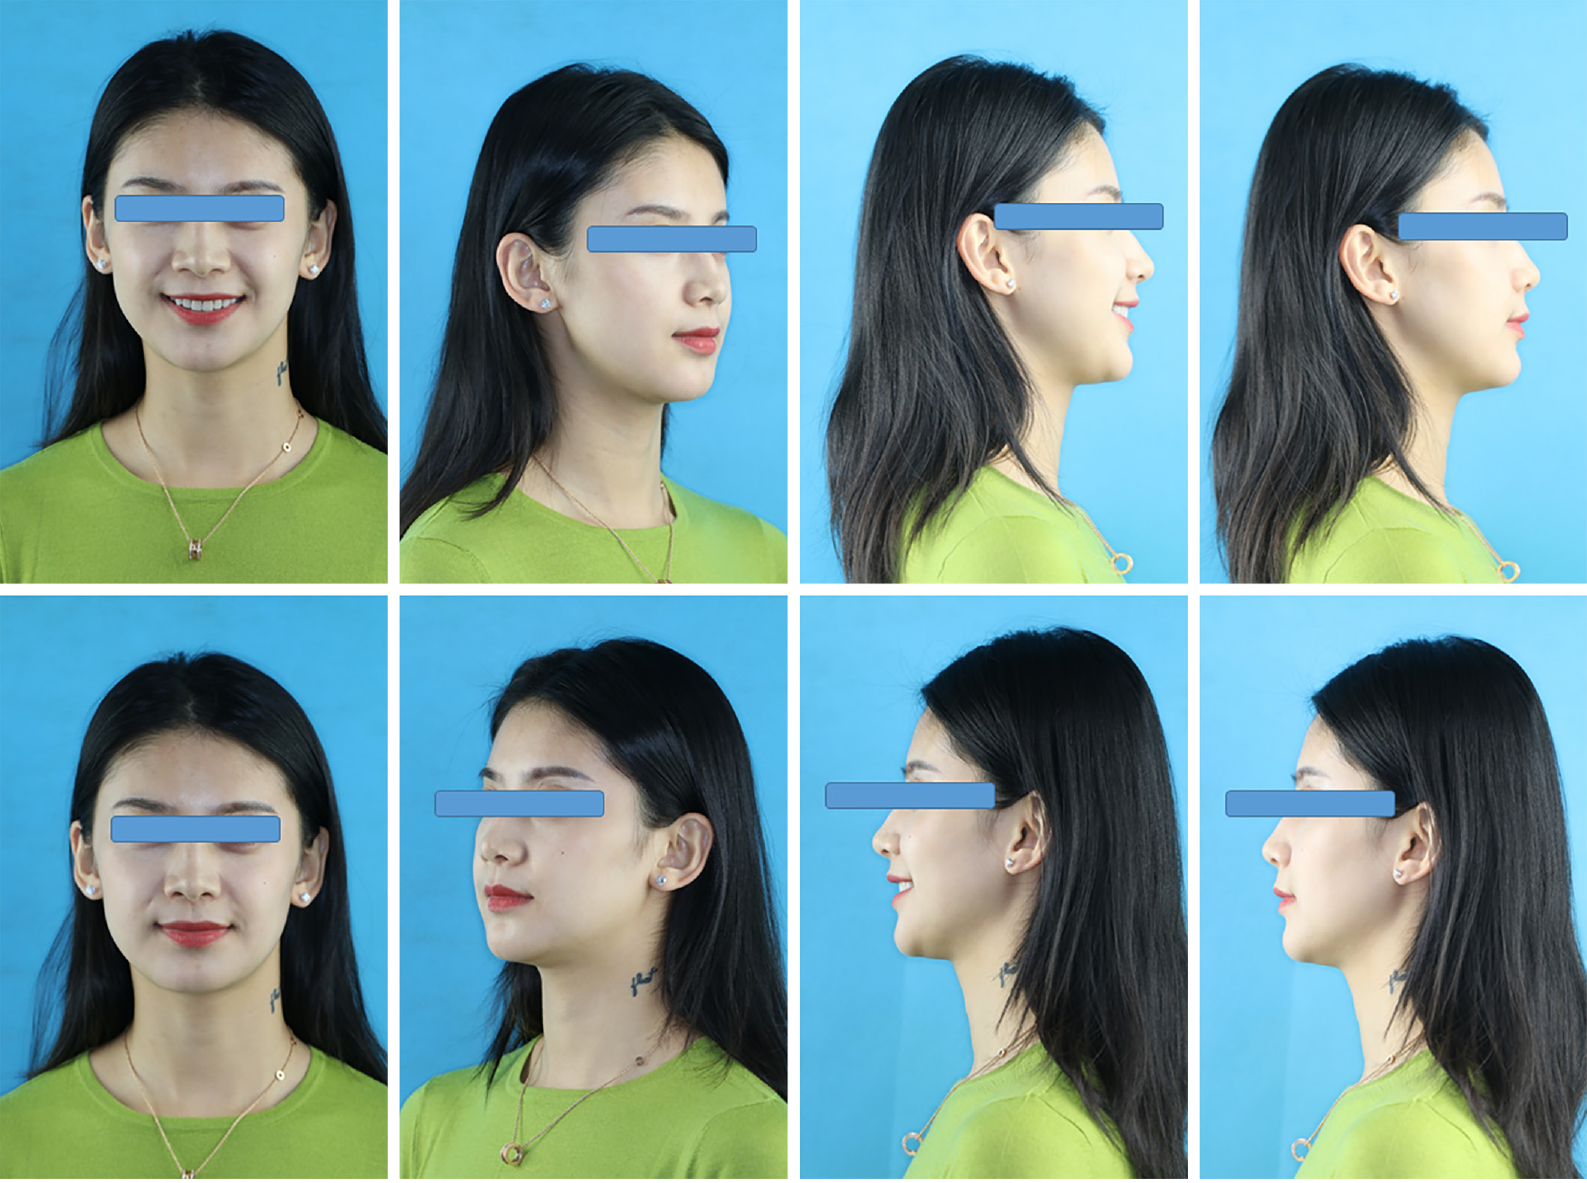
Figure 1 Pretreatment facial photographs.
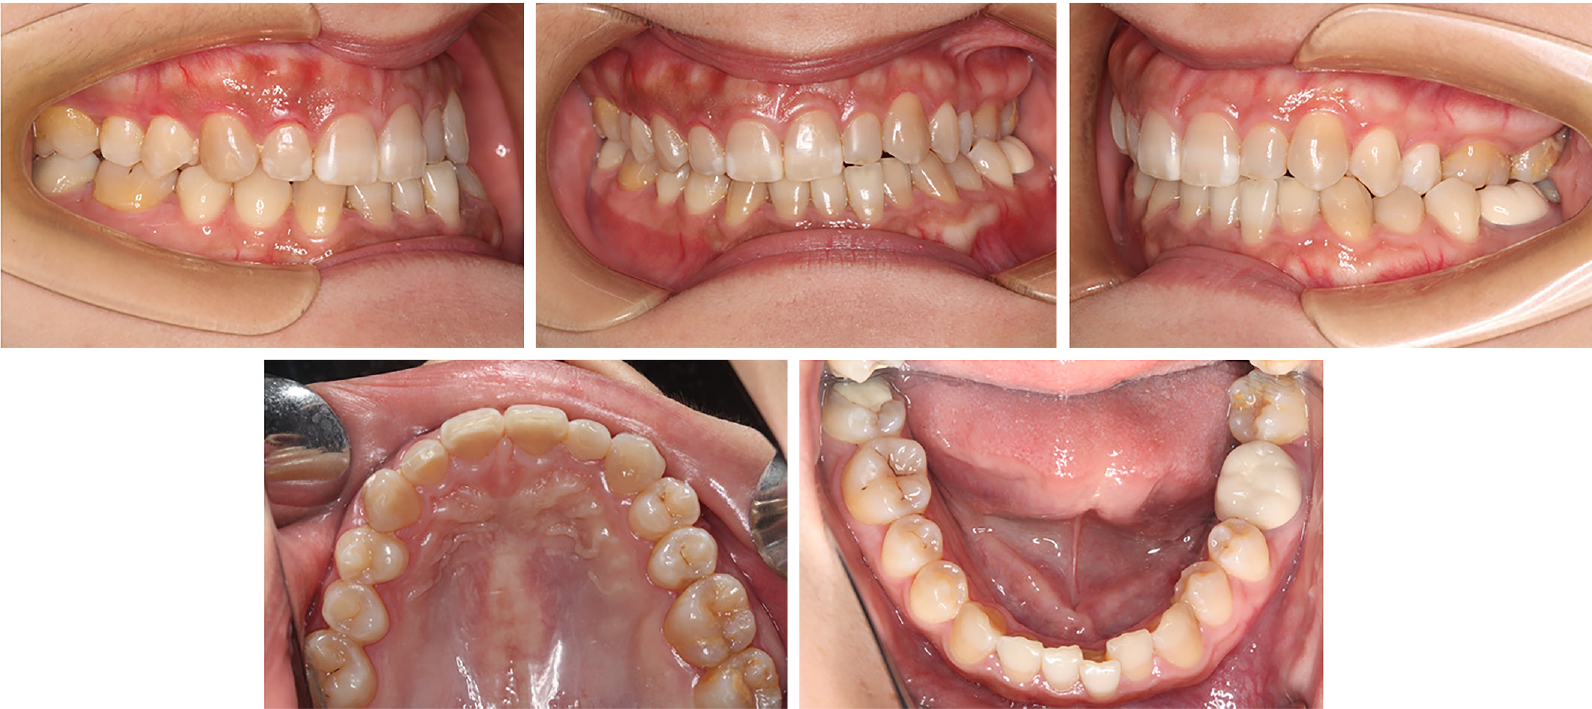
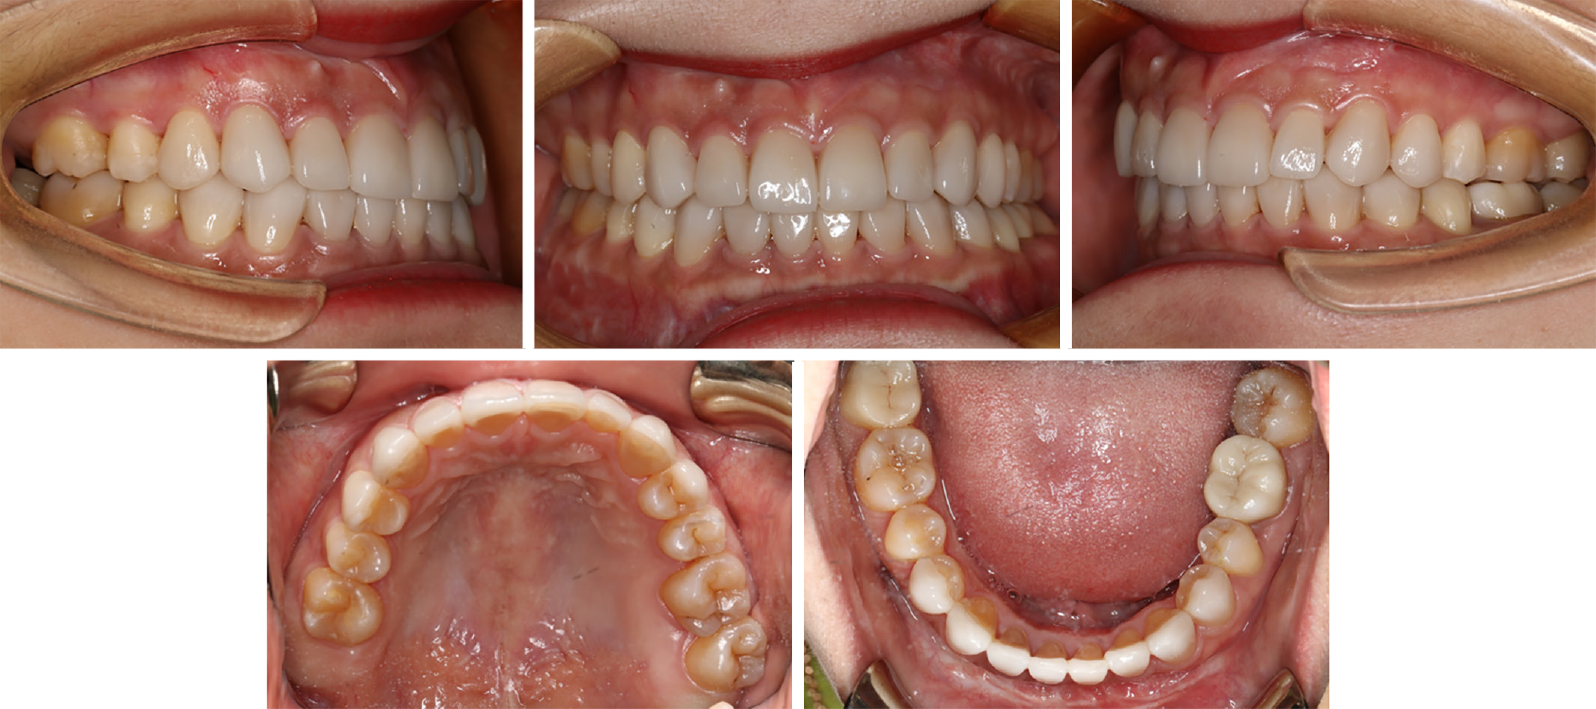
Figure 2 Pretreatment oral photographs.
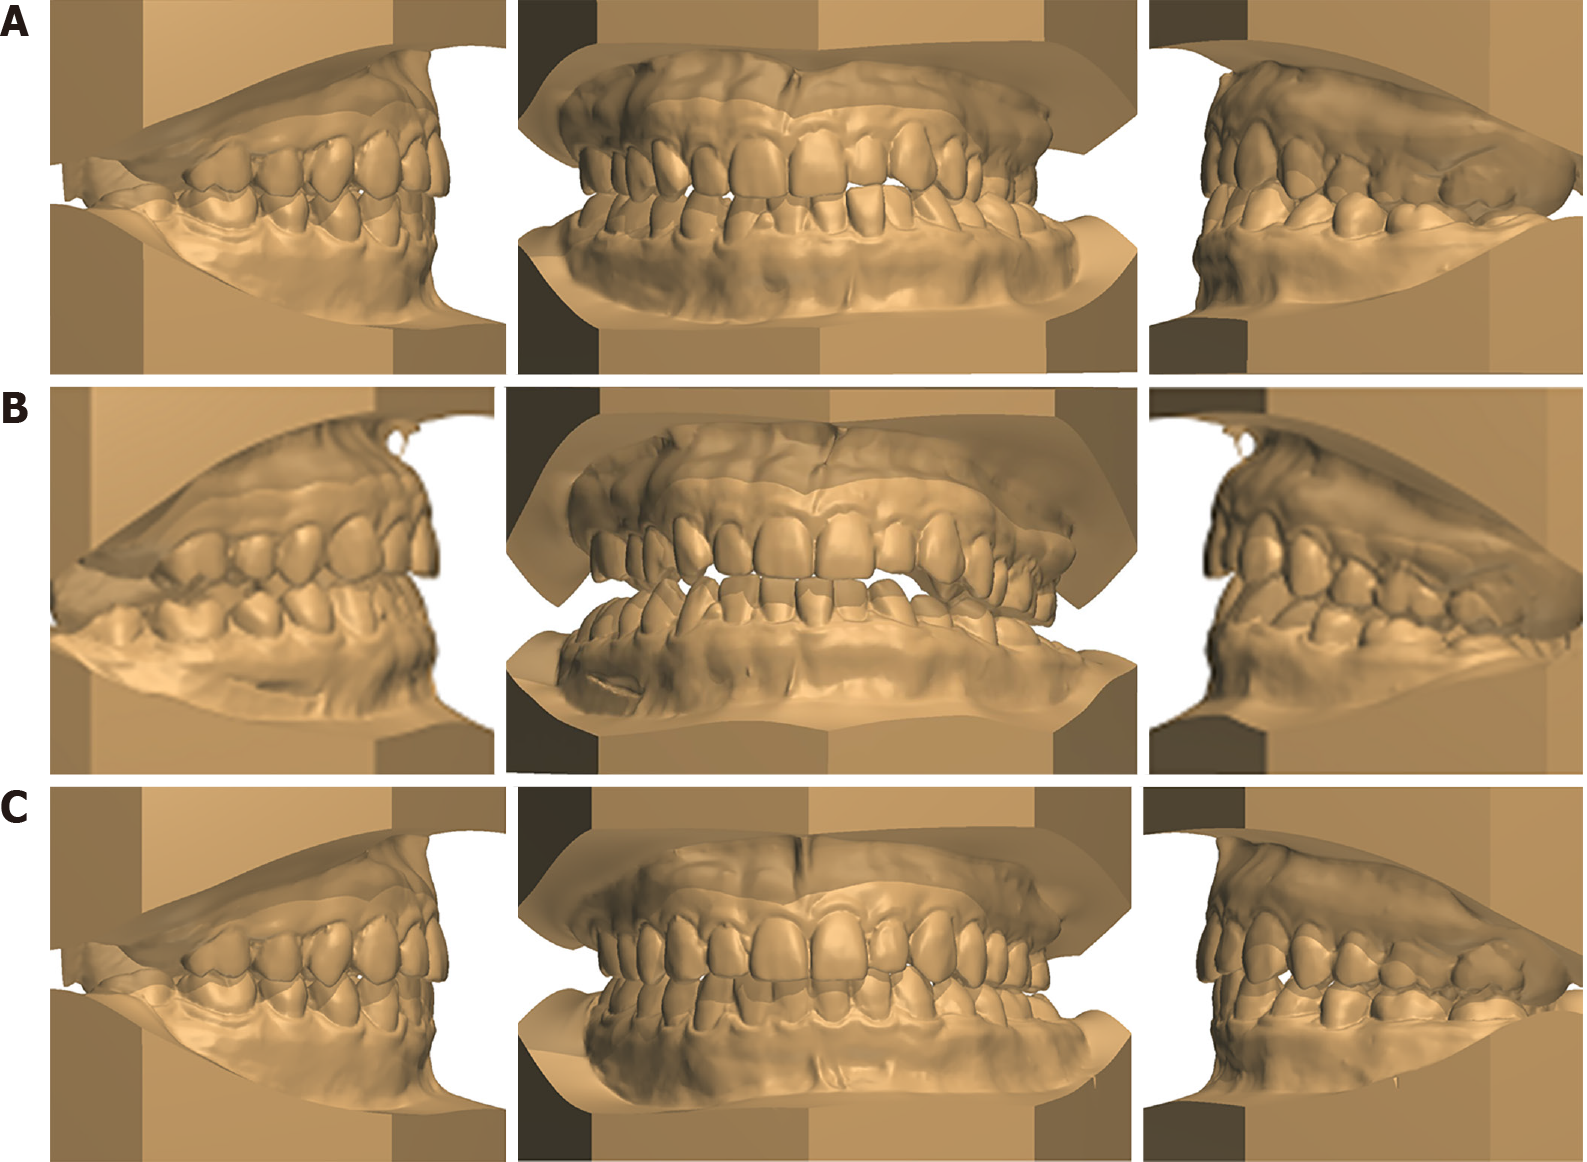
Figure 3 The study casts.
A: Pretreatment study casts; B: Designed postsurgical study casts; C: Posttreatment study casts.
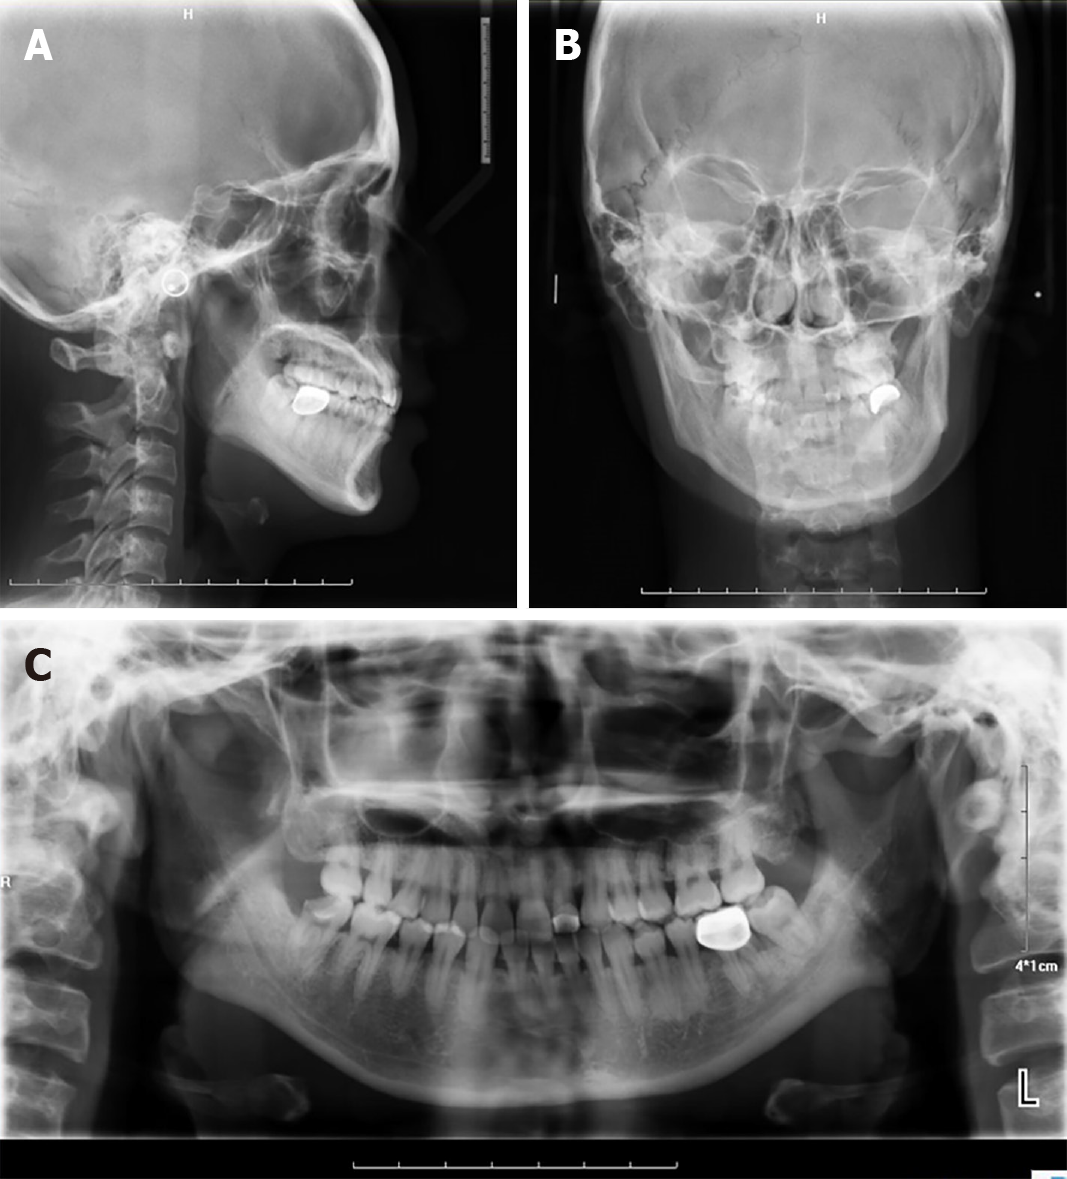
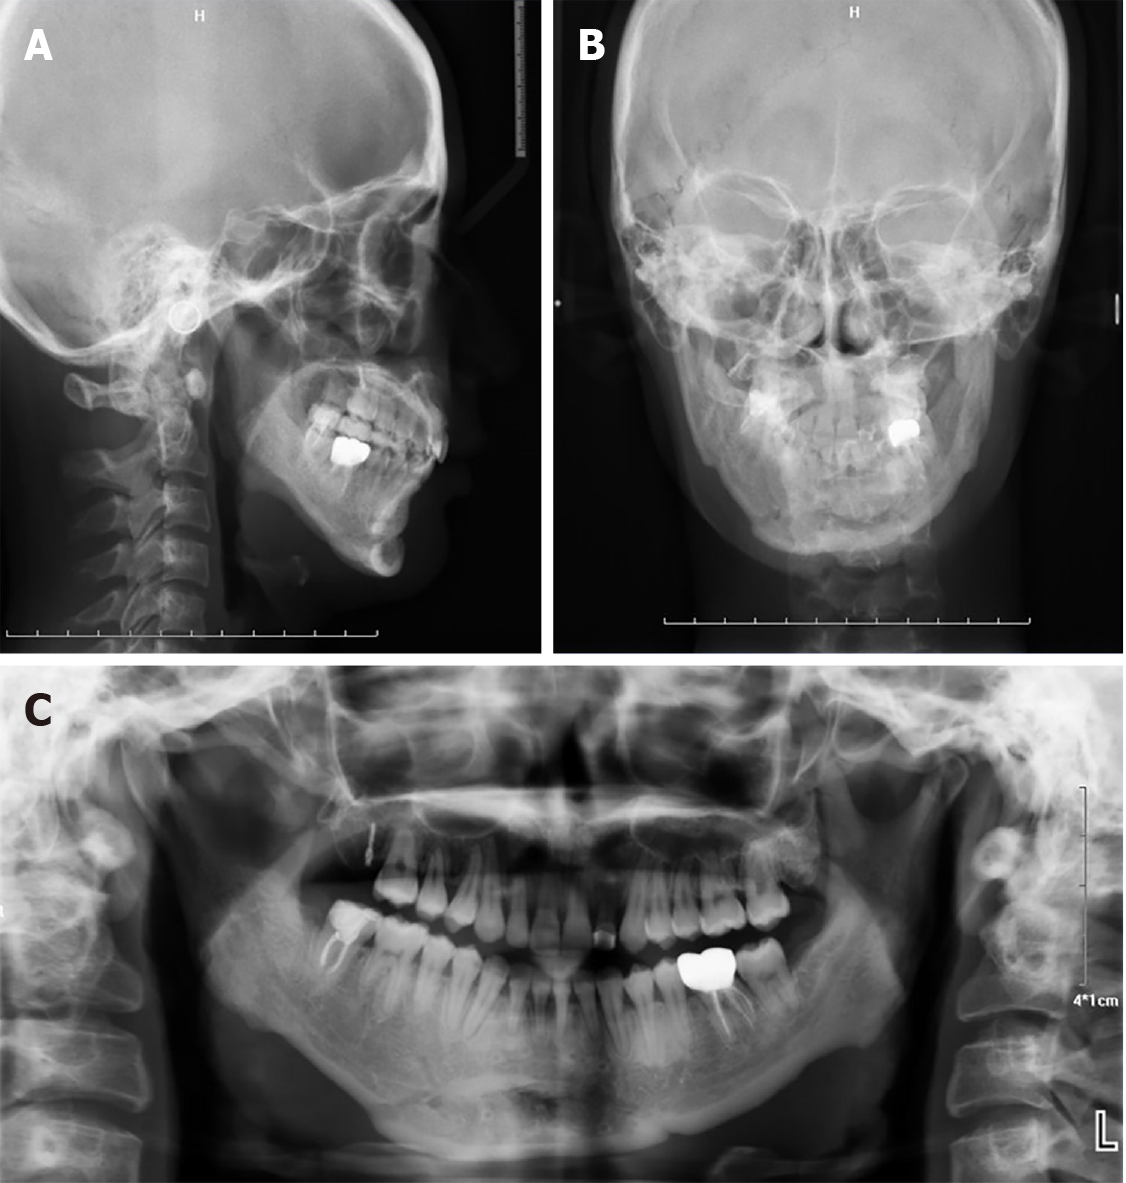
Figure 4 Initial radiograph.
A: Lateral cephalometric radiograph; B: Posteroanterior radiograph; C: Panoramic radiograph.
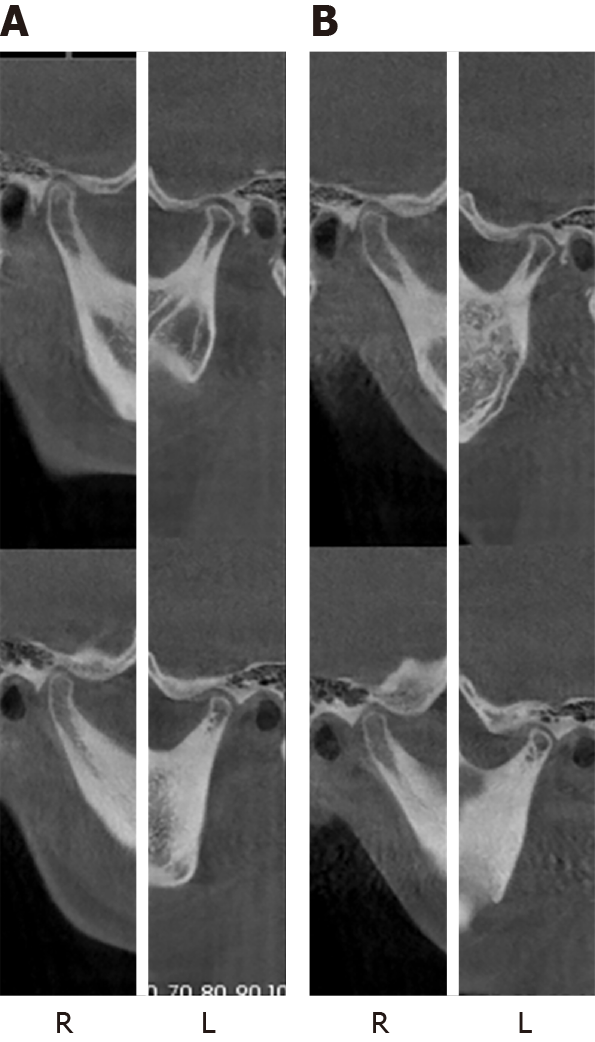
Figure 5 Cone beam computed tomography image of the temporomandibular joint.
A: Pretreatment; B: Posttreatment.
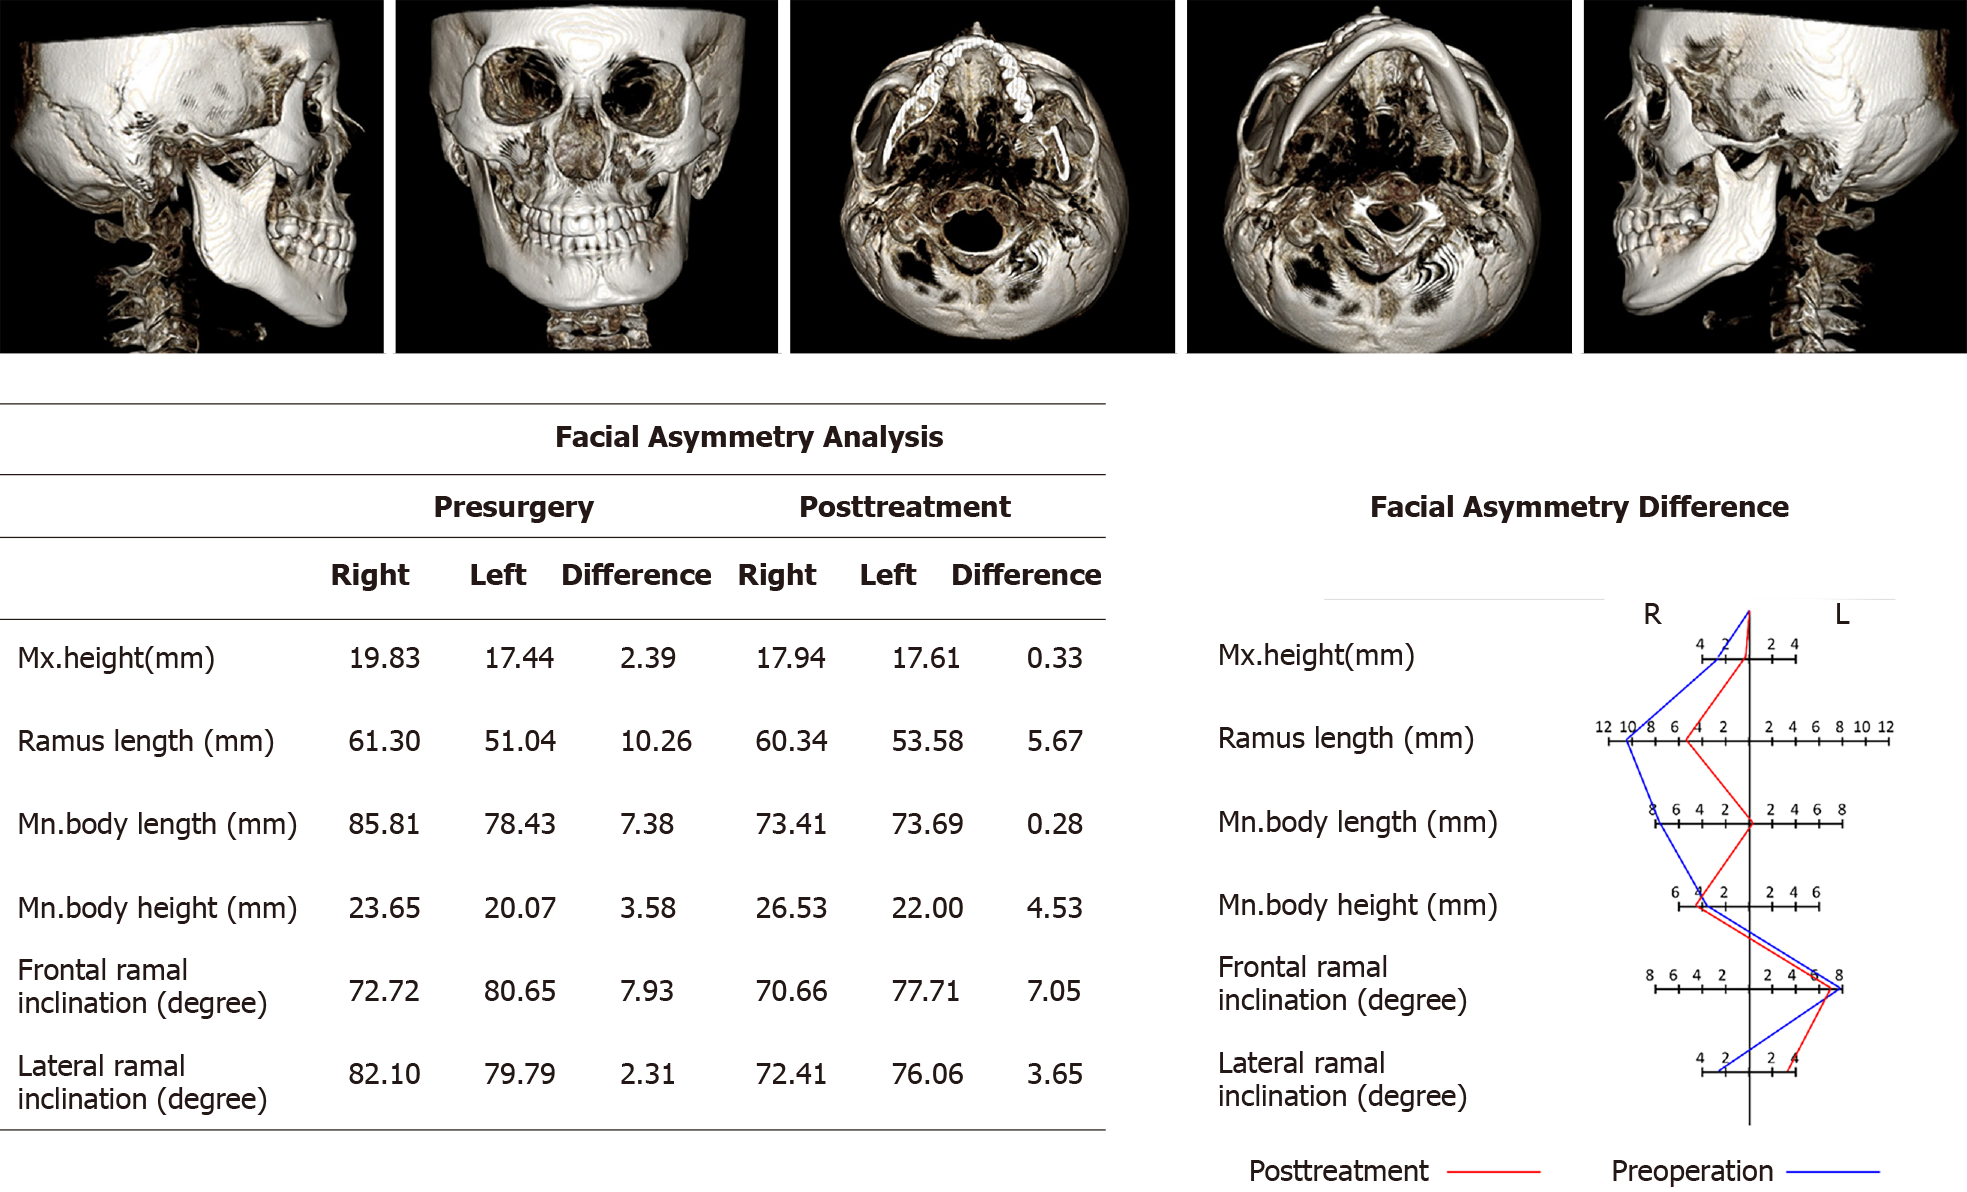
Figure 6 Three-dimensional image of facial asymmetry generated from cone beam computed tomography and facial asymmetry analysis.
Figure 7 Facial and intraoral photographs at the first visit after surgery.
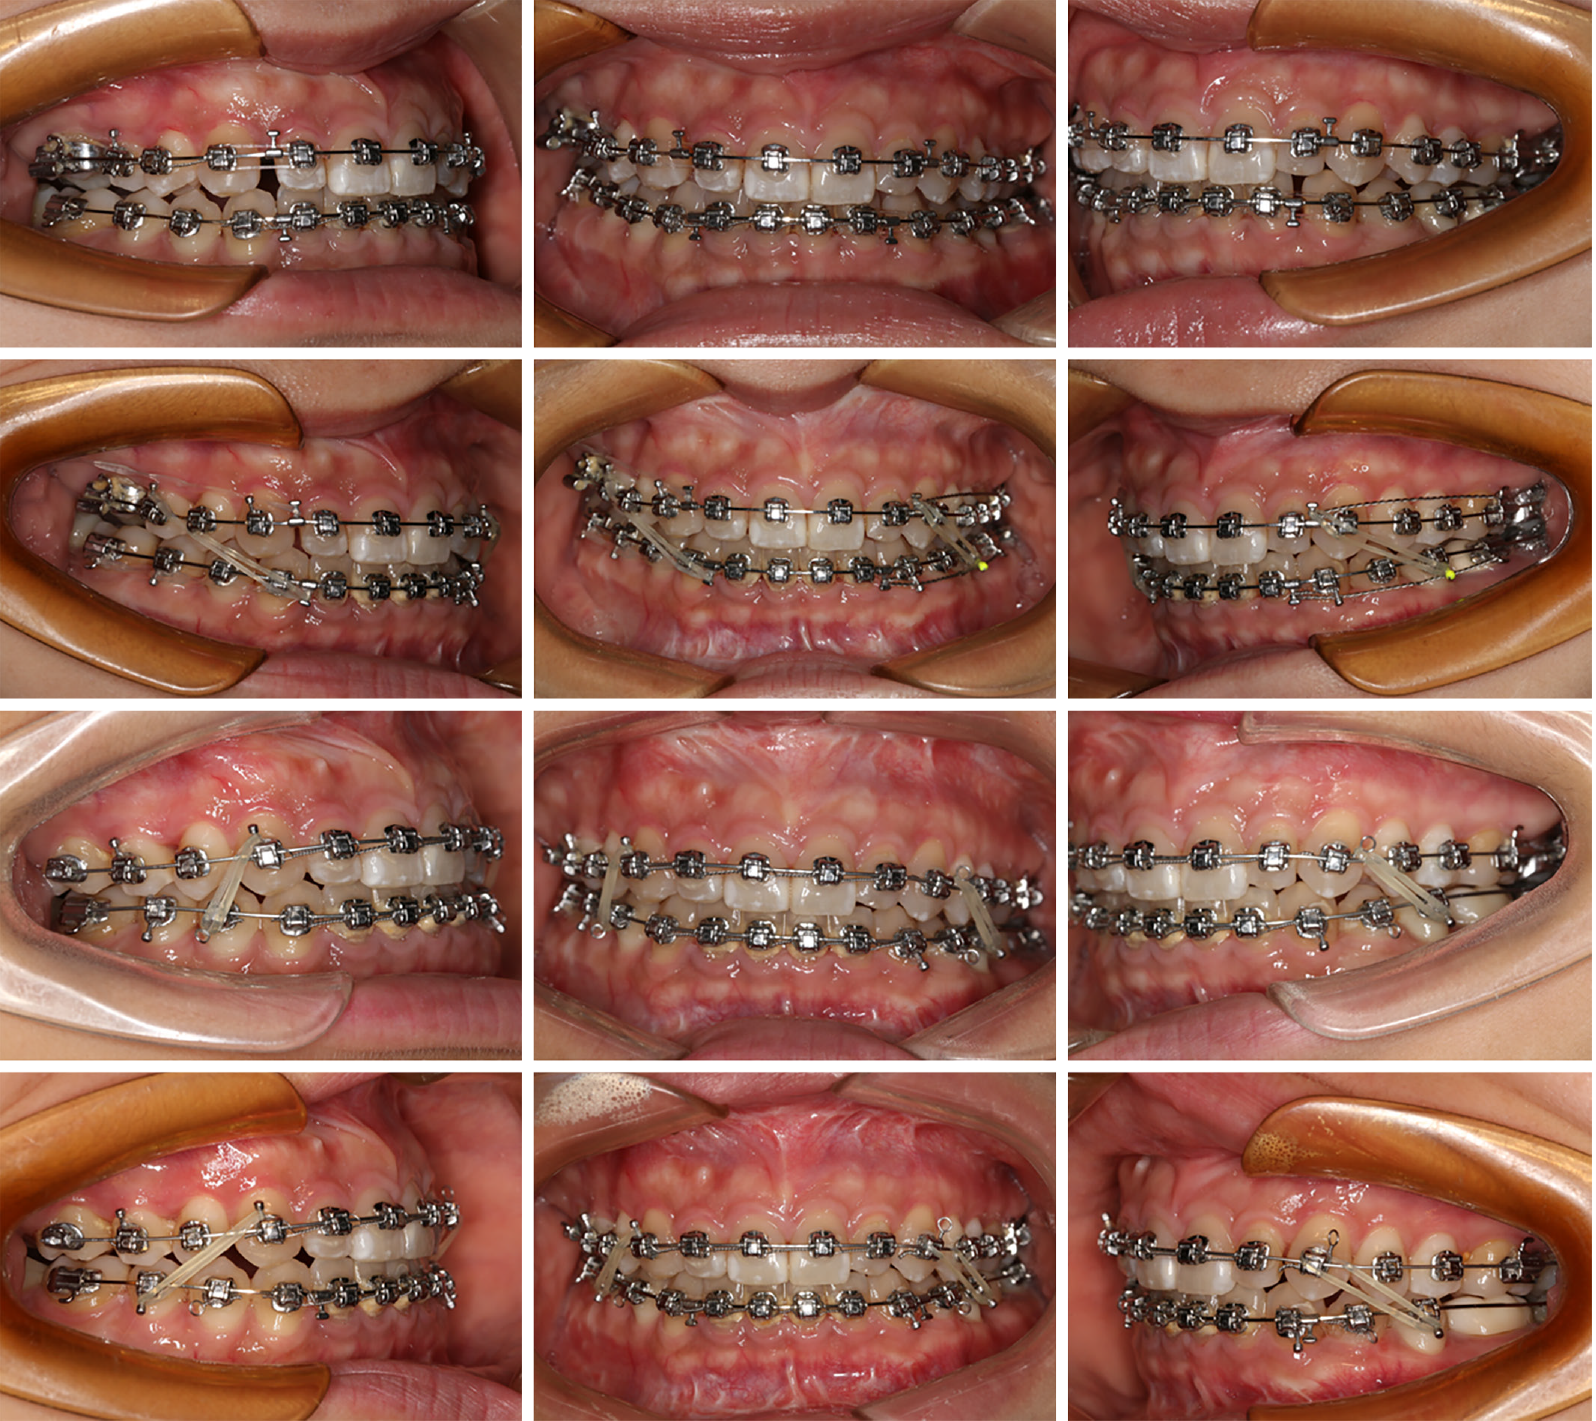
Figure 8 The process of orthodontic treatment.
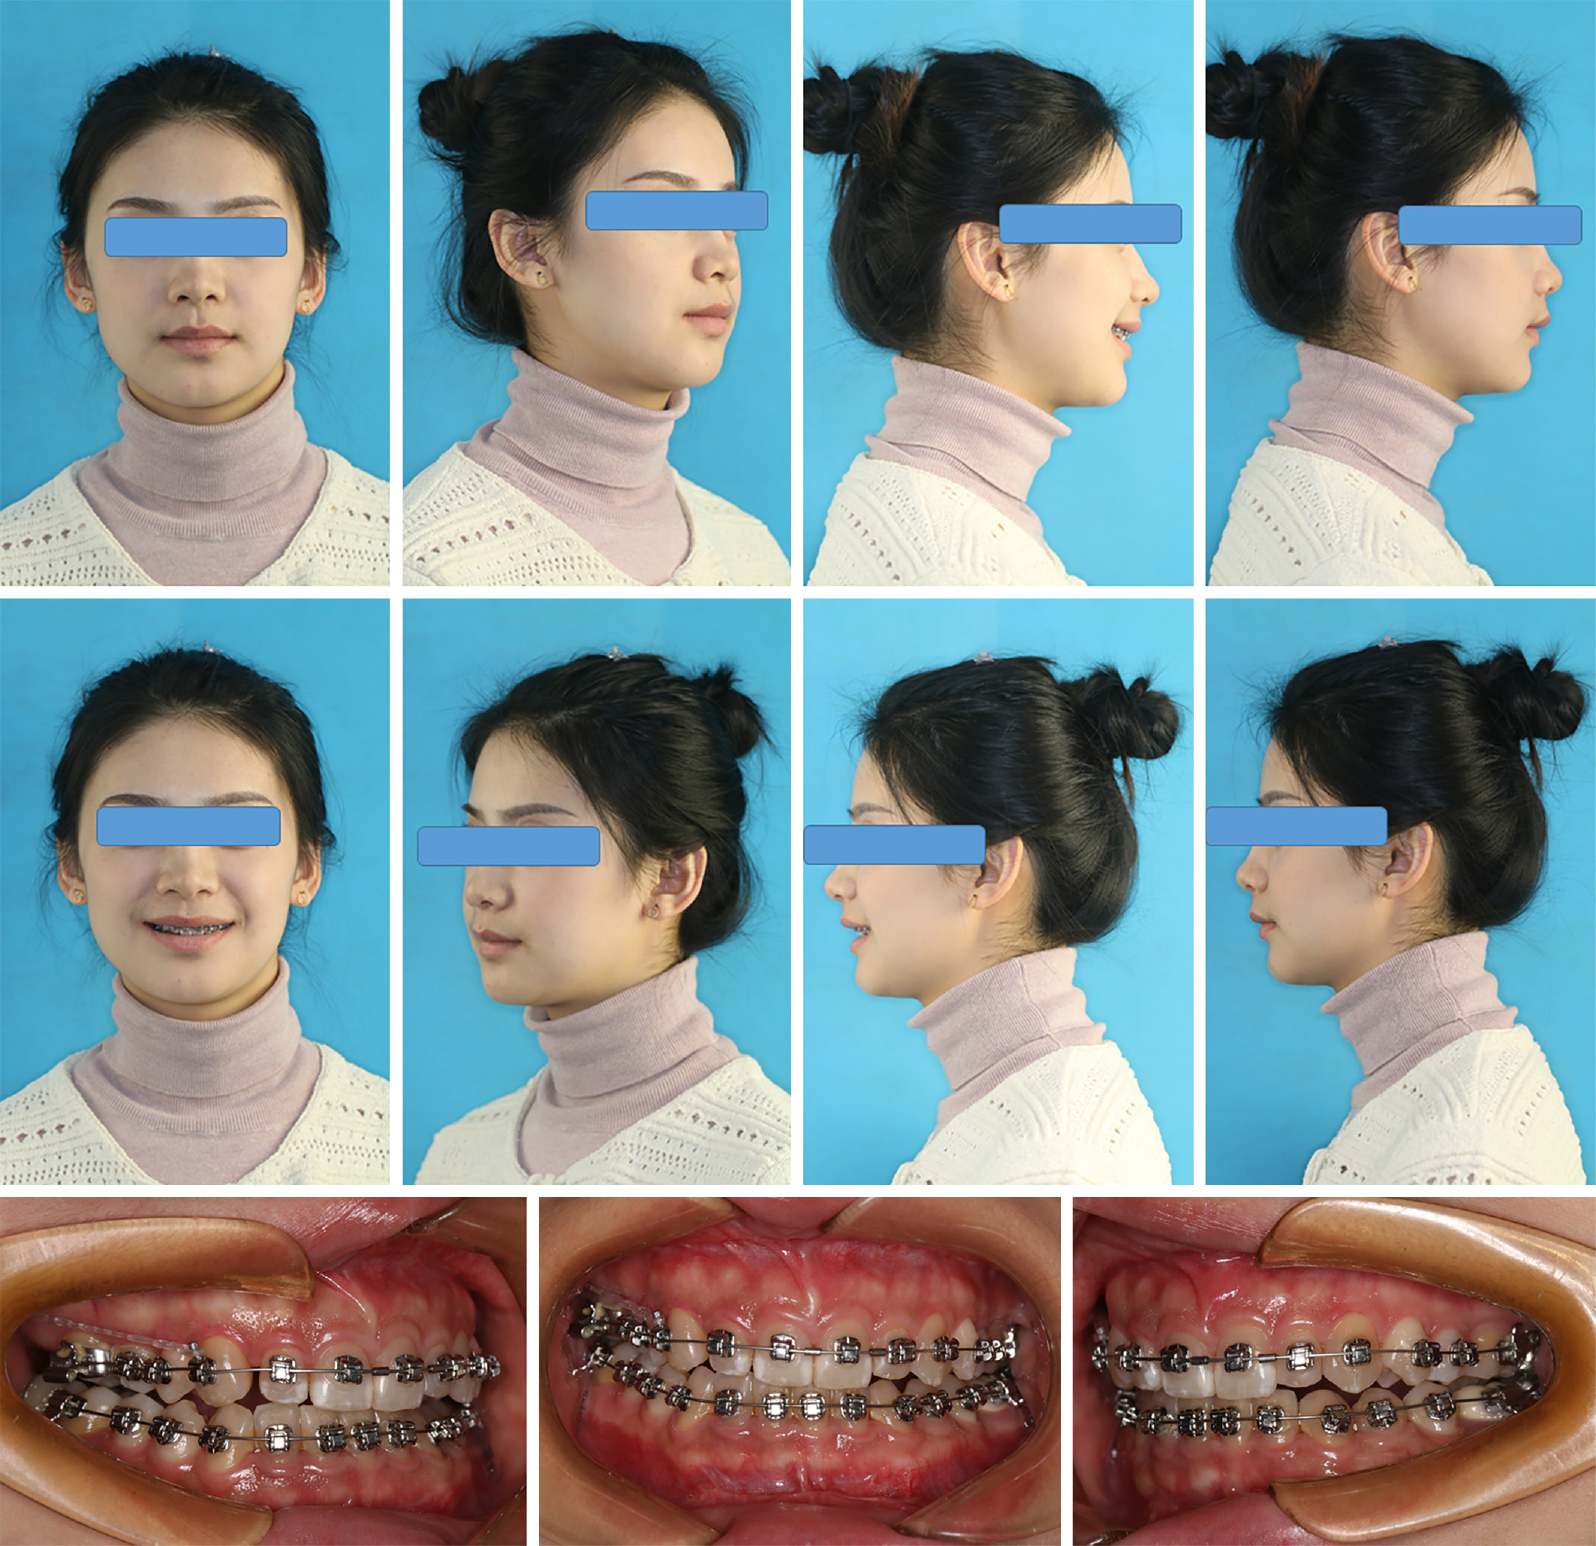
Figure 9 Final facial photographs.
Figure 10 Final intraoral photographs.
Figure 11 Final radiograph.
A: Lateral cephalometric radiograph; B: Posteroanterior radiograph; C: Panoramic radiograph.
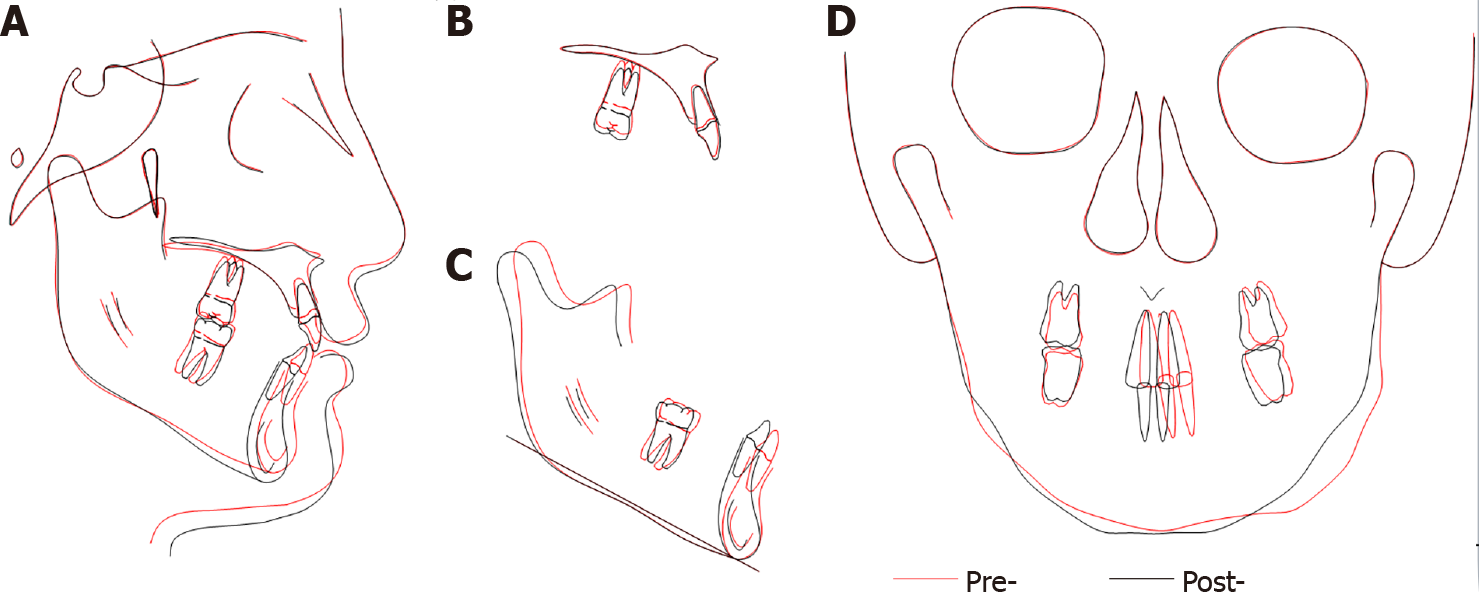
Figure 12 Tracing and superimposition of cephalograms at pretreatment (red) and posttreatment (blue).
A: Cranial base superimposition to evaluate surgical changes in bone and soft tissues on lateral cephalogram; B: Maxillary superimposition on lateral cephalogram; C: Mandibular superimposition to evaluate tooth movement, extrusion and incisor repositioning on lateral cephalogram; D: Tracing and superimposition of posteroanterior cephalograms at pretreatment (red) and posttreatment (blue).
- Citation: Song JY, Yang H, He X, Gao S, Wu GM, Hu M, Zhang Y. Surgery-first for a patient with mild hemifacial microsomia: A case report and review of literature. World J Clin Cases 2021; 9(1): 148-162
- URL: https://www.wjgnet.com/2307-8960/full/v9/i1/148.htm
- DOI: https://dx.doi.org/10.12998/wjcc.v9.i1.148


