Copyright
©The Author(s) 2020.
World J Clin Cases. May 6, 2020; 8(9): 1685-1692
Published online May 6, 2020. doi: 10.12998/wjcc.v8.i9.1685
Published online May 6, 2020. doi: 10.12998/wjcc.v8.i9.1685
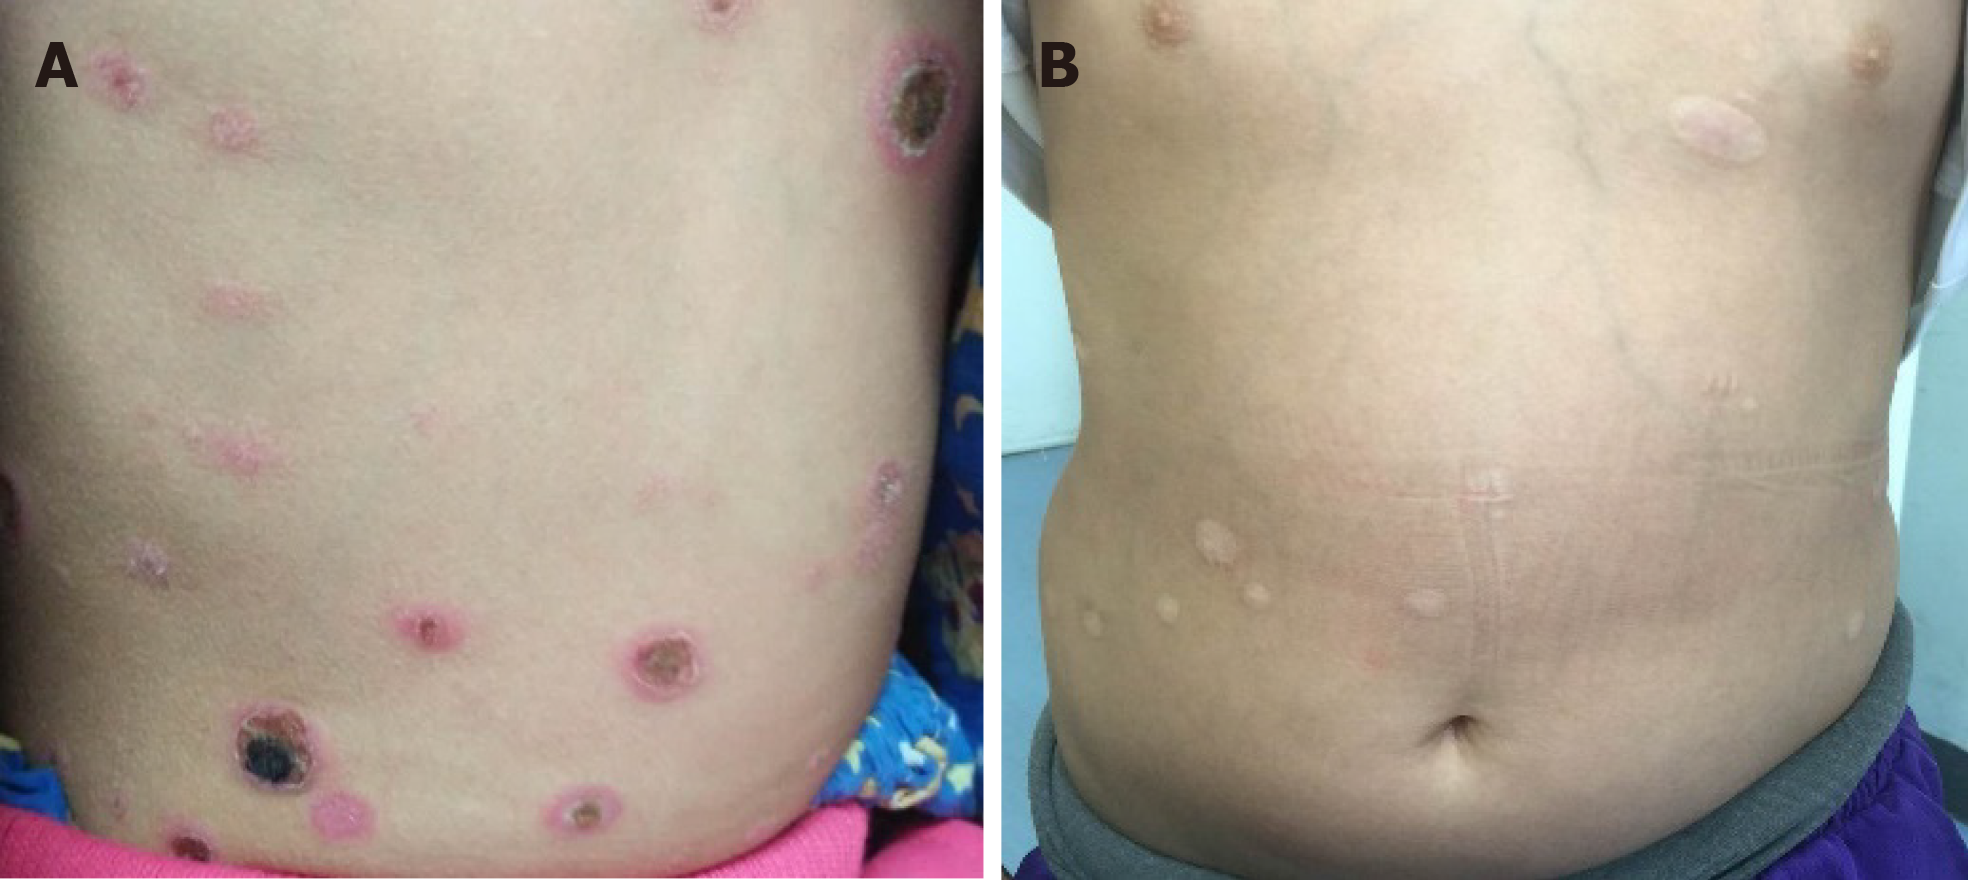
Figure 1 Skin rashes (A) before treatment and (B) after chemotherapy.
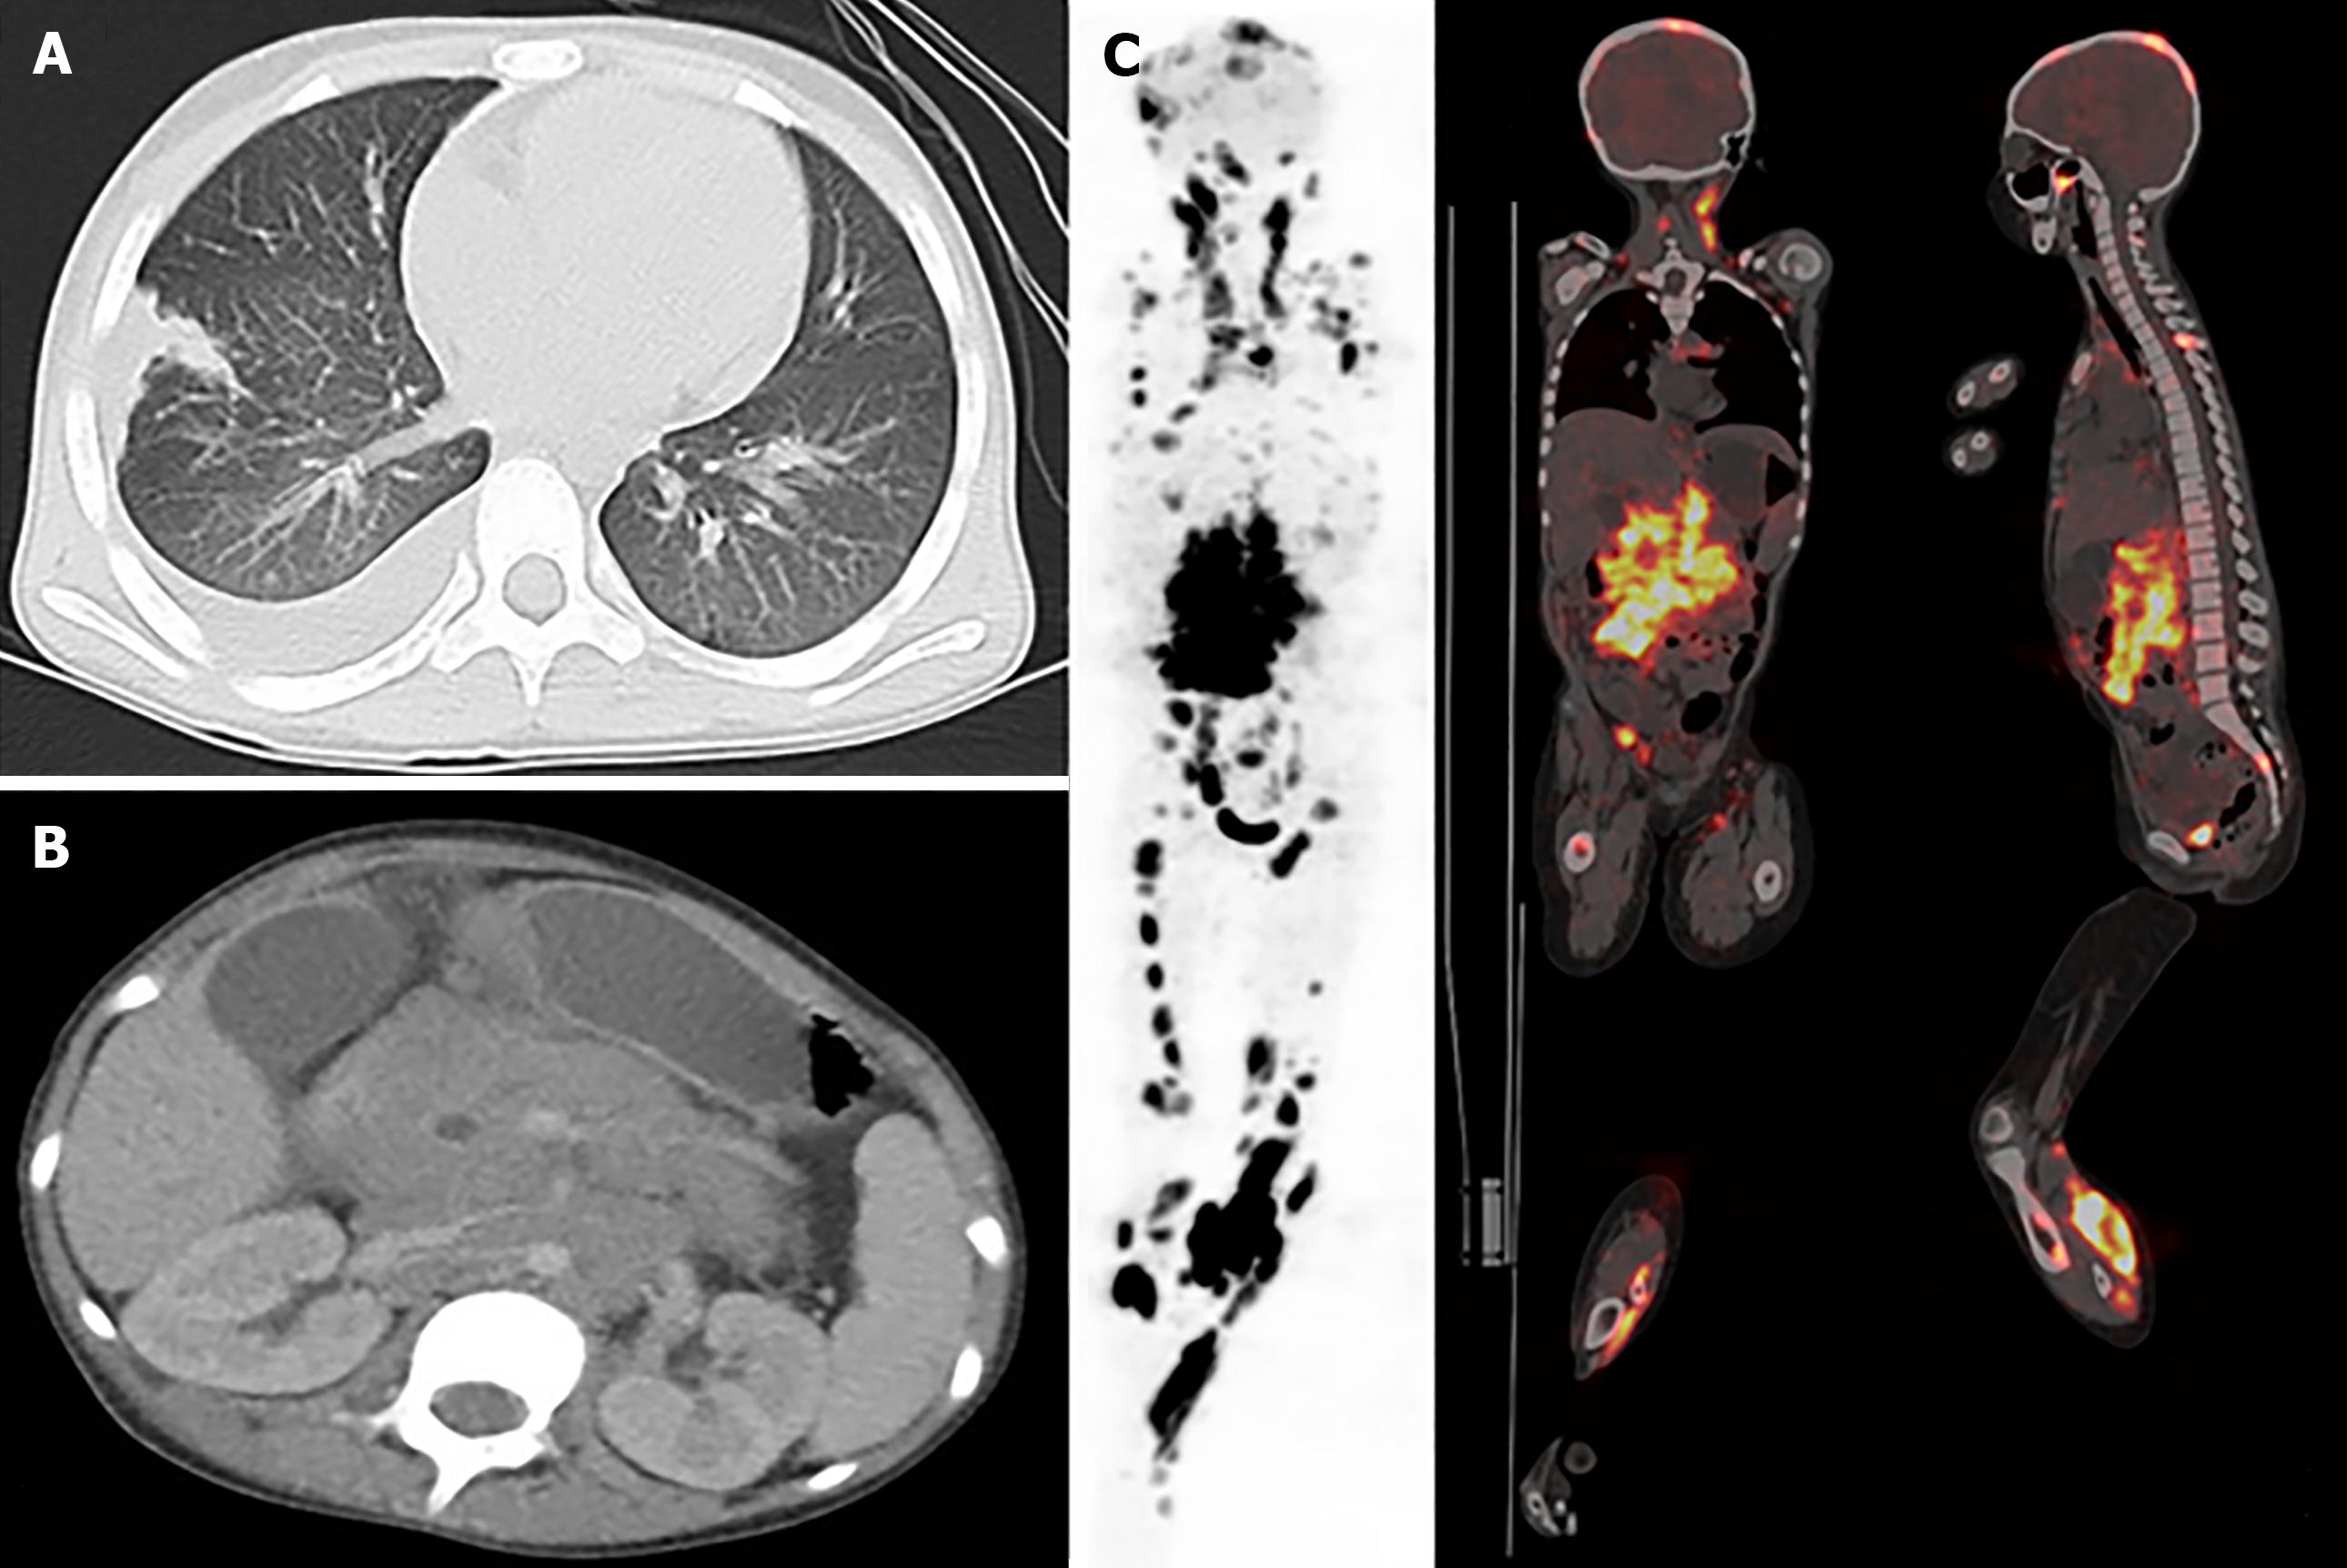
Figure 2 Images at diagnosis.
A and B: Computed tomography of the chest (A) and abdomen (B); C: Positron emission tomography/computed tomography scan of the whole body.
Figure 3 Wright–Giemsa-stained bone marrow smear.
A: 100 ×; B and C: 1000 ×. Anaplastic lymphoma cells differed in size and shape. They had eccentric nuclei, prominent nucleoli, and abundant cytoplasm containing prominent vacuoles.
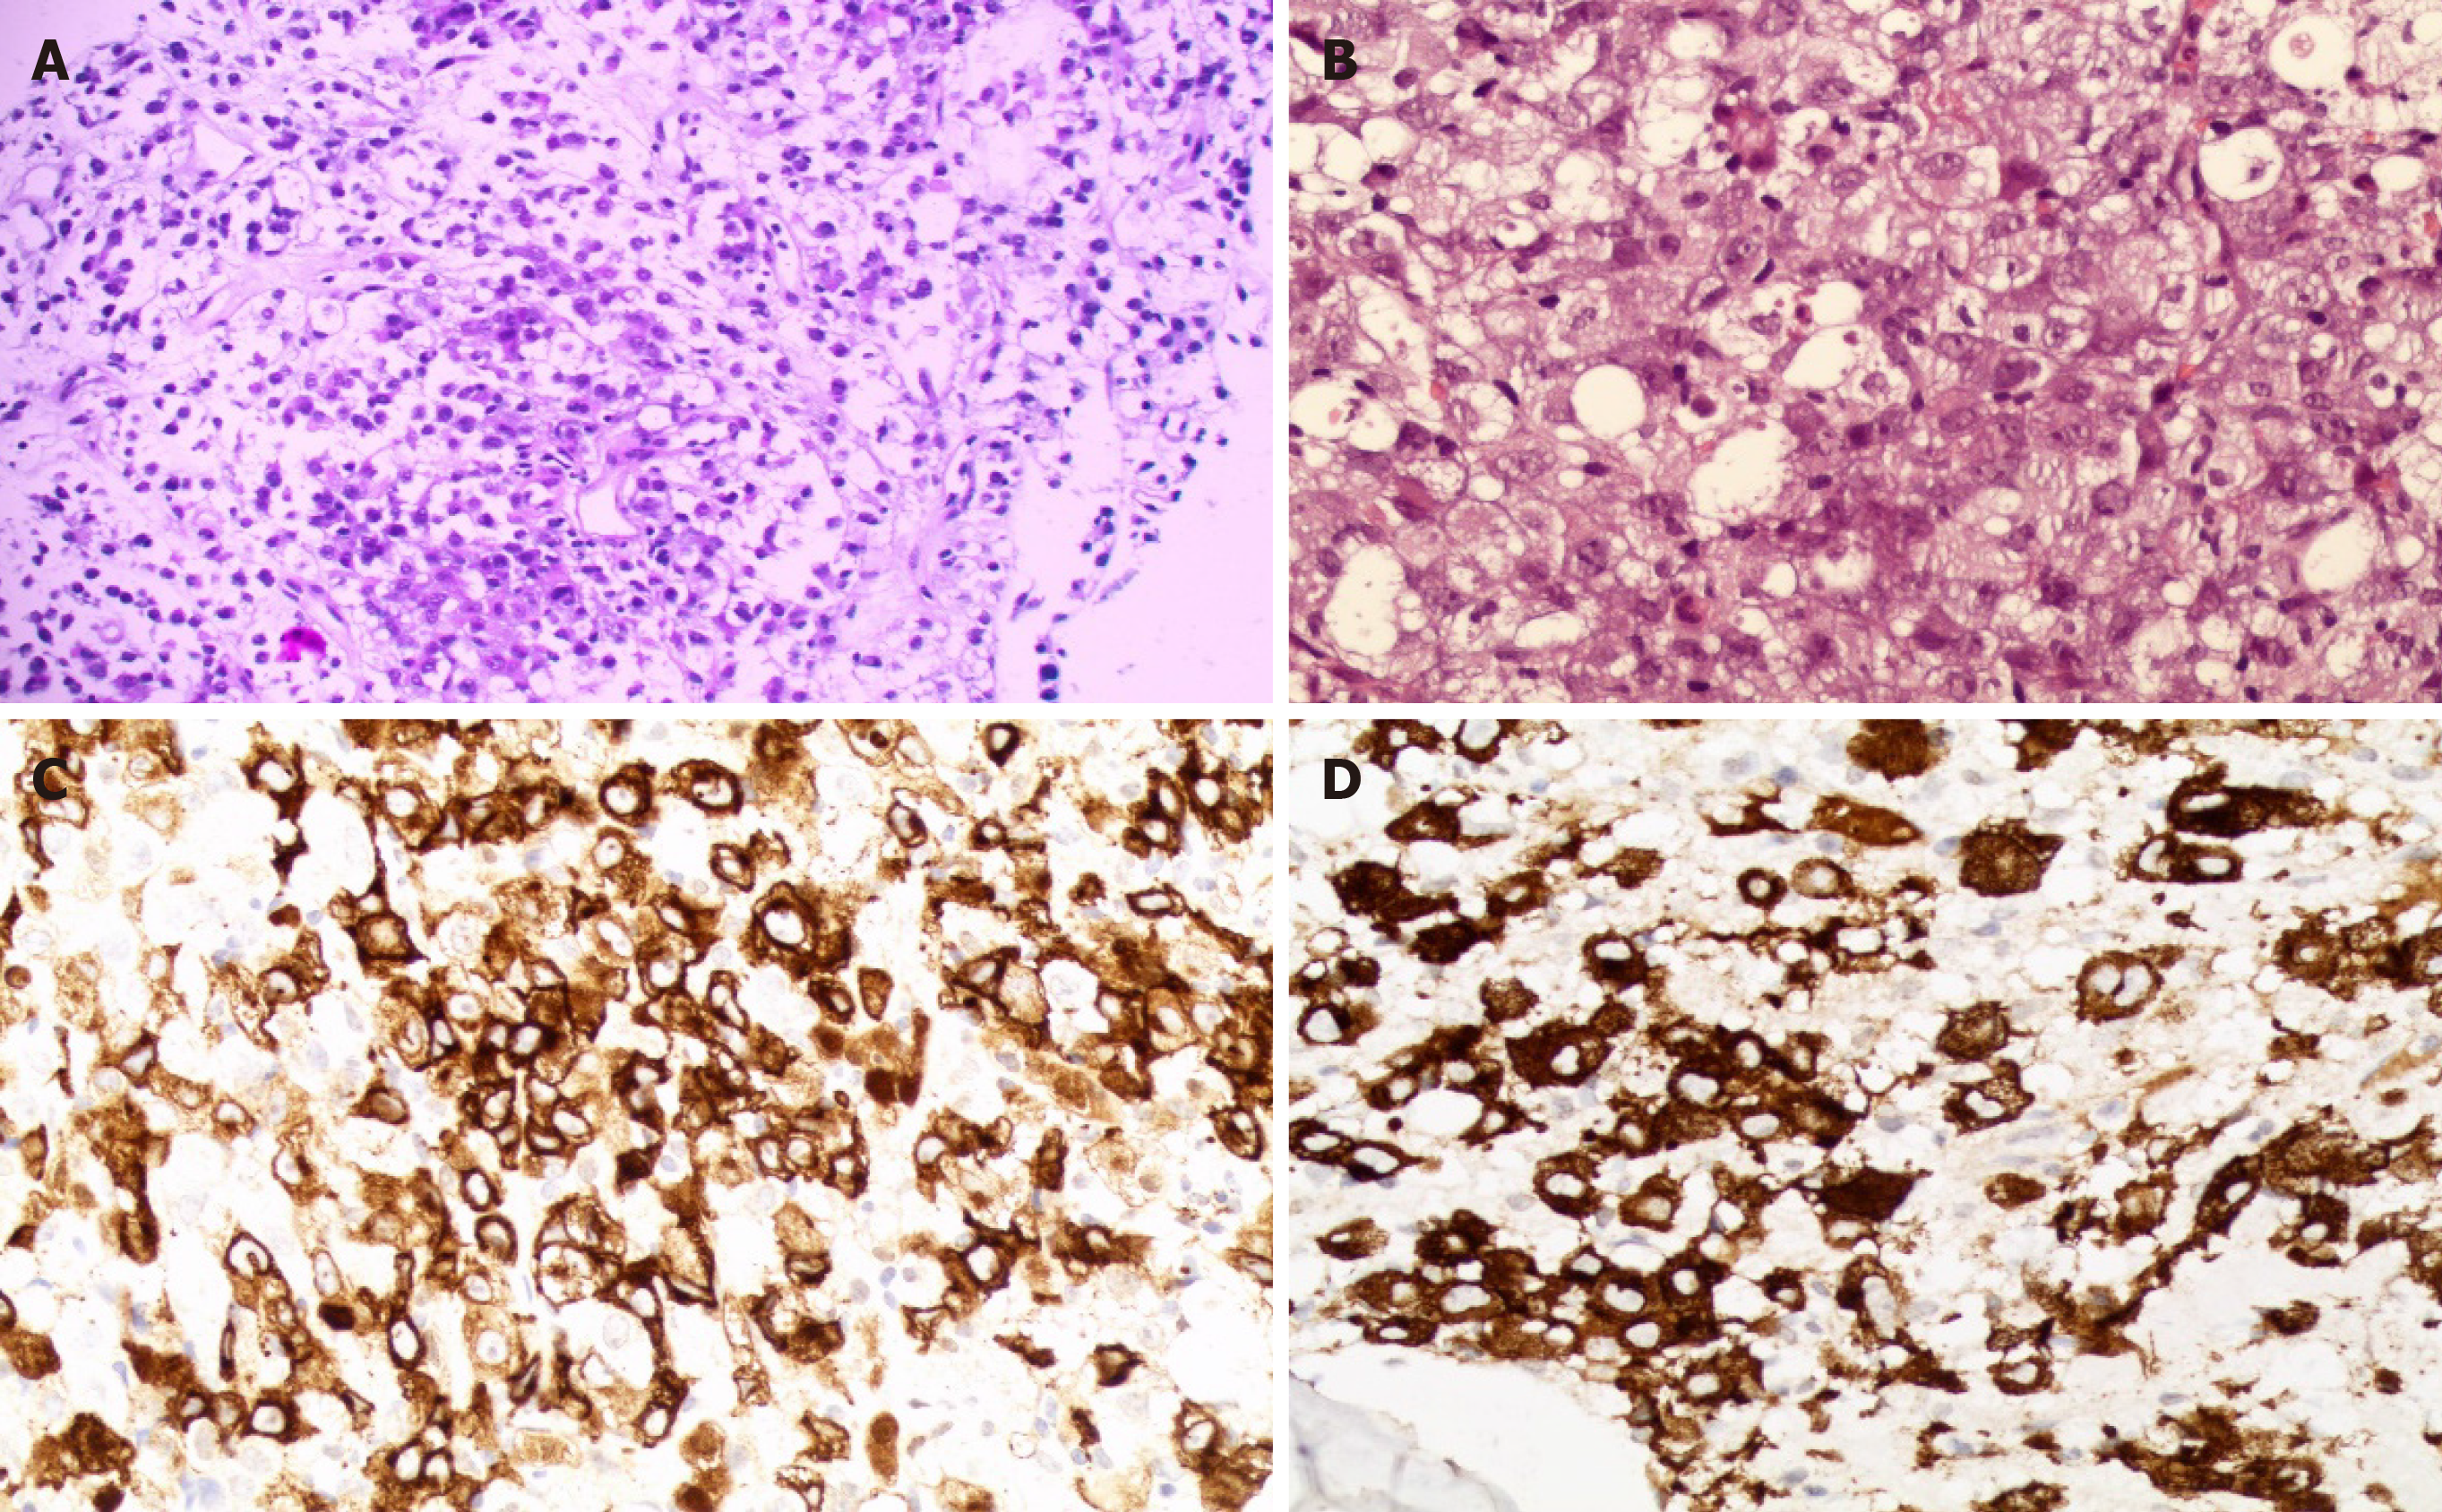
Figure 4 Histological and immunophenotypic results.
A: Hematoxylin–eosin-stained section of a lymph node; B: Hematoxylin–eosin-stained section of bone marrow biopsy; C: Positive CD30 staining; D: Positive ALK staining in a cytoplasmic pattern.
Figure 5 The sample at the diagnosis time-point showing the expected 270 bp CLTC-ALK reverse transcription-polymerase chain reaction product (three bands represent three repetitions) (A) and direct sequencing results of polymerase chain reaction products (B).
The arrow shows the translocation breakpoint (B).
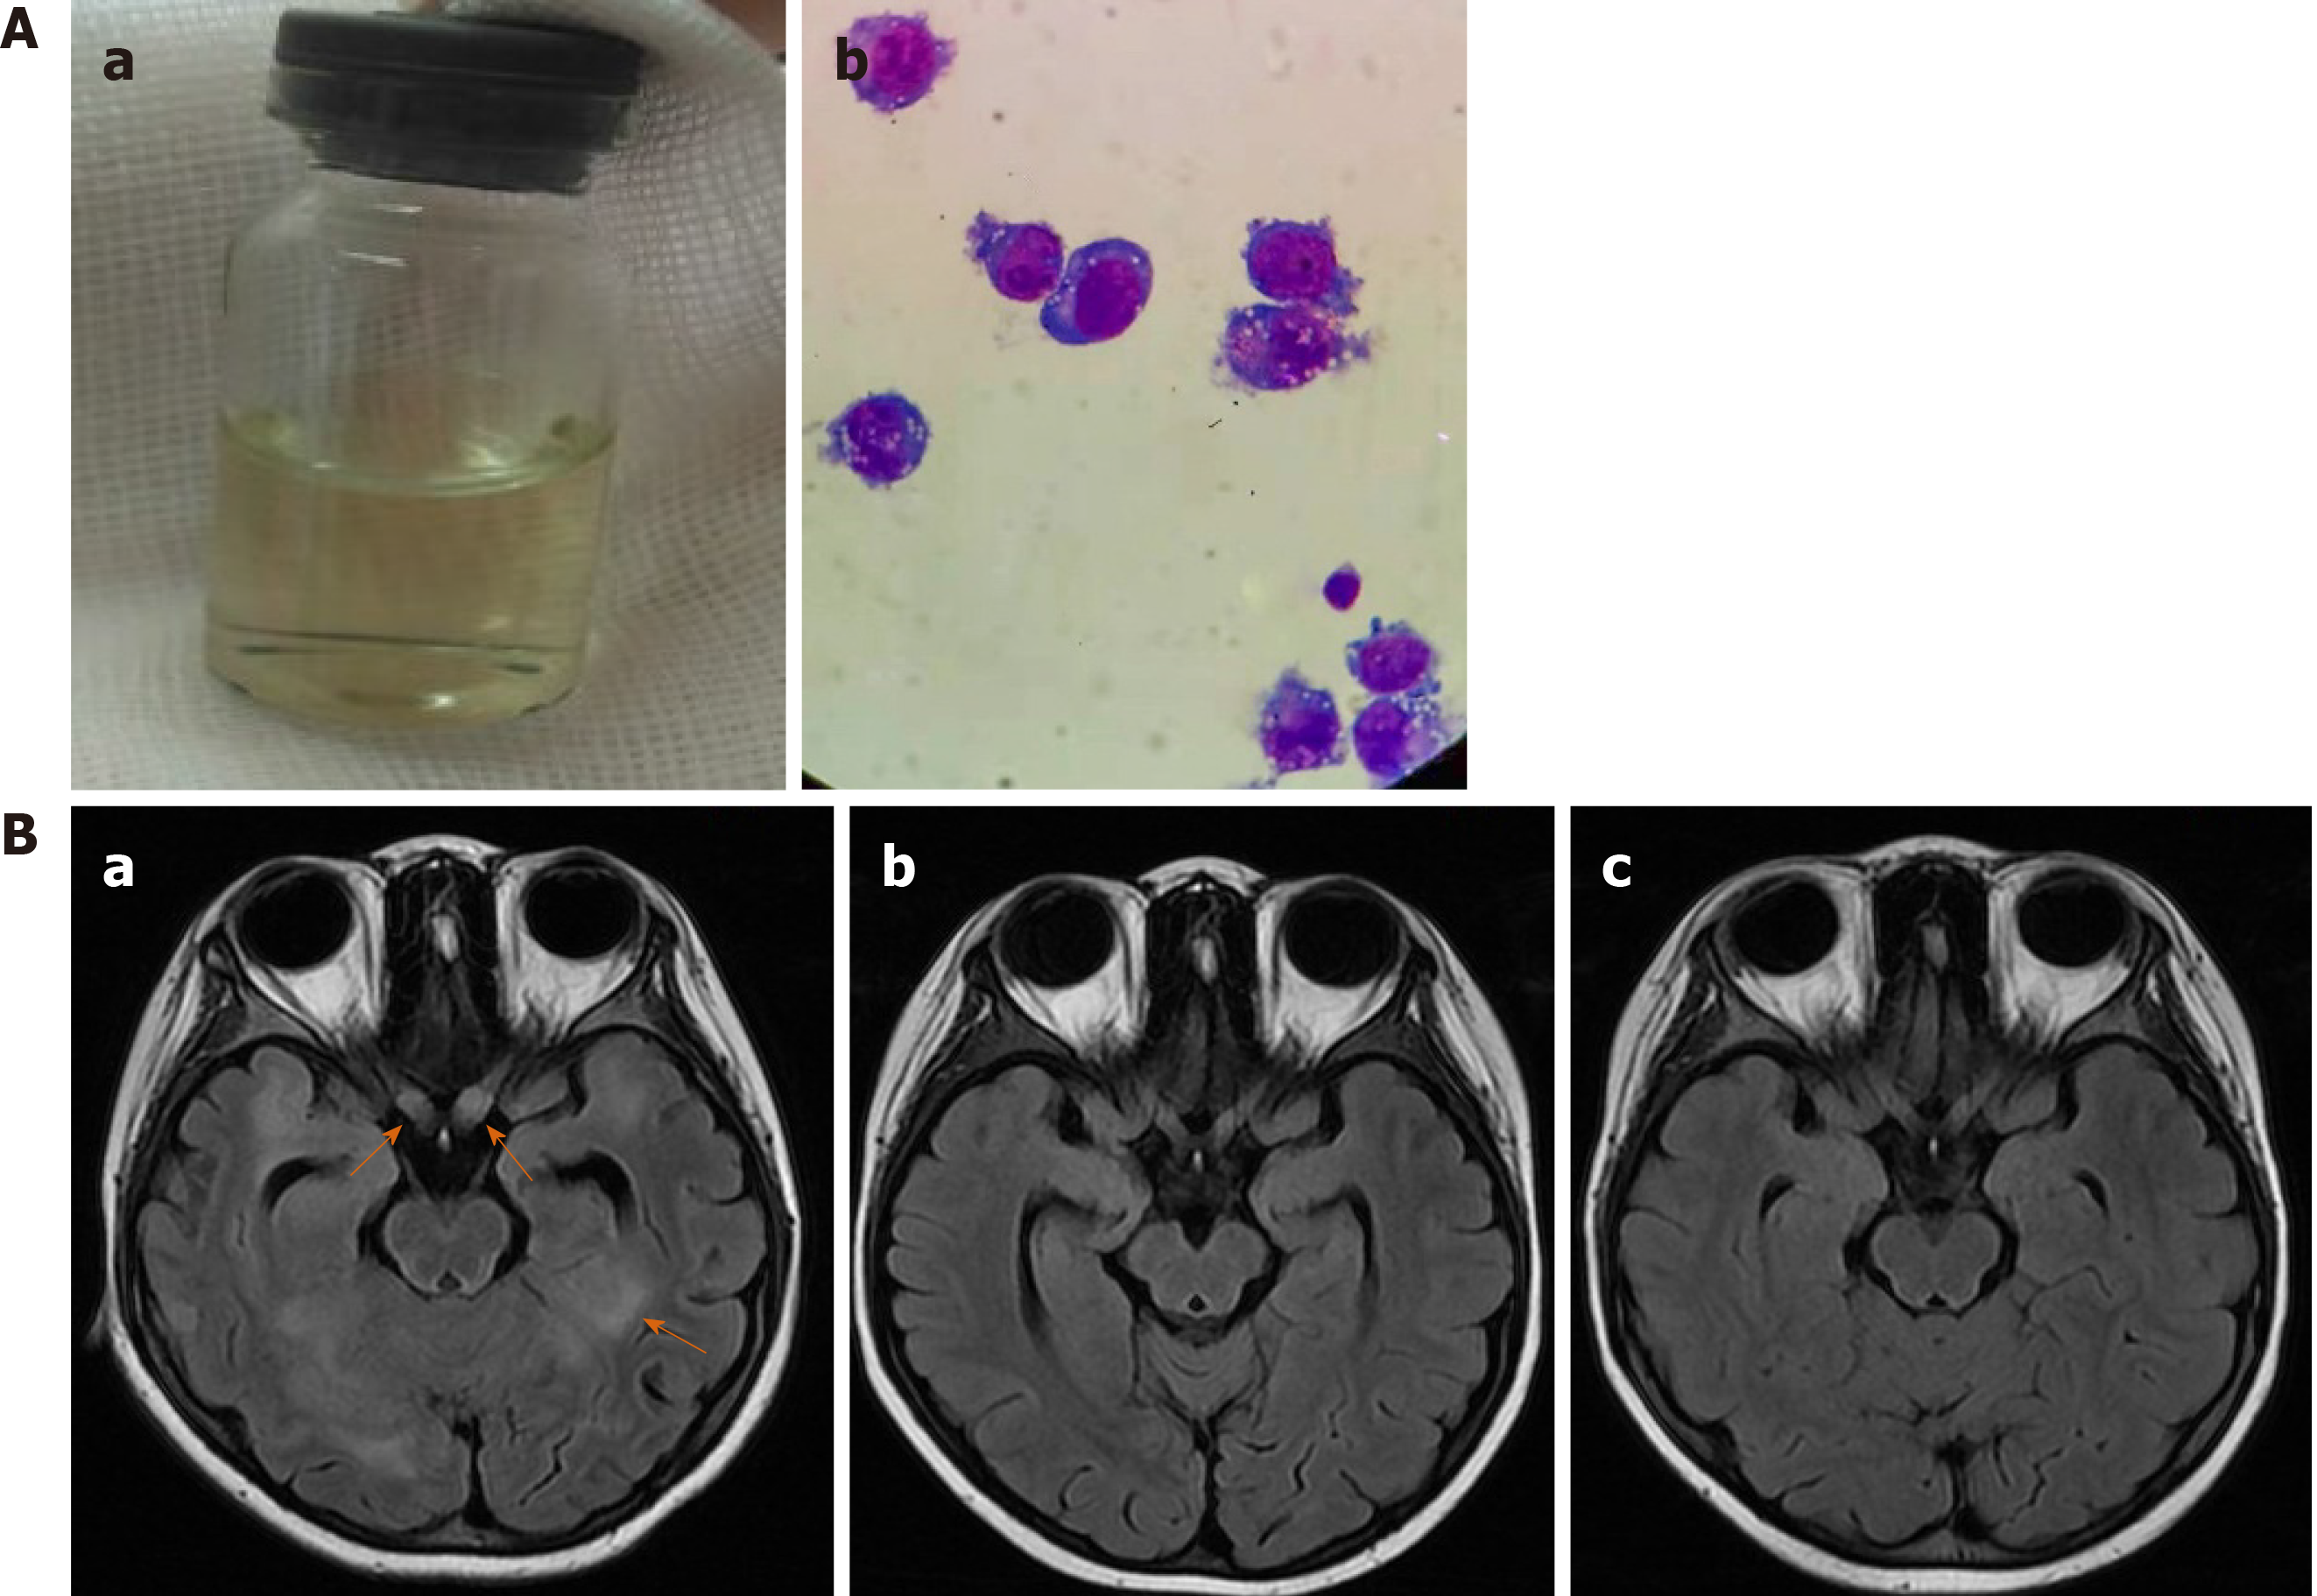
Figure 6 Central nervous system recurrence after 13 mo of treatment.
A: Yellow cerebral spinal fluid (a) and tumor cells on cytospin of cerebral spinal fluid (b); B: Magnetic resonance imaging images. a: New lesions in the brain parenchyma and enlarged bilateral optic nerves; b: The involvement of the brain and optic nerves shrank after 2 mo of chemotherapy and alectinib treatment; c: Complete remission after 4 mo of treatment.
- Citation: Yang J, Li J, Gu WY, Jin L, Duan YL, Huang S, Zhang M, Wang XS, Liu Y, Zhou CJ, Gao C, Zheng HY, Zhang YH. Central nervous system relapse in a pediatric anaplastic large cell lymphoma patient with CLTC/ALK translocation treated with alectinib: A case report. World J Clin Cases 2020; 8(9): 1685-1692
- URL: https://www.wjgnet.com/2307-8960/full/v8/i9/1685.htm
- DOI: https://dx.doi.org/10.12998/wjcc.v8.i9.1685


