Copyright
©The Author(s) 2020.
World J Clin Cases. May 6, 2020; 8(9): 1656-1665
Published online May 6, 2020. doi: 10.12998/wjcc.v8.i9.1656
Published online May 6, 2020. doi: 10.12998/wjcc.v8.i9.1656
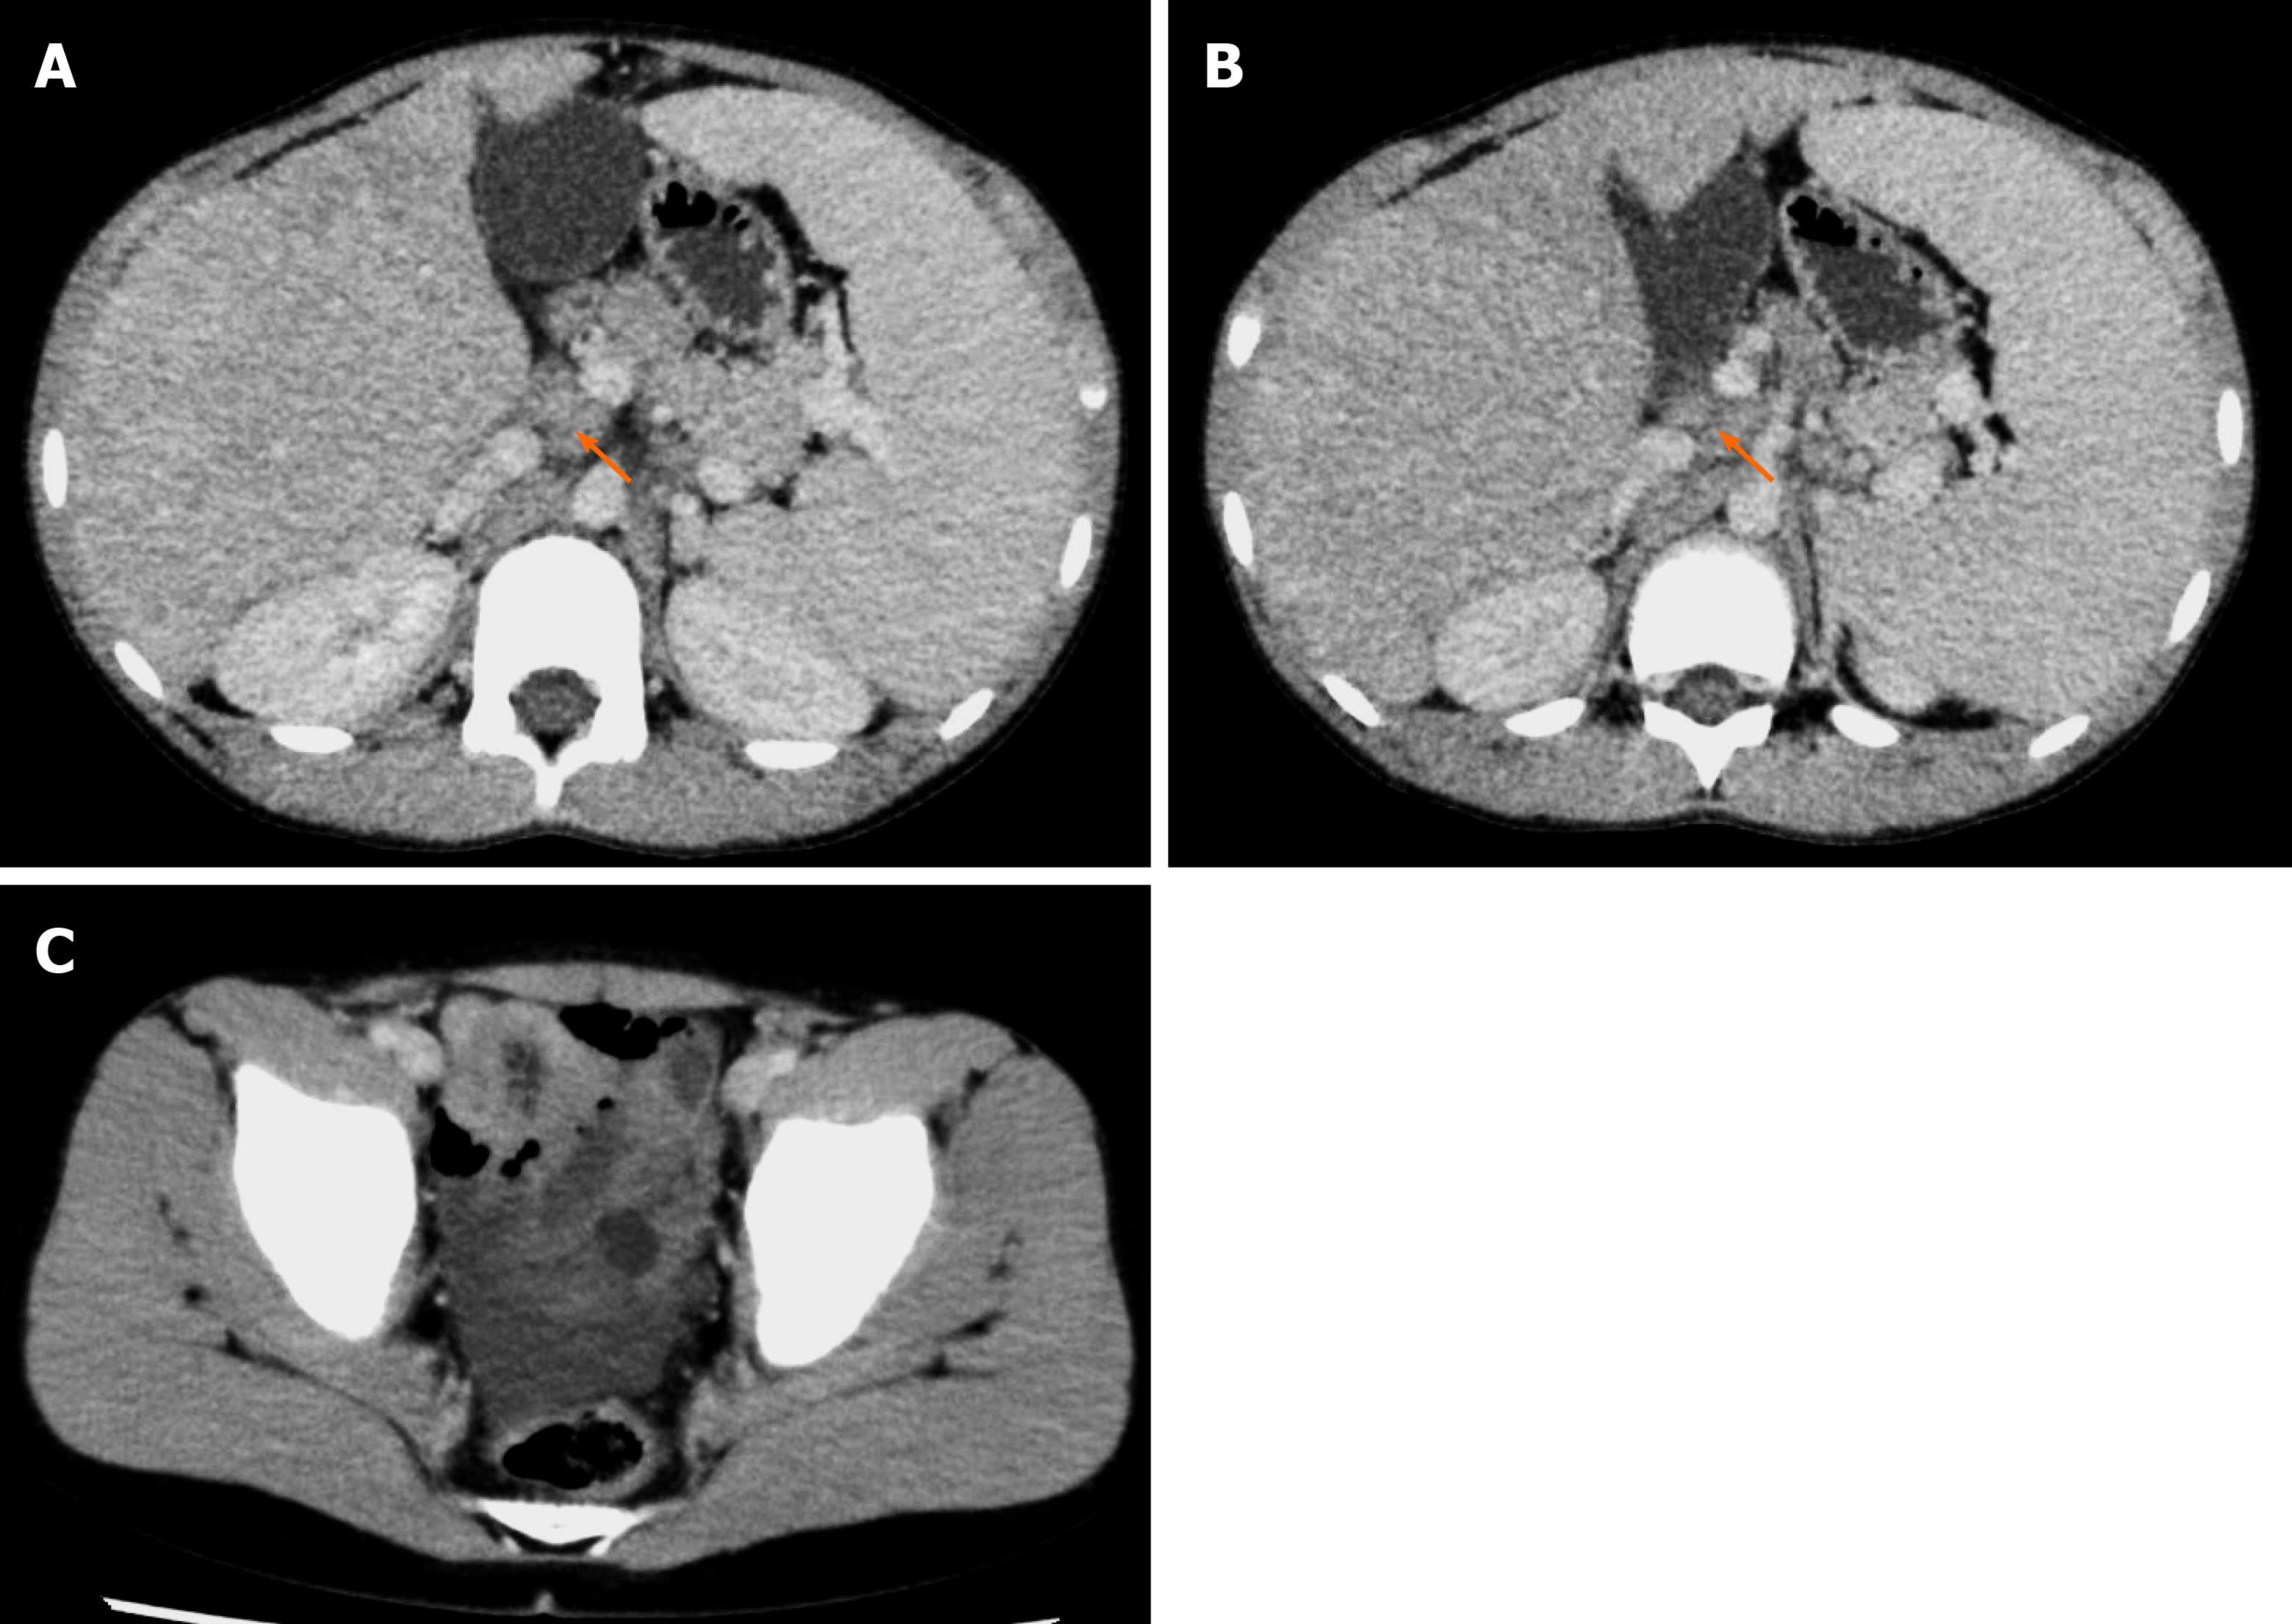
Figure 1 Abdominal contrast computed tomography.
A and B: Arrow represents hepatic lymphadenopathy; C: A small number of ascites was observed.
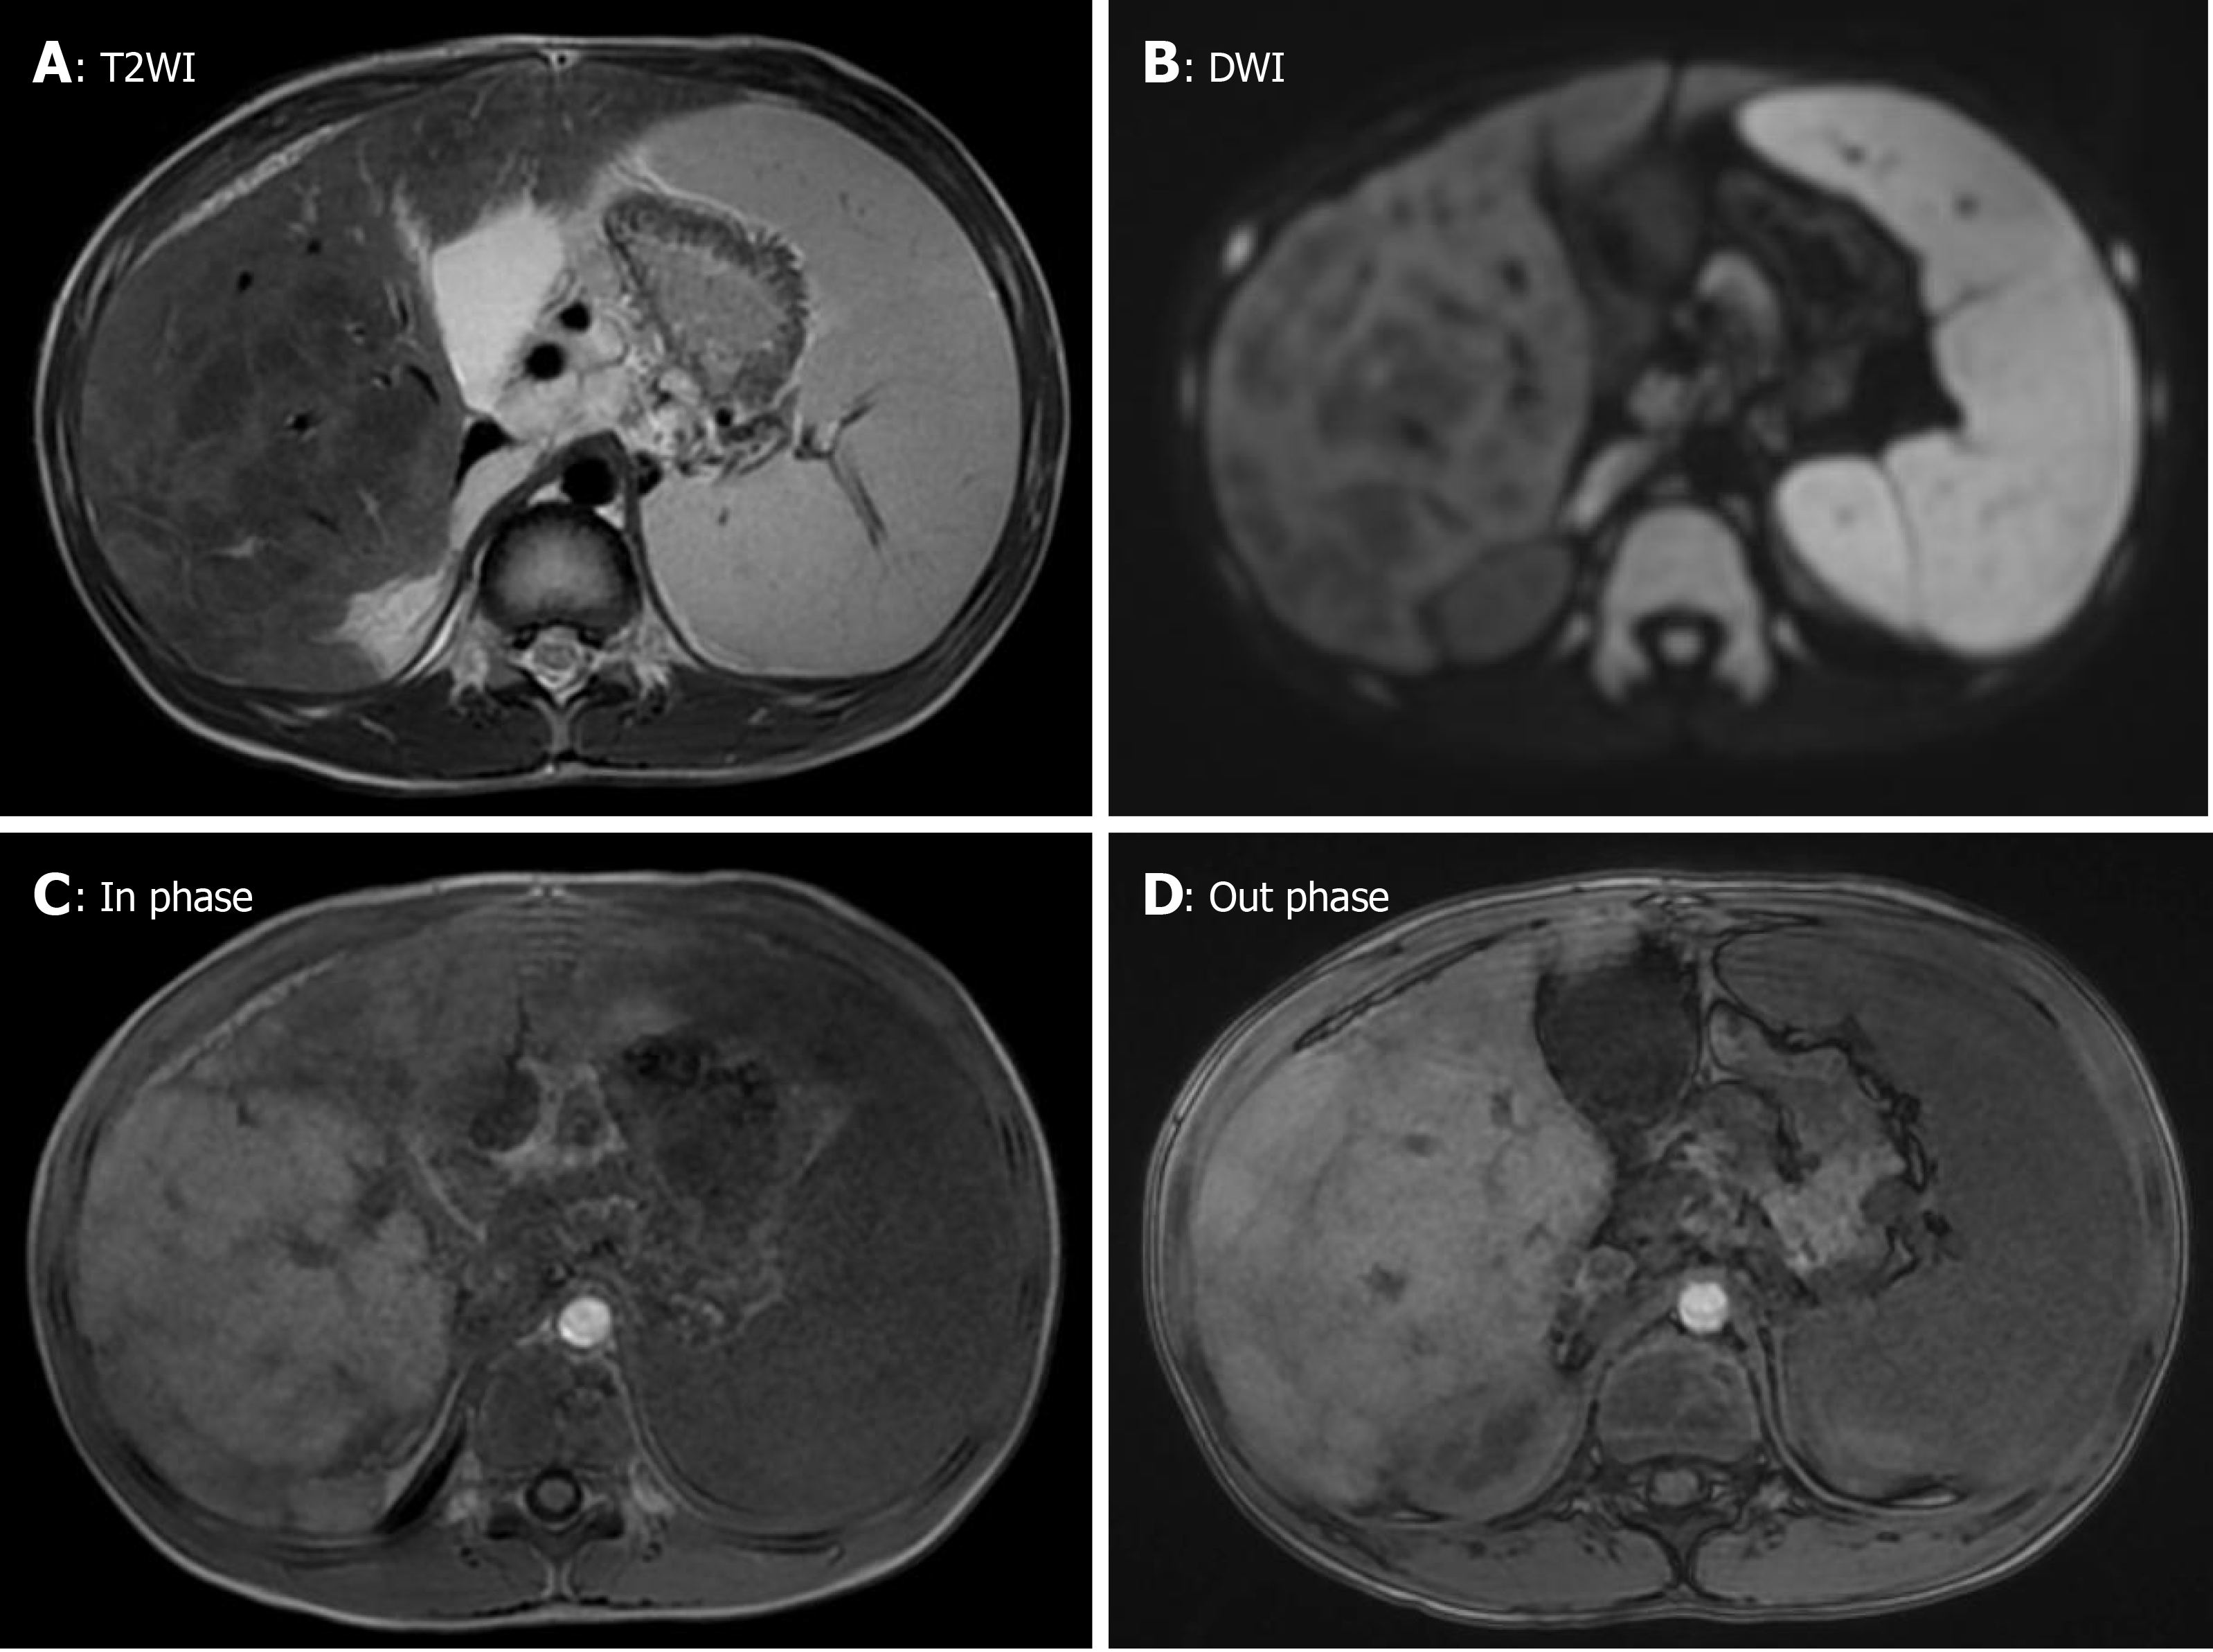
Figure 2 Abdominal enhanced magnetic resonance imaging.
A and B: Multiple nodules were observed in the liver; C and D: No washout of the contrast agent in the nodules was detected in the late phase of contrast enhancement.
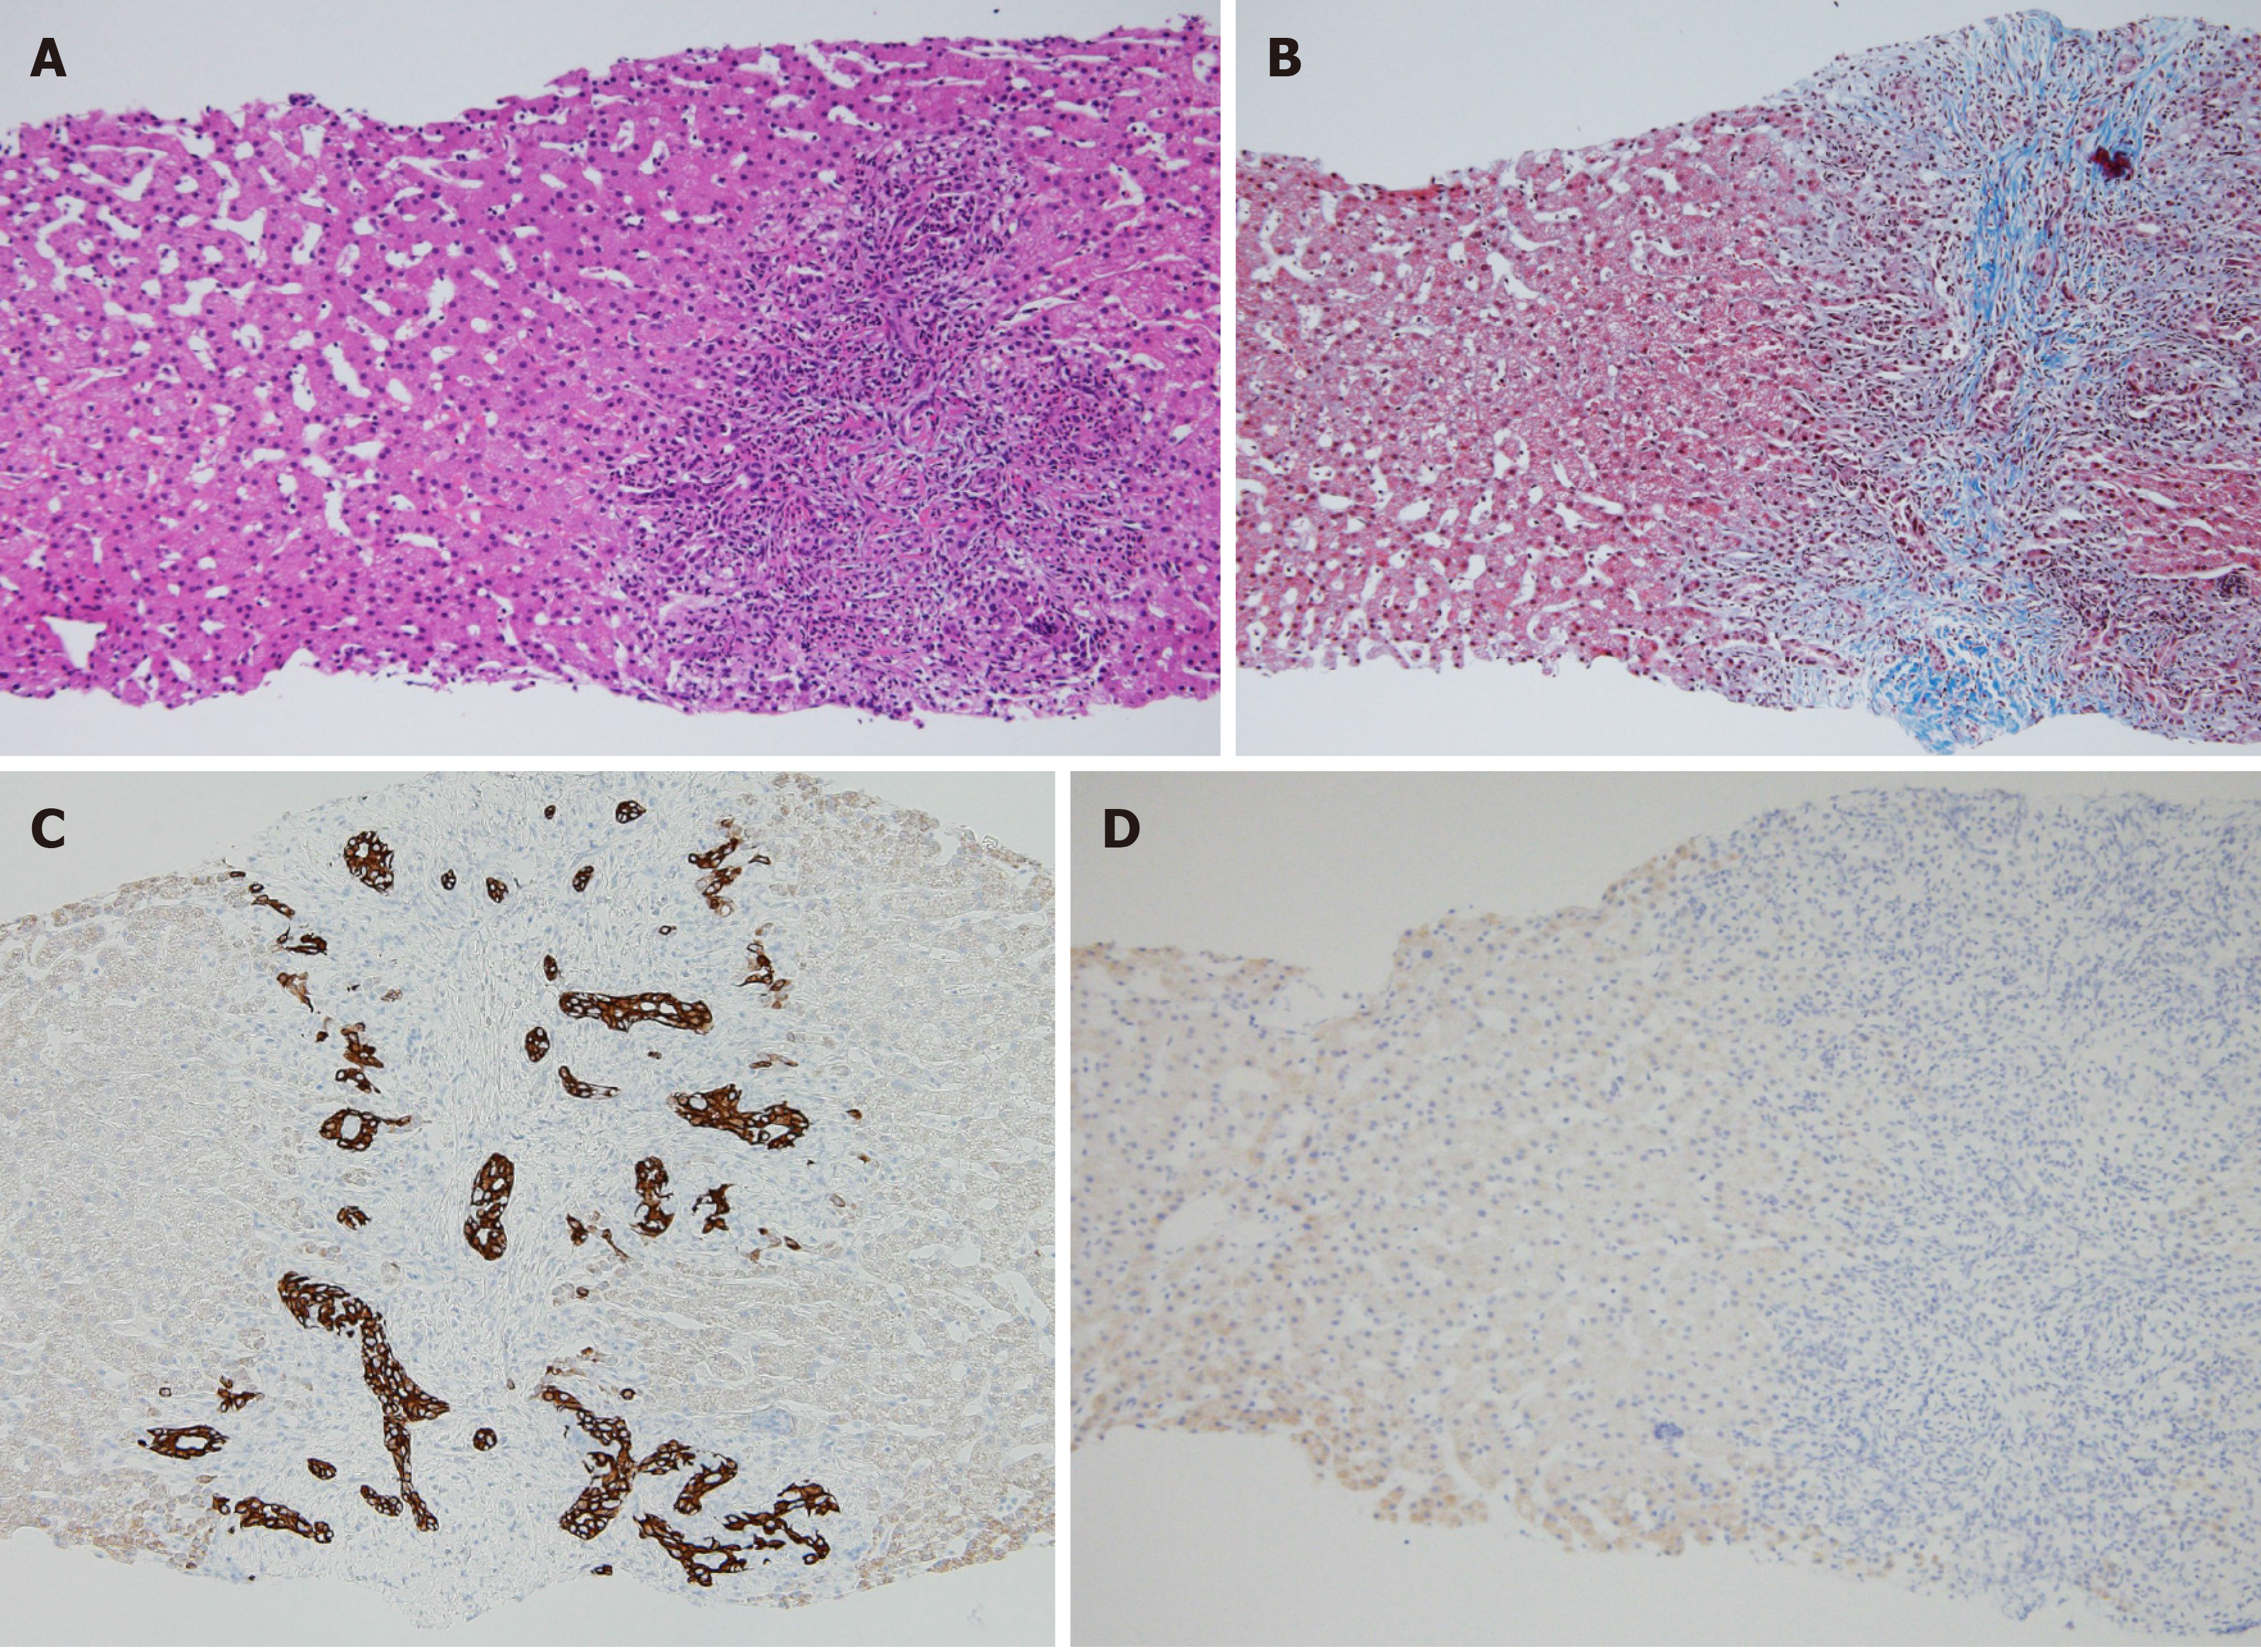
Figure 3 Liver histopathology.
A: Hematoxylin and eosin staining (magnification, 100 ×); Dilated sinusoids and fibrotic expansion of the portal area, as well as marked inflammatory cells infiltration, were observed; B: Masson trichrome staining (magnification, 100 ×); Fibrosis was observed in the portal area; C: CK7 staining (magnification, 100 ×); Bile duct hyperplasia was observed; D: IgG4 staining (magnification, 100 ×); IgG4 was not stained.
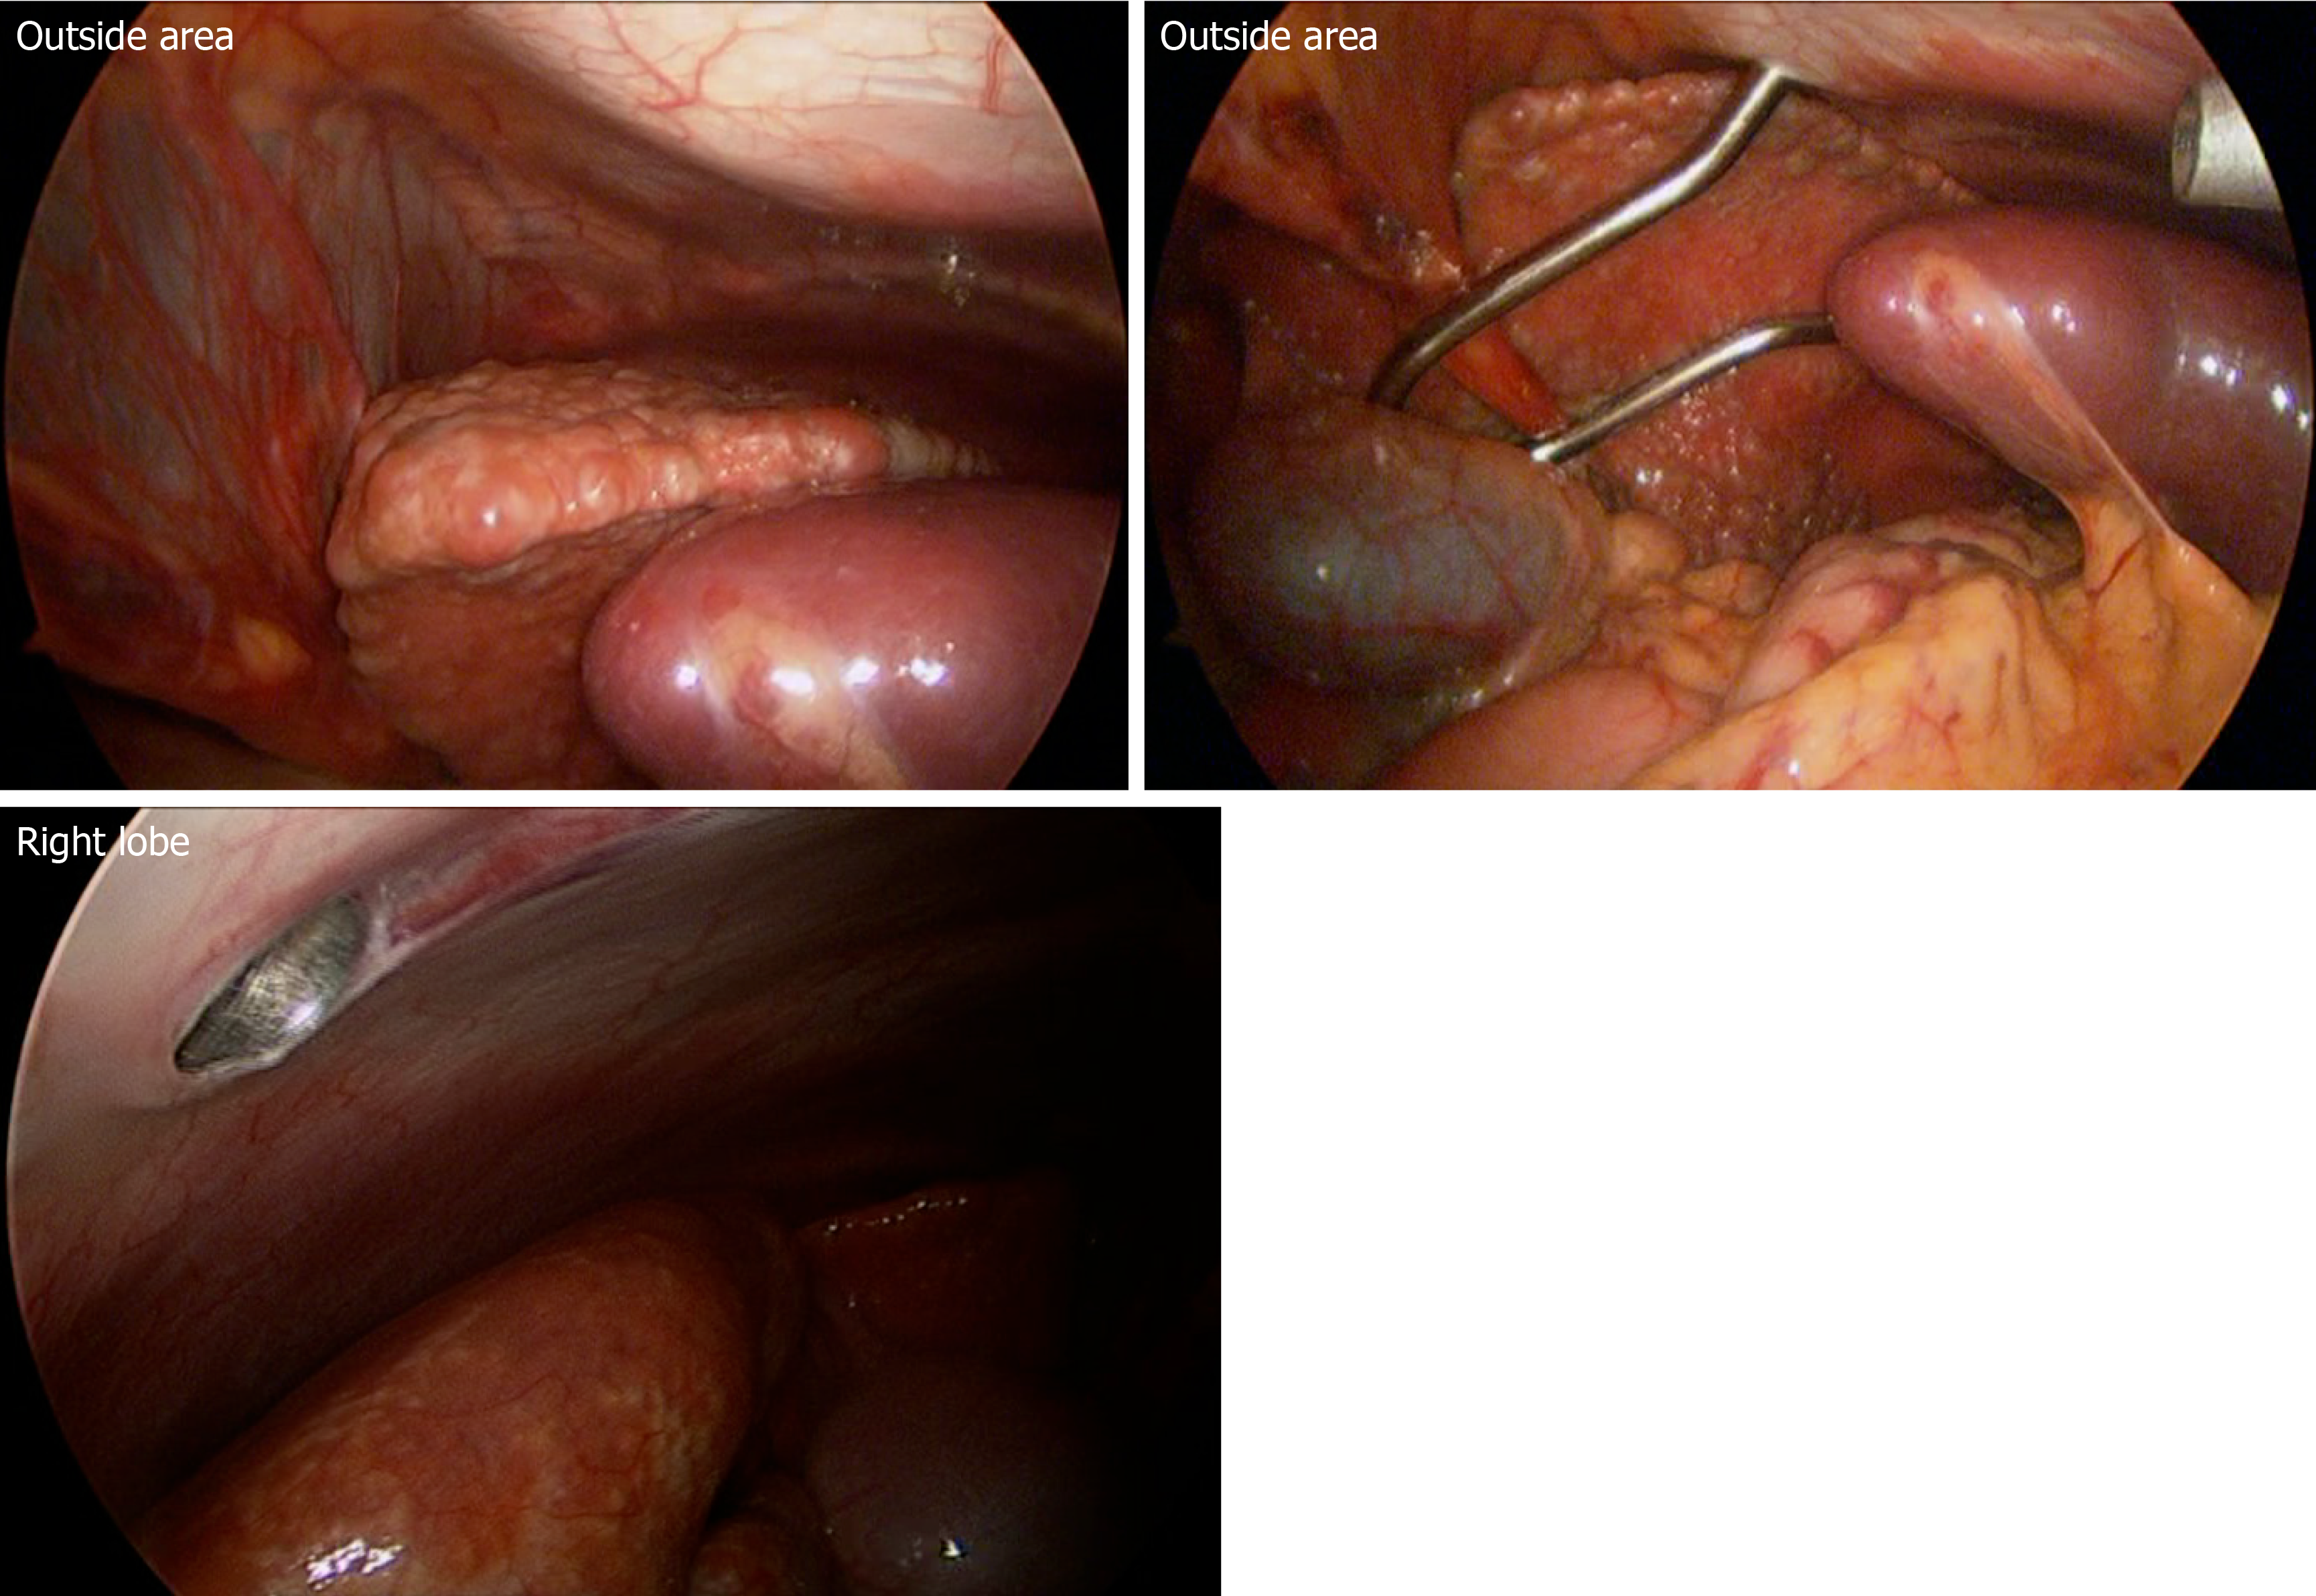
Figure 4 Intraoperative findings of porta hepatis lymph nodes.
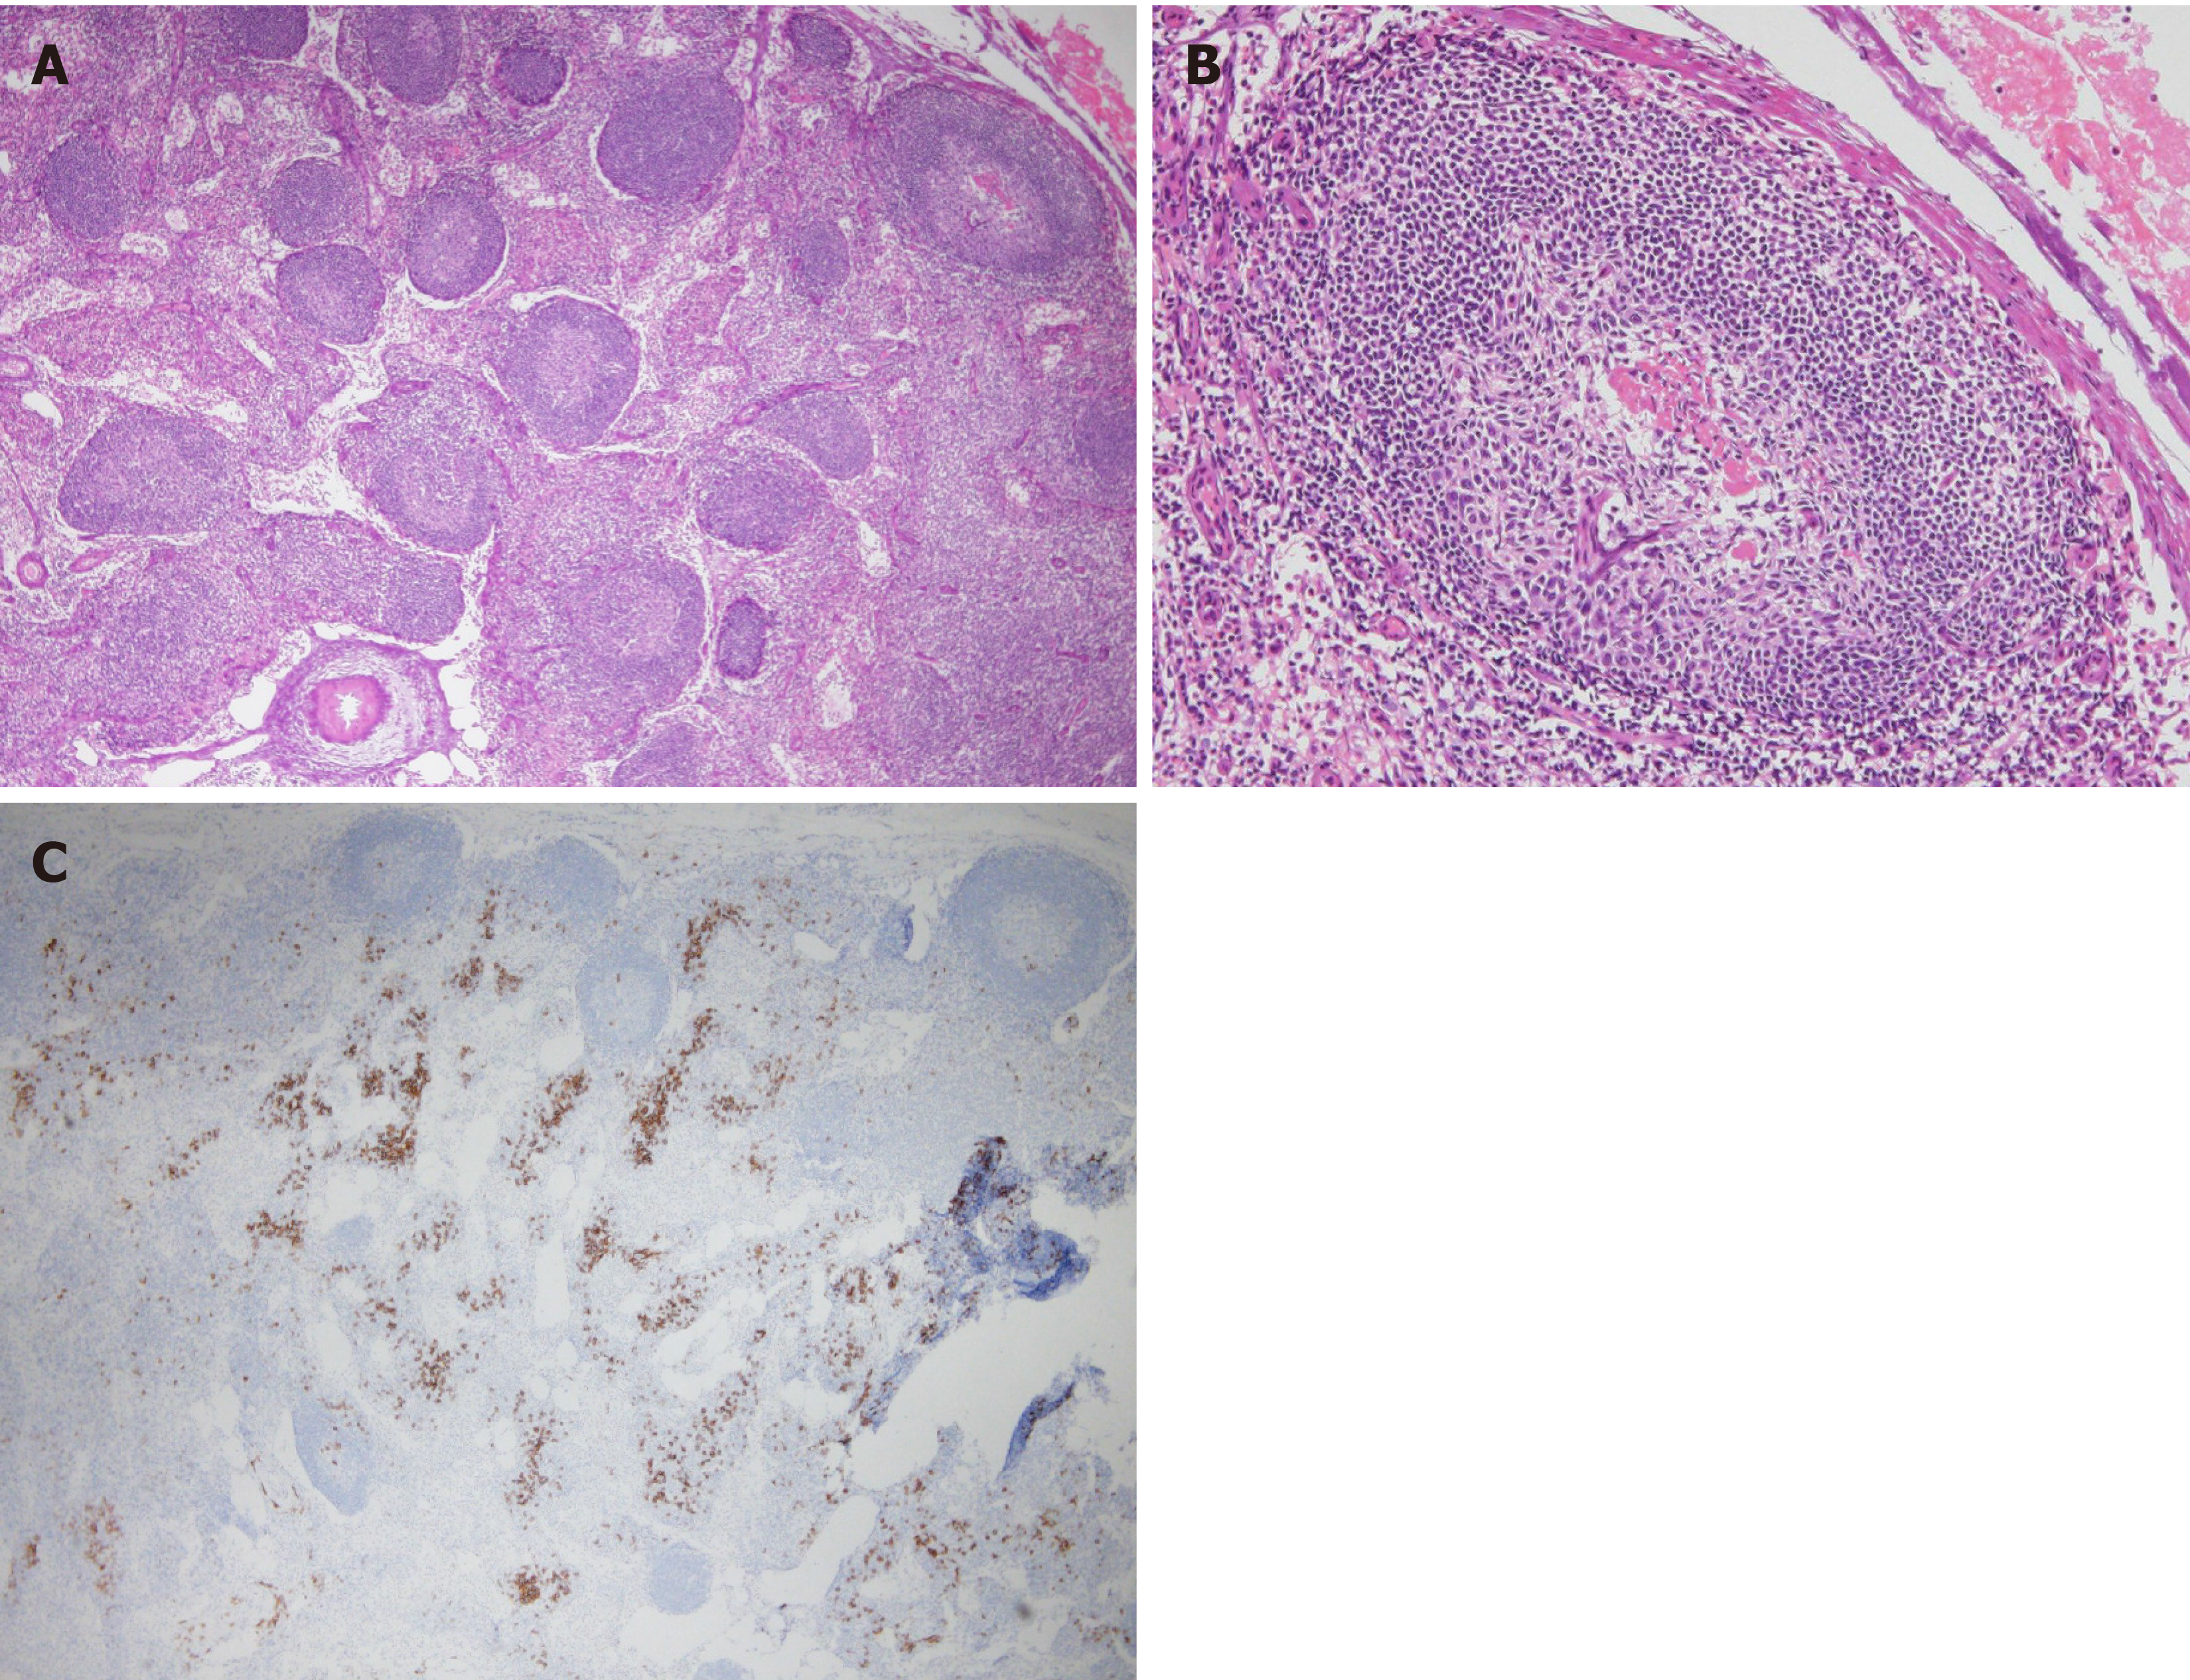
Figure 5 Lymph node tissue in the porta hepatis.
A: Hematoxylin and eosin staining (magnification, 40 ×); Hyperplasia and atrophy of lymphoid follicles were observed; B: Hematoxylin and eosin staining (magnification, 100 ×); Lymphoid proliferation with some vascular hyperplasia was observed; C: CD21 staining (magnification, 200 ×); Moderate plasmacytosis was observed in the lymphoid follicles.
- Citation: Kobayashi S, Inui A, Tsunoda T, Umetsu S, Sogo T, Mori M, Shinkai M, Fujisawa T. Liver cirrhosis in a child associated with Castleman's disease: A case report. World J Clin Cases 2020; 8(9): 1656-1665
- URL: https://www.wjgnet.com/2307-8960/full/v8/i9/1656.htm
- DOI: https://dx.doi.org/10.12998/wjcc.v8.i9.1656


