Copyright
©The Author(s) 2020.
World J Clin Cases. Feb 26, 2020; 8(4): 838-847
Published online Feb 26, 2020. doi: 10.12998/wjcc.v8.i4.838
Published online Feb 26, 2020. doi: 10.12998/wjcc.v8.i4.838
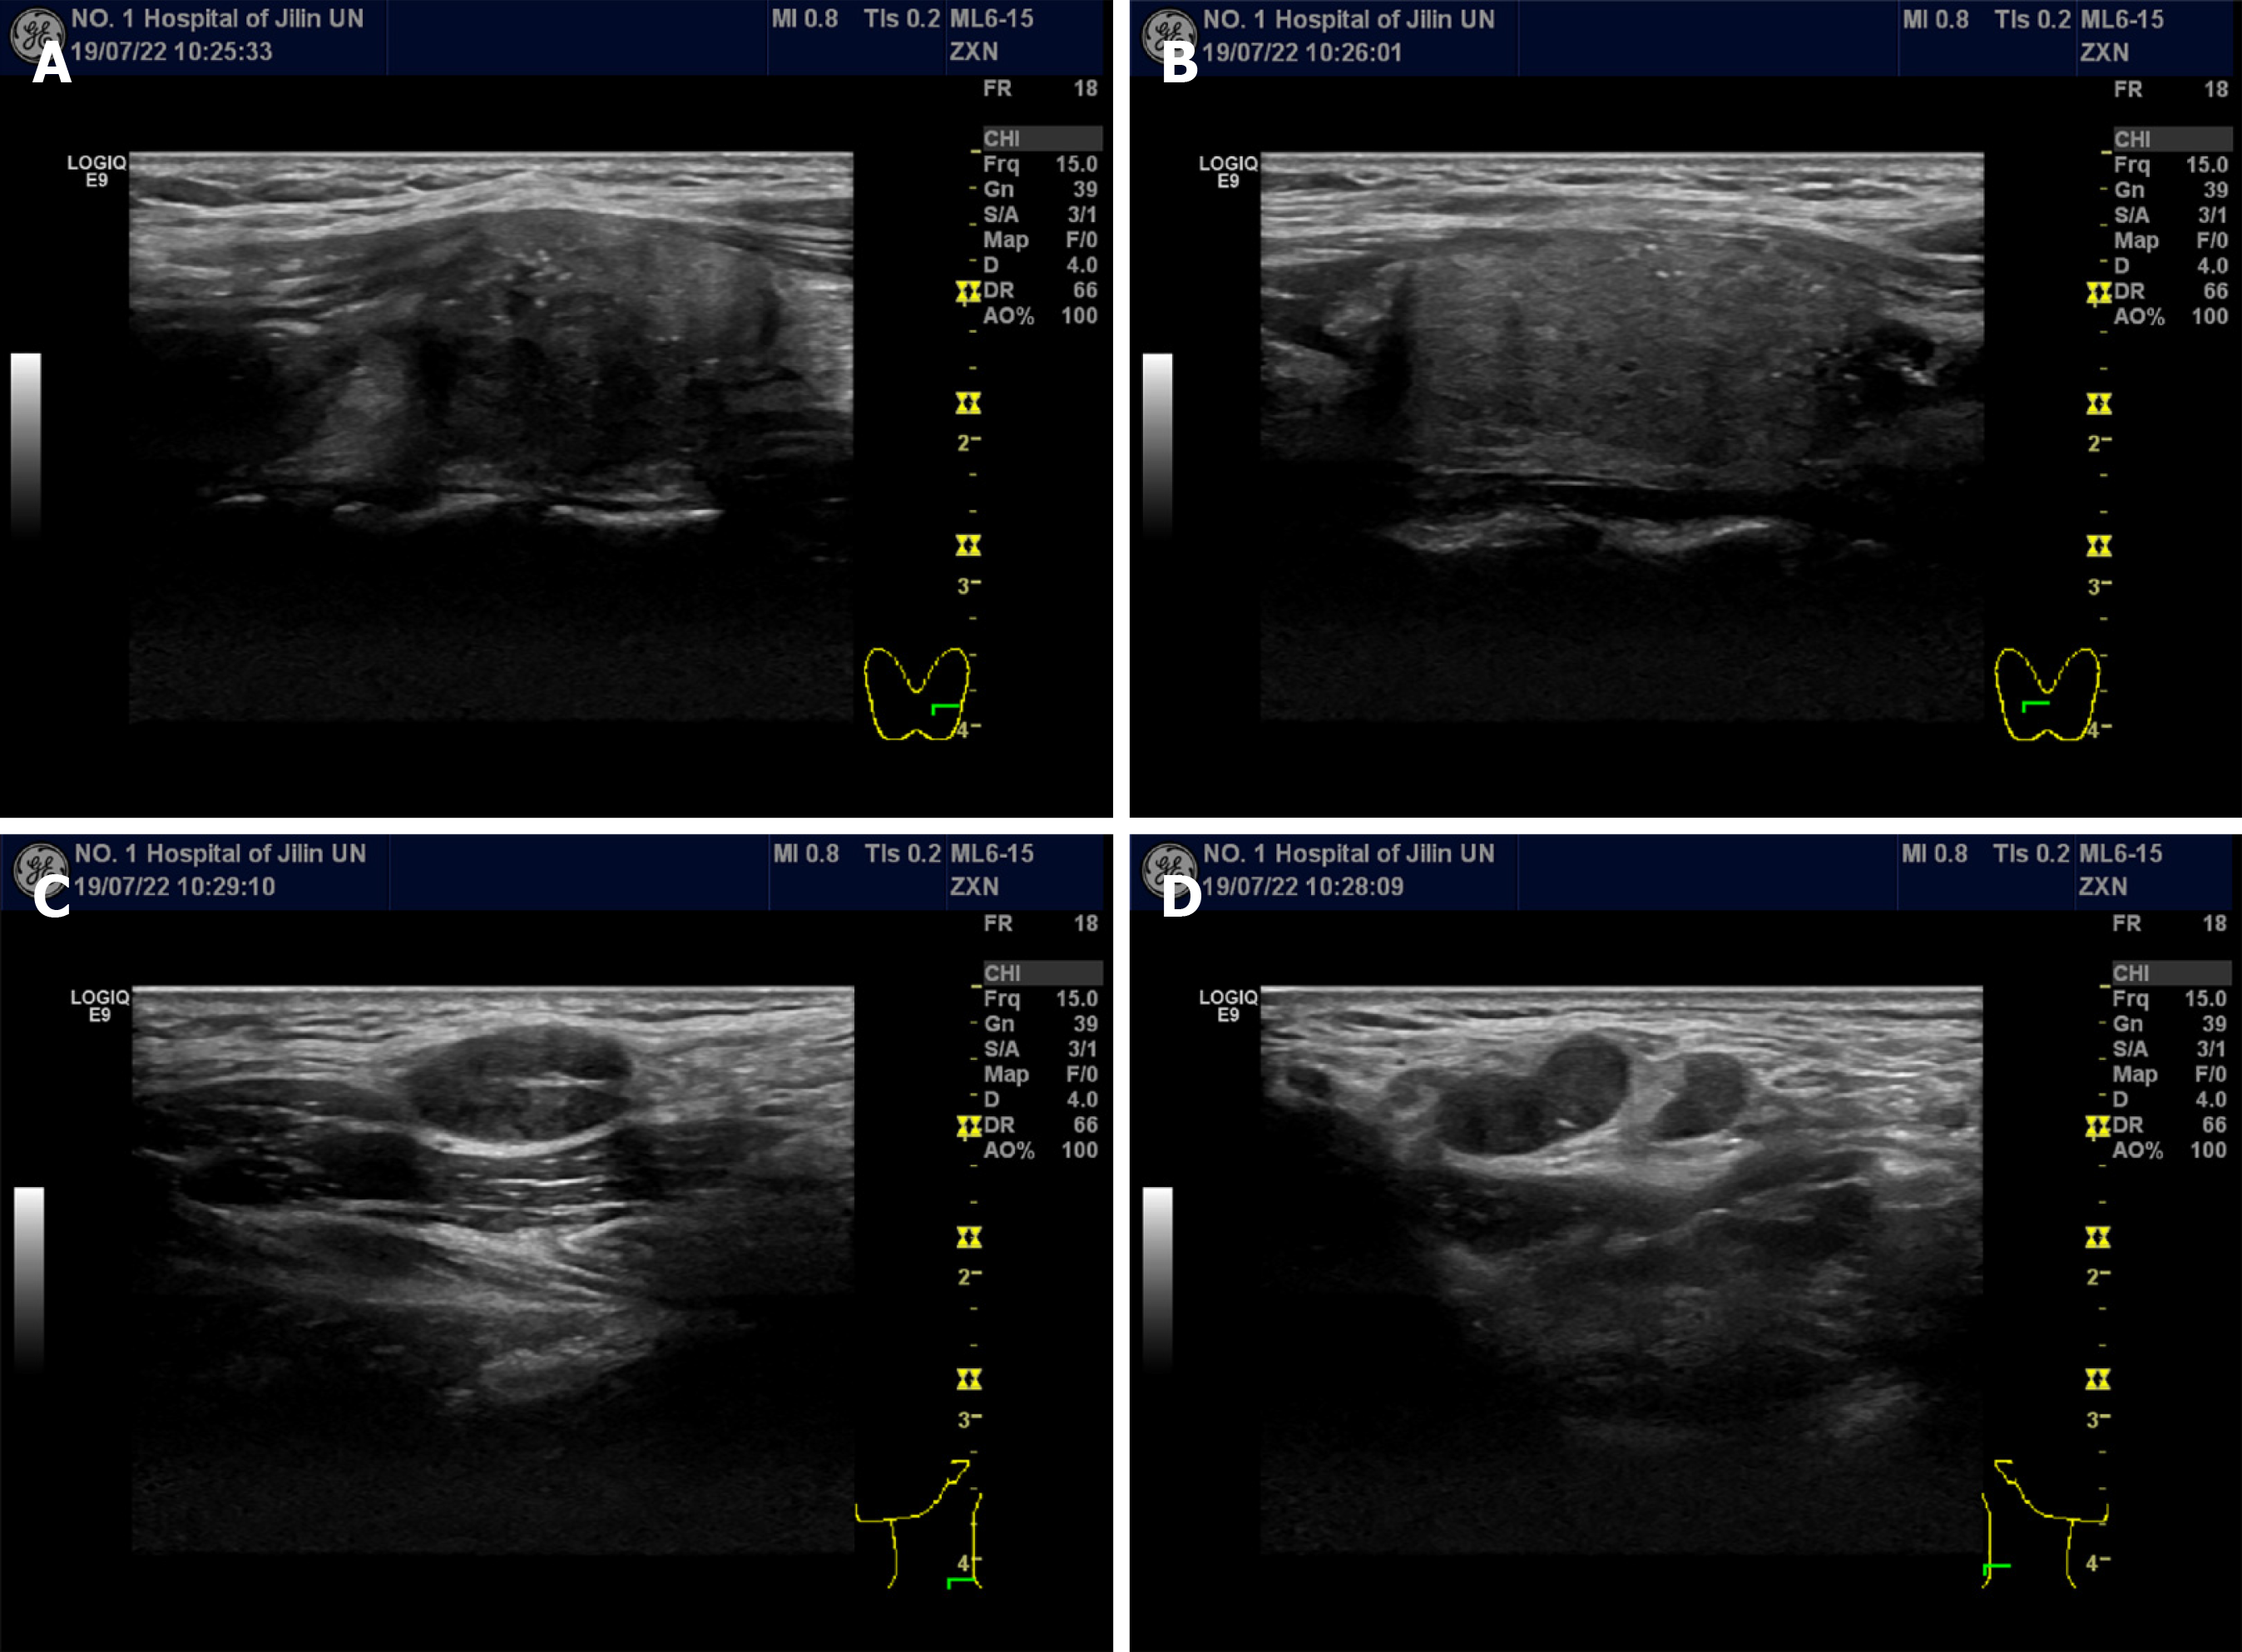
Figure 1 Ultrasonography of the thyroid and lateral neck.
A and B: Left (A) and right (B) thyroid lobes; solid, hypoechoic thyroid nodules with irregular margins could be observed; C and D: Left (C) and right (D) lateral neck; enlarged metastatic lateral lymph nodes could be observed.
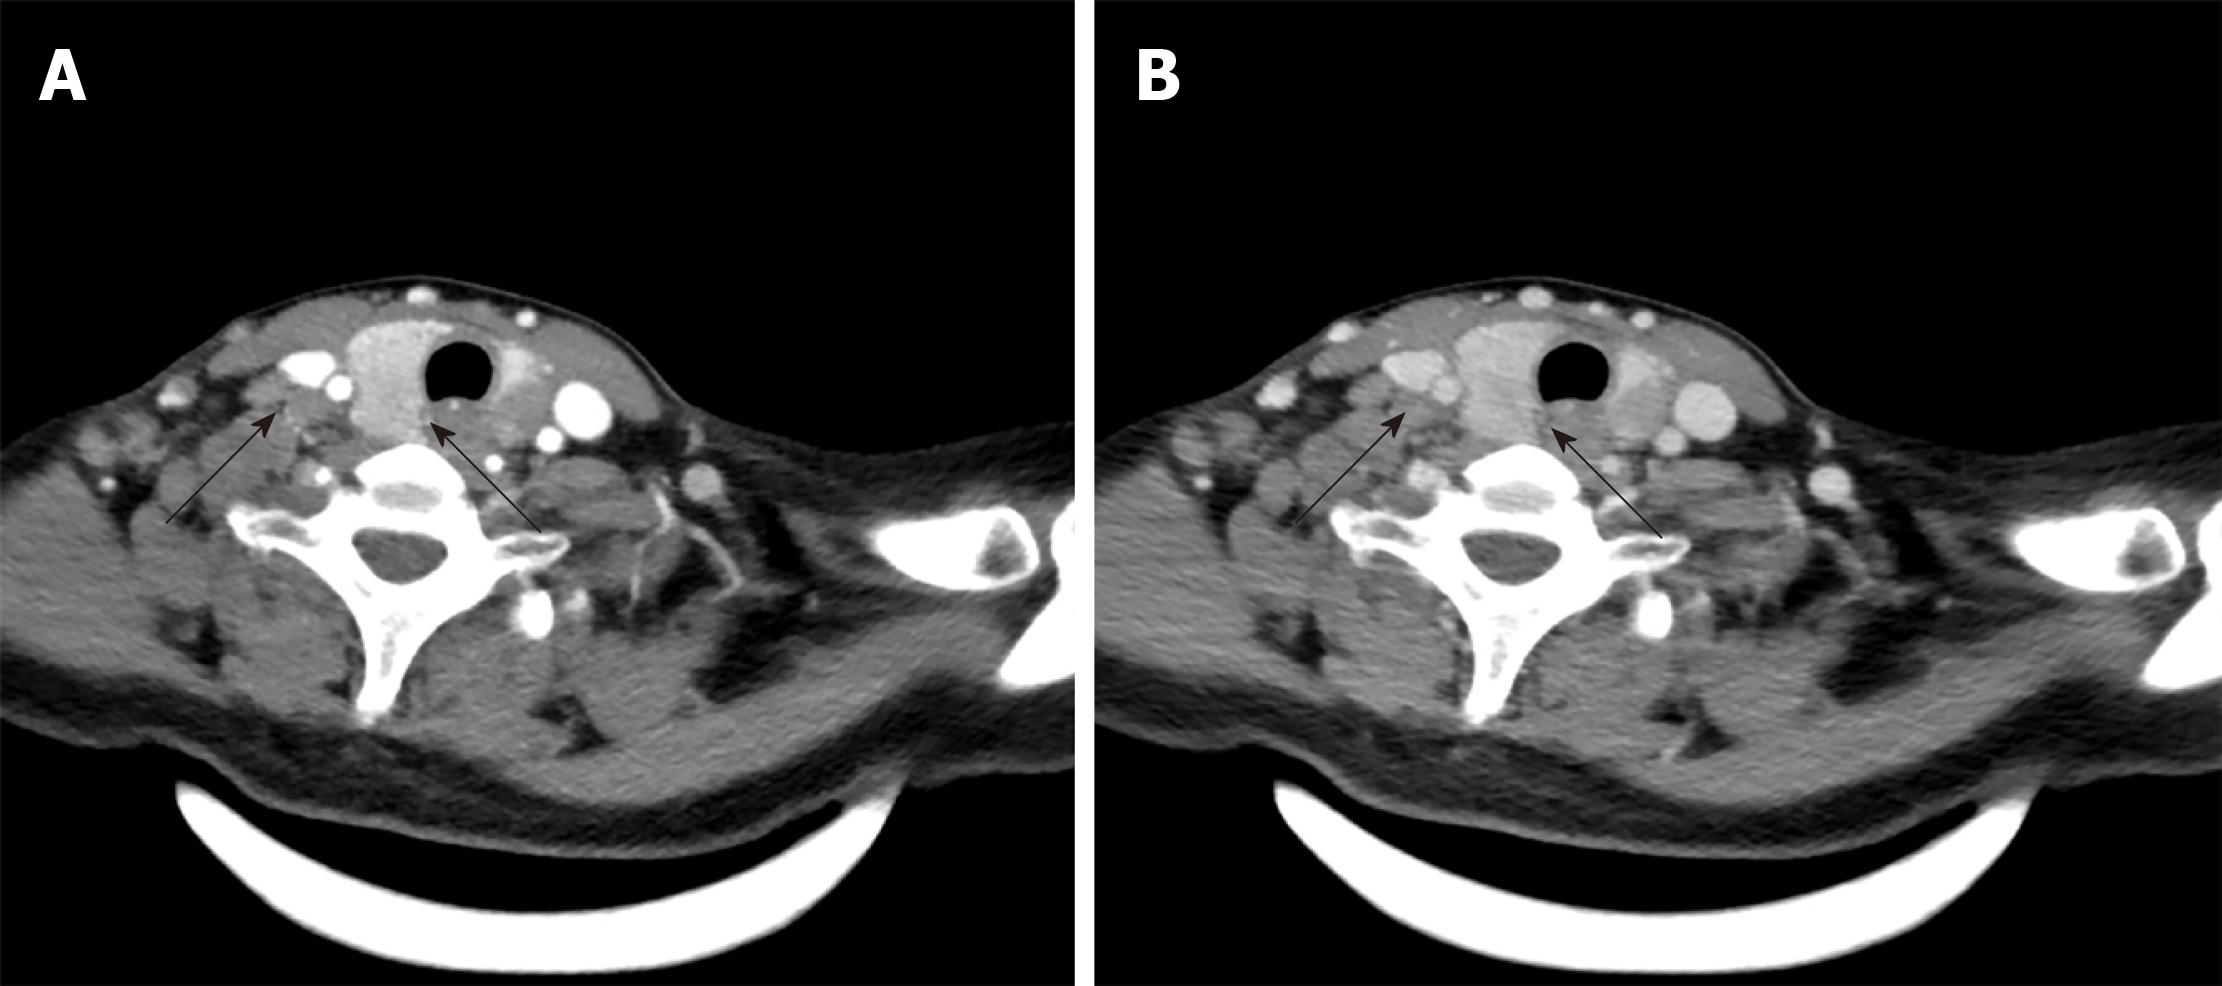
Figure 2 Computed tomography of the thyroid and lateral neck showed thyroid nodules and multiple lateral lymph nodes with homogenous enhancement.
A: Arterial phase; B: Venous phase.
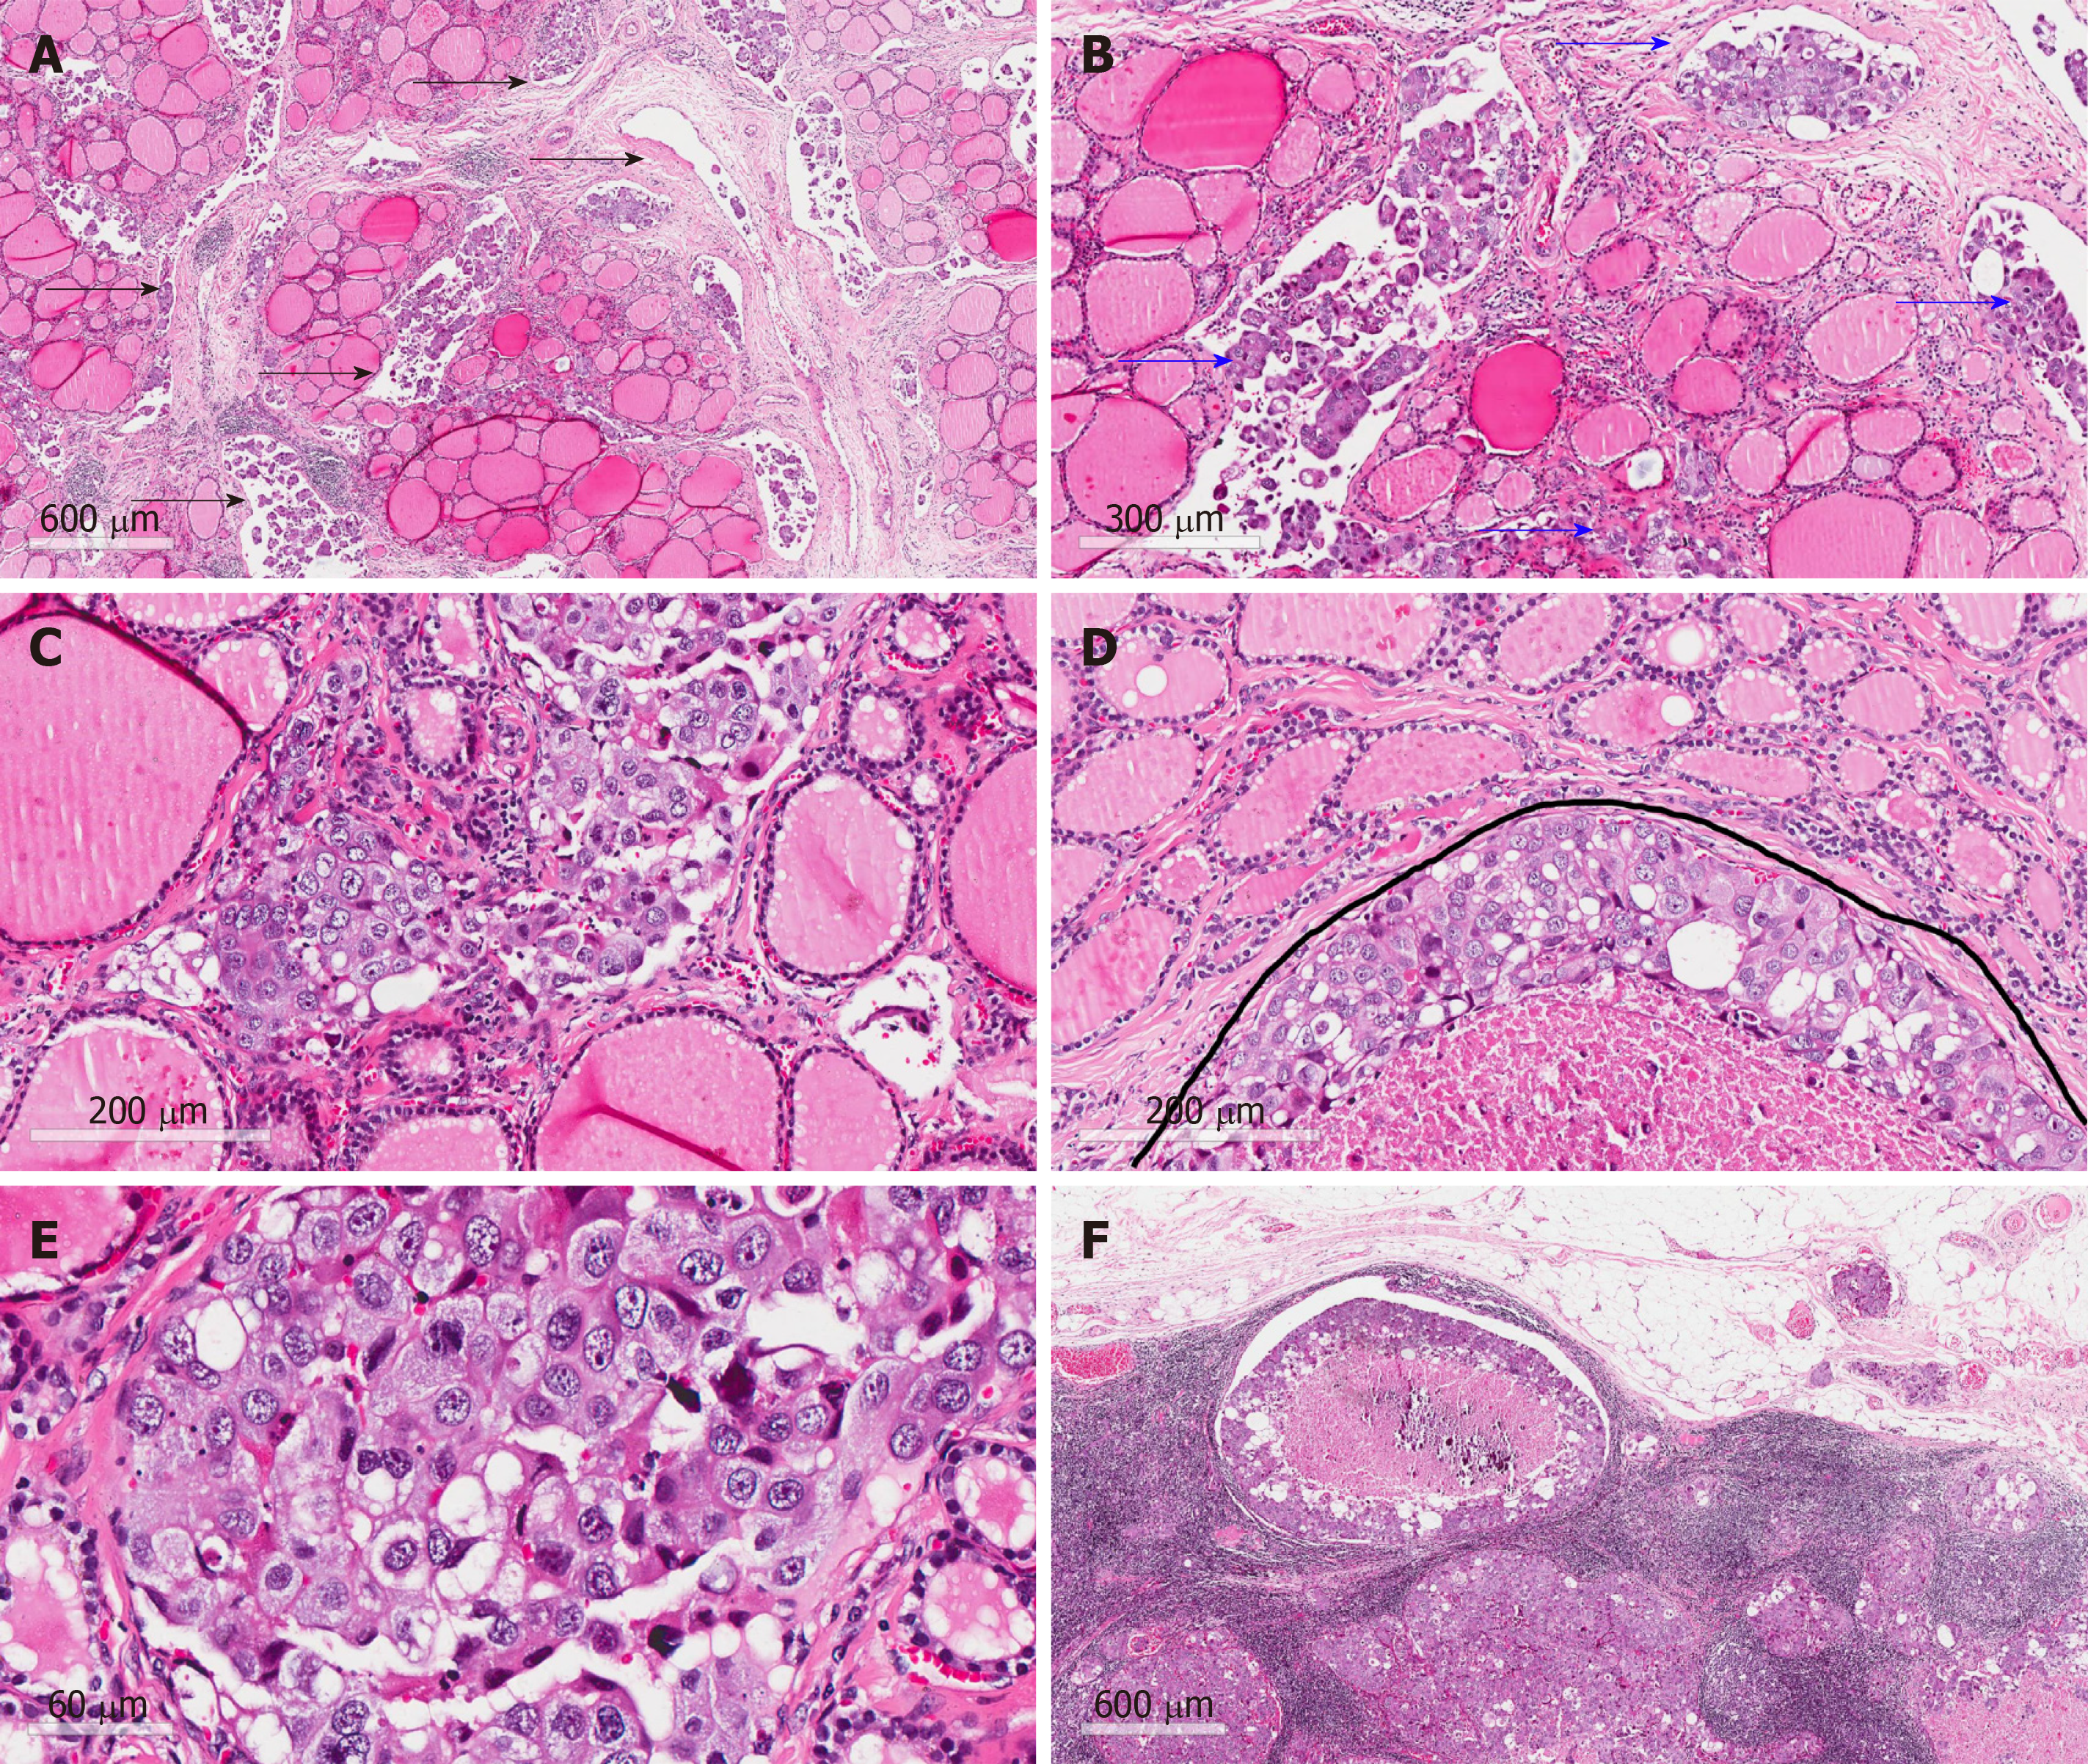
Figure 3 Hematoxylin-eosin staining.
A: Malignant tumor tissue between follicles (arrows; magnification, 40 ×); B: Malignant tumor tissue in vascular space (arrows; magnification, 100 ×); C: Atypia tumor cells without nuclear features of papillary thyroid carcinoma (magnification, 200 ×); D: Infiltrating tumor cells in the mesenchyme of the thyroid (under the curve; magnification, 200 ×); E: Atypia of tumor cells without nuclear features of papillary thyroid carcinoma (magnification, 400 ×); F: Malignant tumor tissue in lymph nodes (magnification, 40 ×).
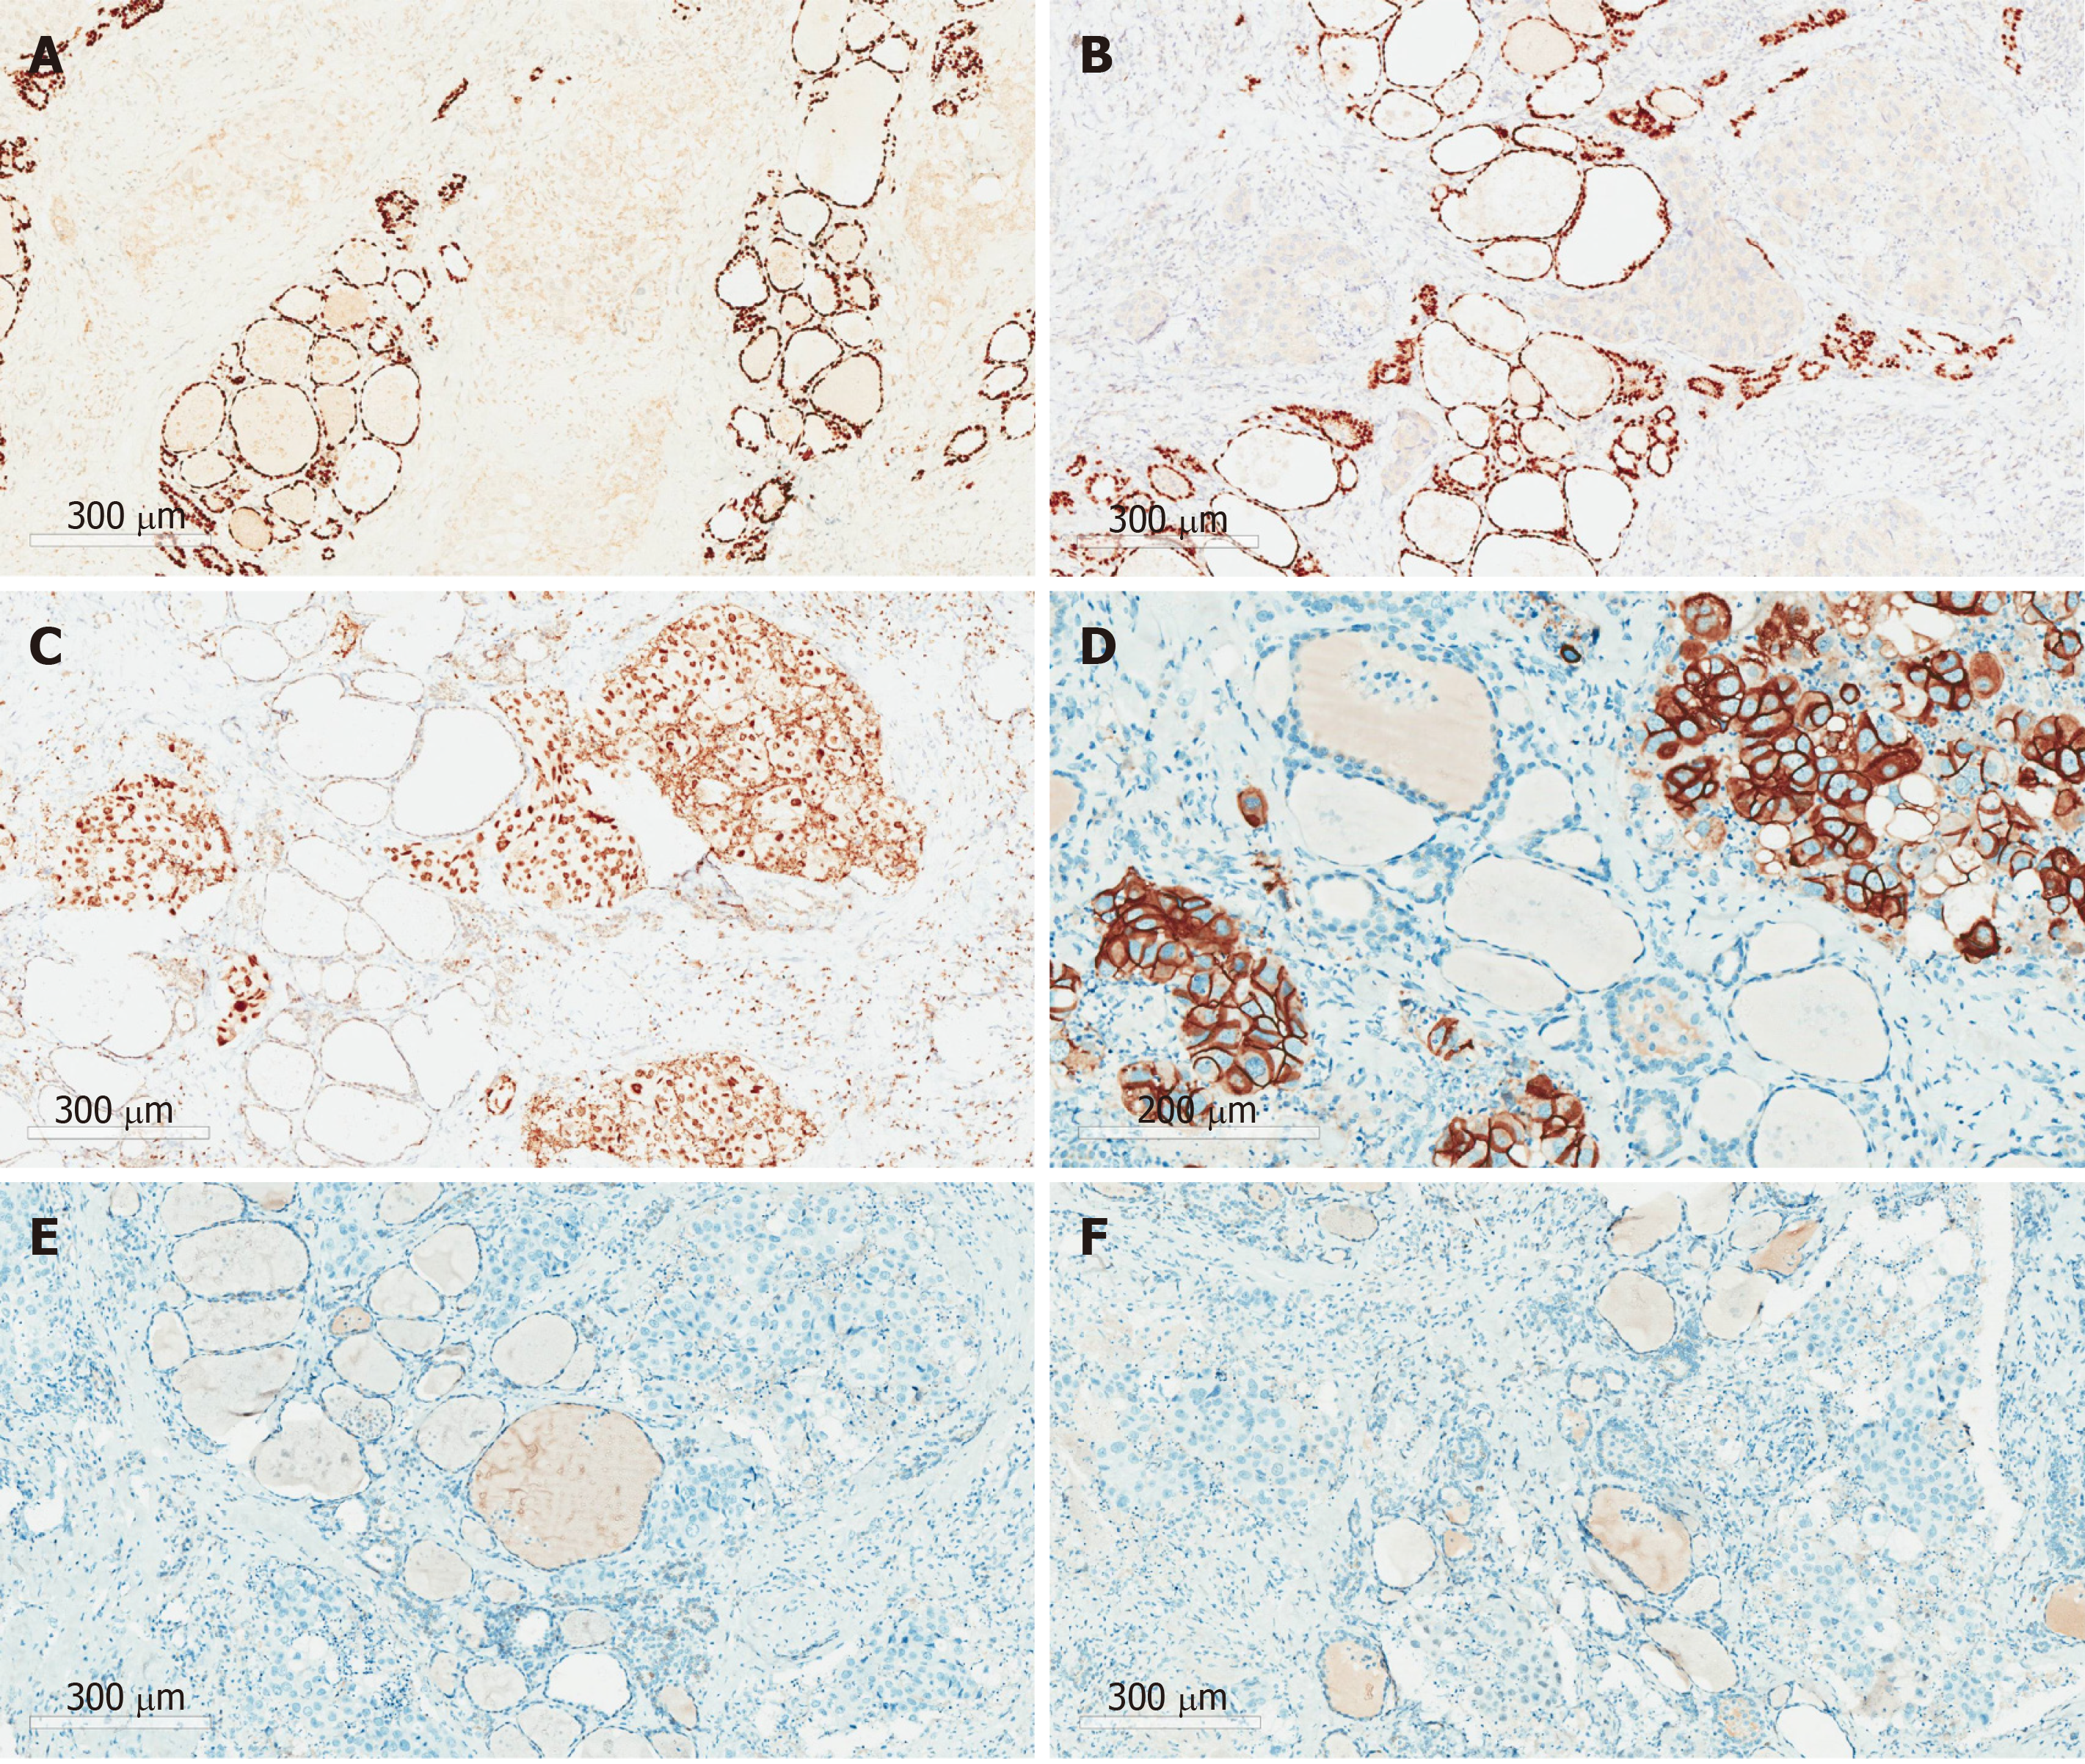
Figure 4 Immunohistochemical staining.
A: TTF-1 (-); B: PAX8 (-); C: GATA3 (+); D: HER-2 (3+); E: ER (-); F: PR (-). (Magnification, 200 × for D and 100 × for the rest).
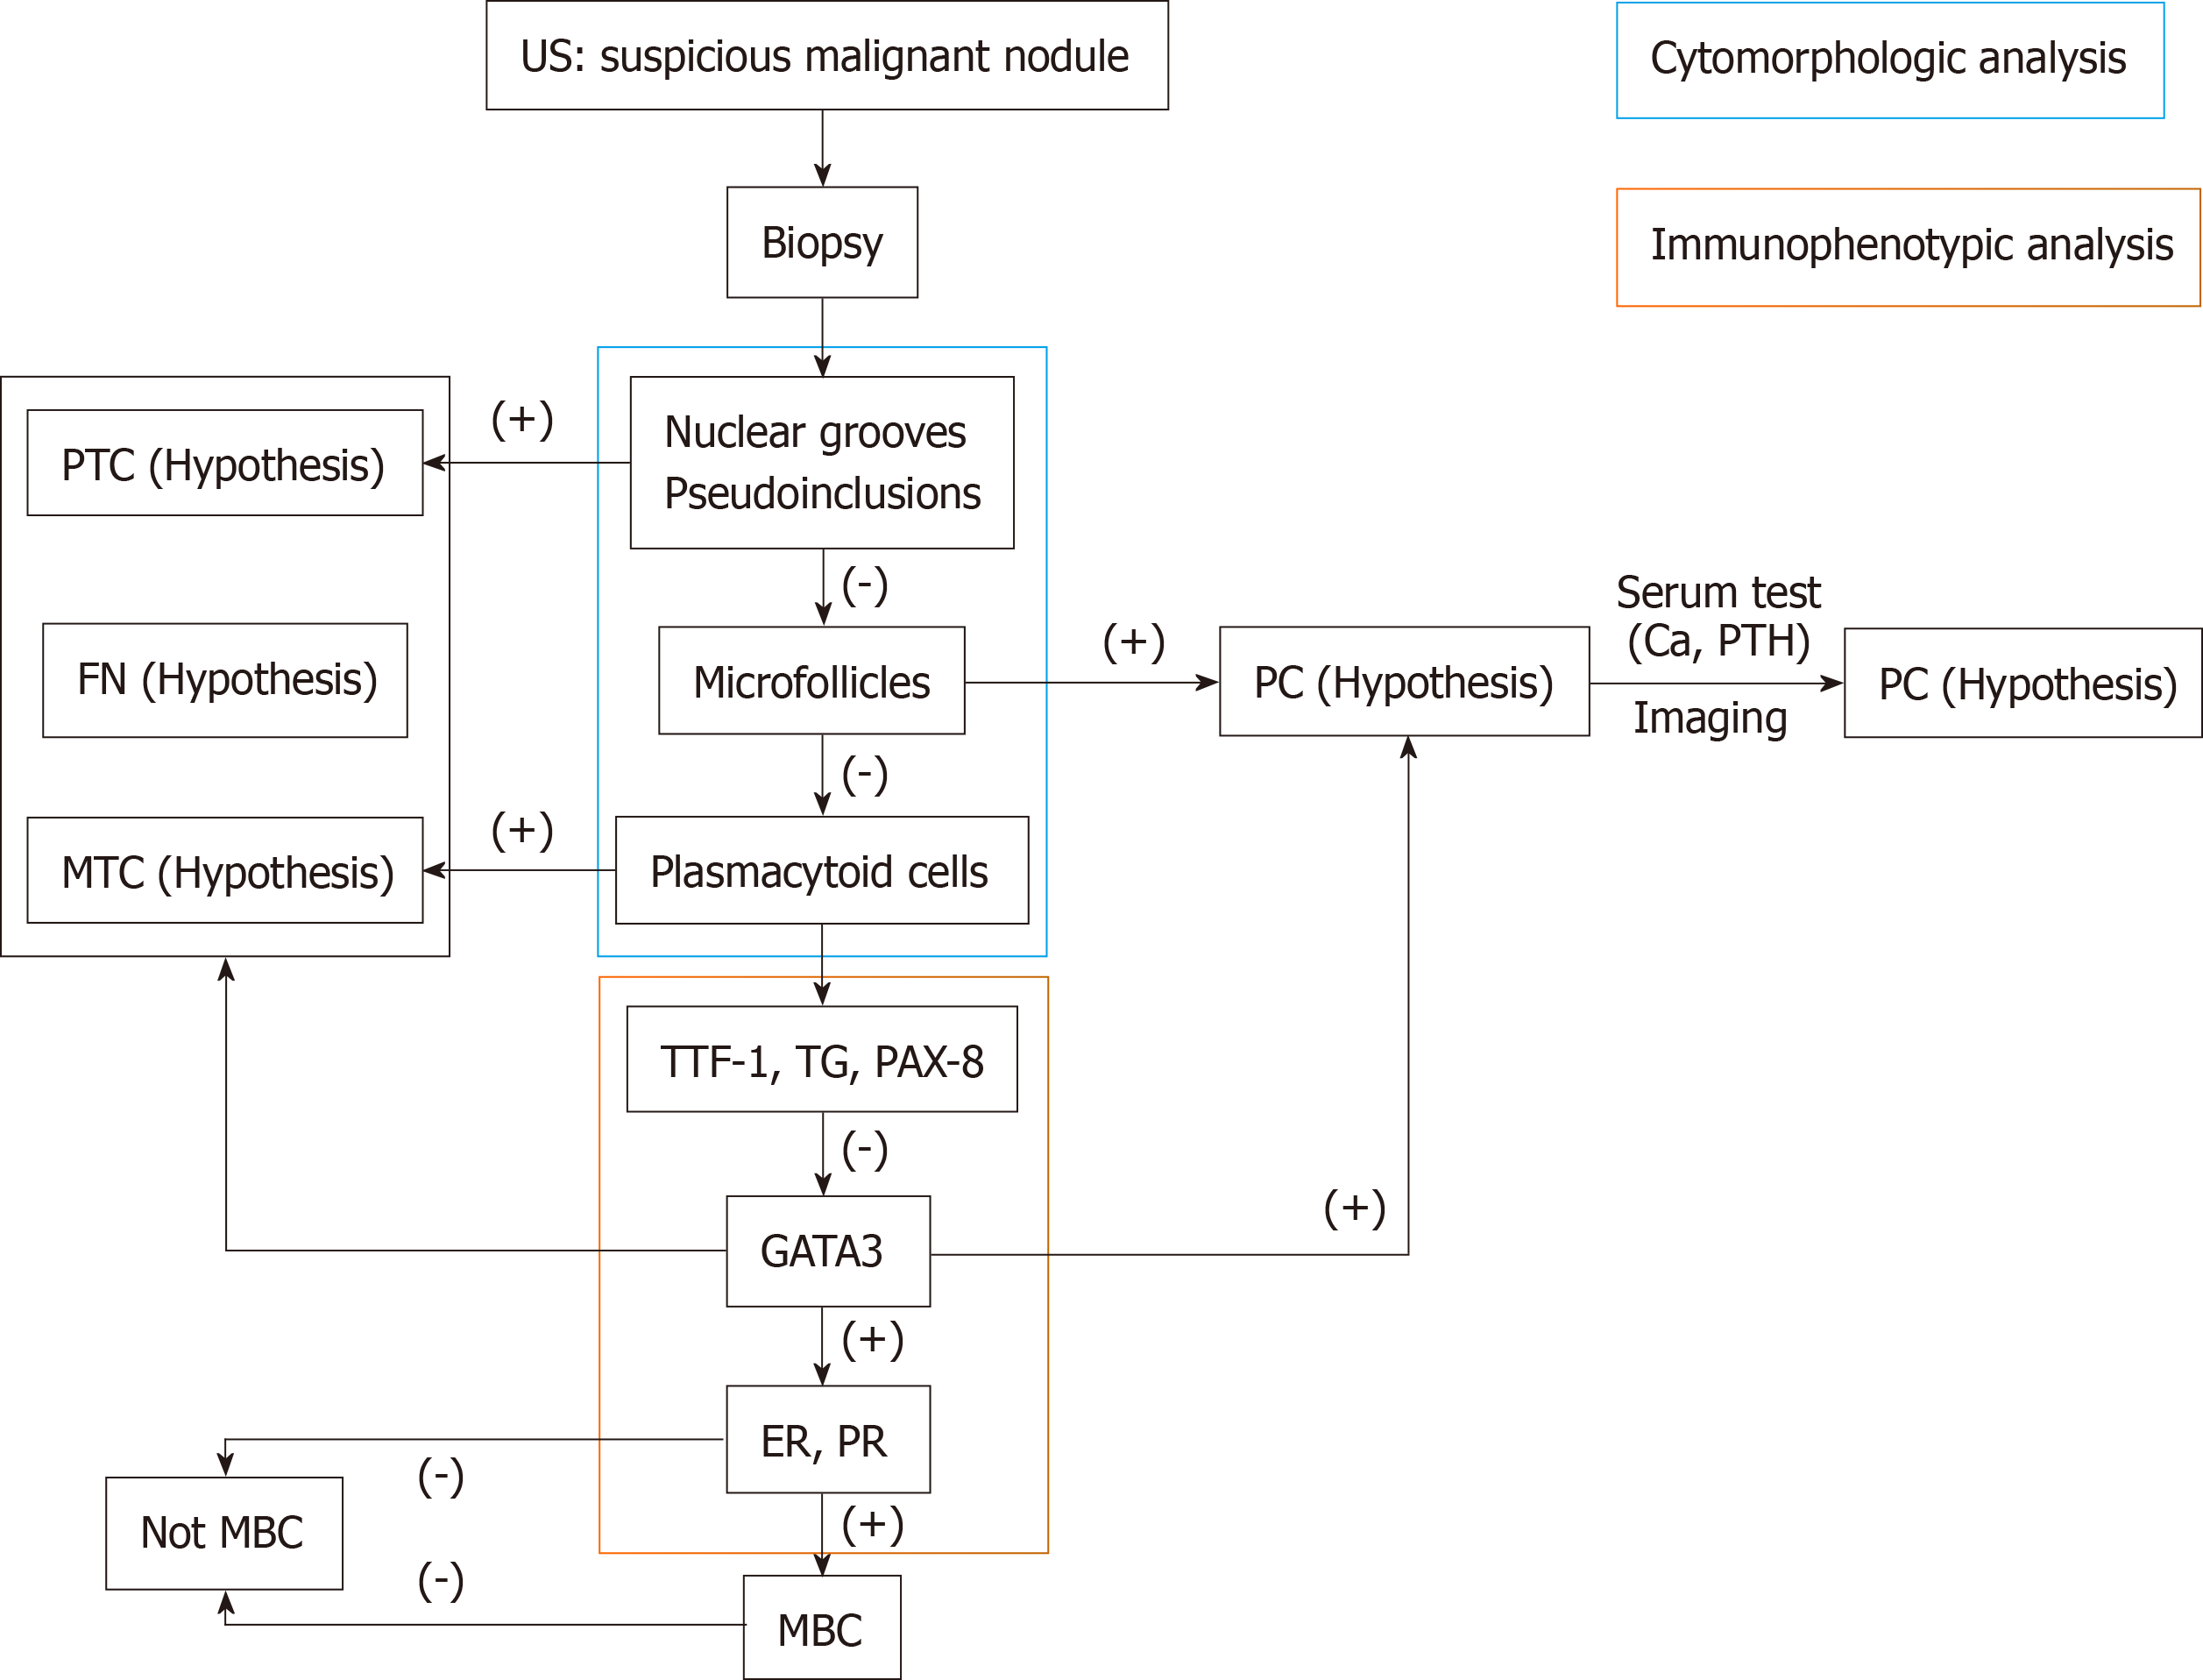
Figure 5 Diagnostic algorithm for thyroid cancer patients with a history of breast cancer.
US: Ultrasonography; PTC: Papillary thyroid carcinoma; FN: Follicular neoplasm; MTC: Medullary thyroid carcinoma; PC: Parathyroid carcinoma; MBC: Metastatic breast cancer.
- Citation: Zhang YY, Xue S, Wang ZM, Jin MS, Chen ZP, Chen G, Zhang Q. Thyroid metastasis from breast cancer presenting with enlarged lateral cervical lymph nodes: A case report. World J Clin Cases 2020; 8(4): 838-847
- URL: https://www.wjgnet.com/2307-8960/full/v8/i4/838.htm
- DOI: https://dx.doi.org/10.12998/wjcc.v8.i4.838


