Copyright
©The Author(s) 2020.
World J Clin Cases. Feb 6, 2020; 8(3): 504-516
Published online Feb 6, 2020. doi: 10.12998/wjcc.v8.i3.504
Published online Feb 6, 2020. doi: 10.12998/wjcc.v8.i3.504
Figure 1 Mechanical properties of Zn alloy sheets.
A: 0.2% yield strength; B: Elongation.
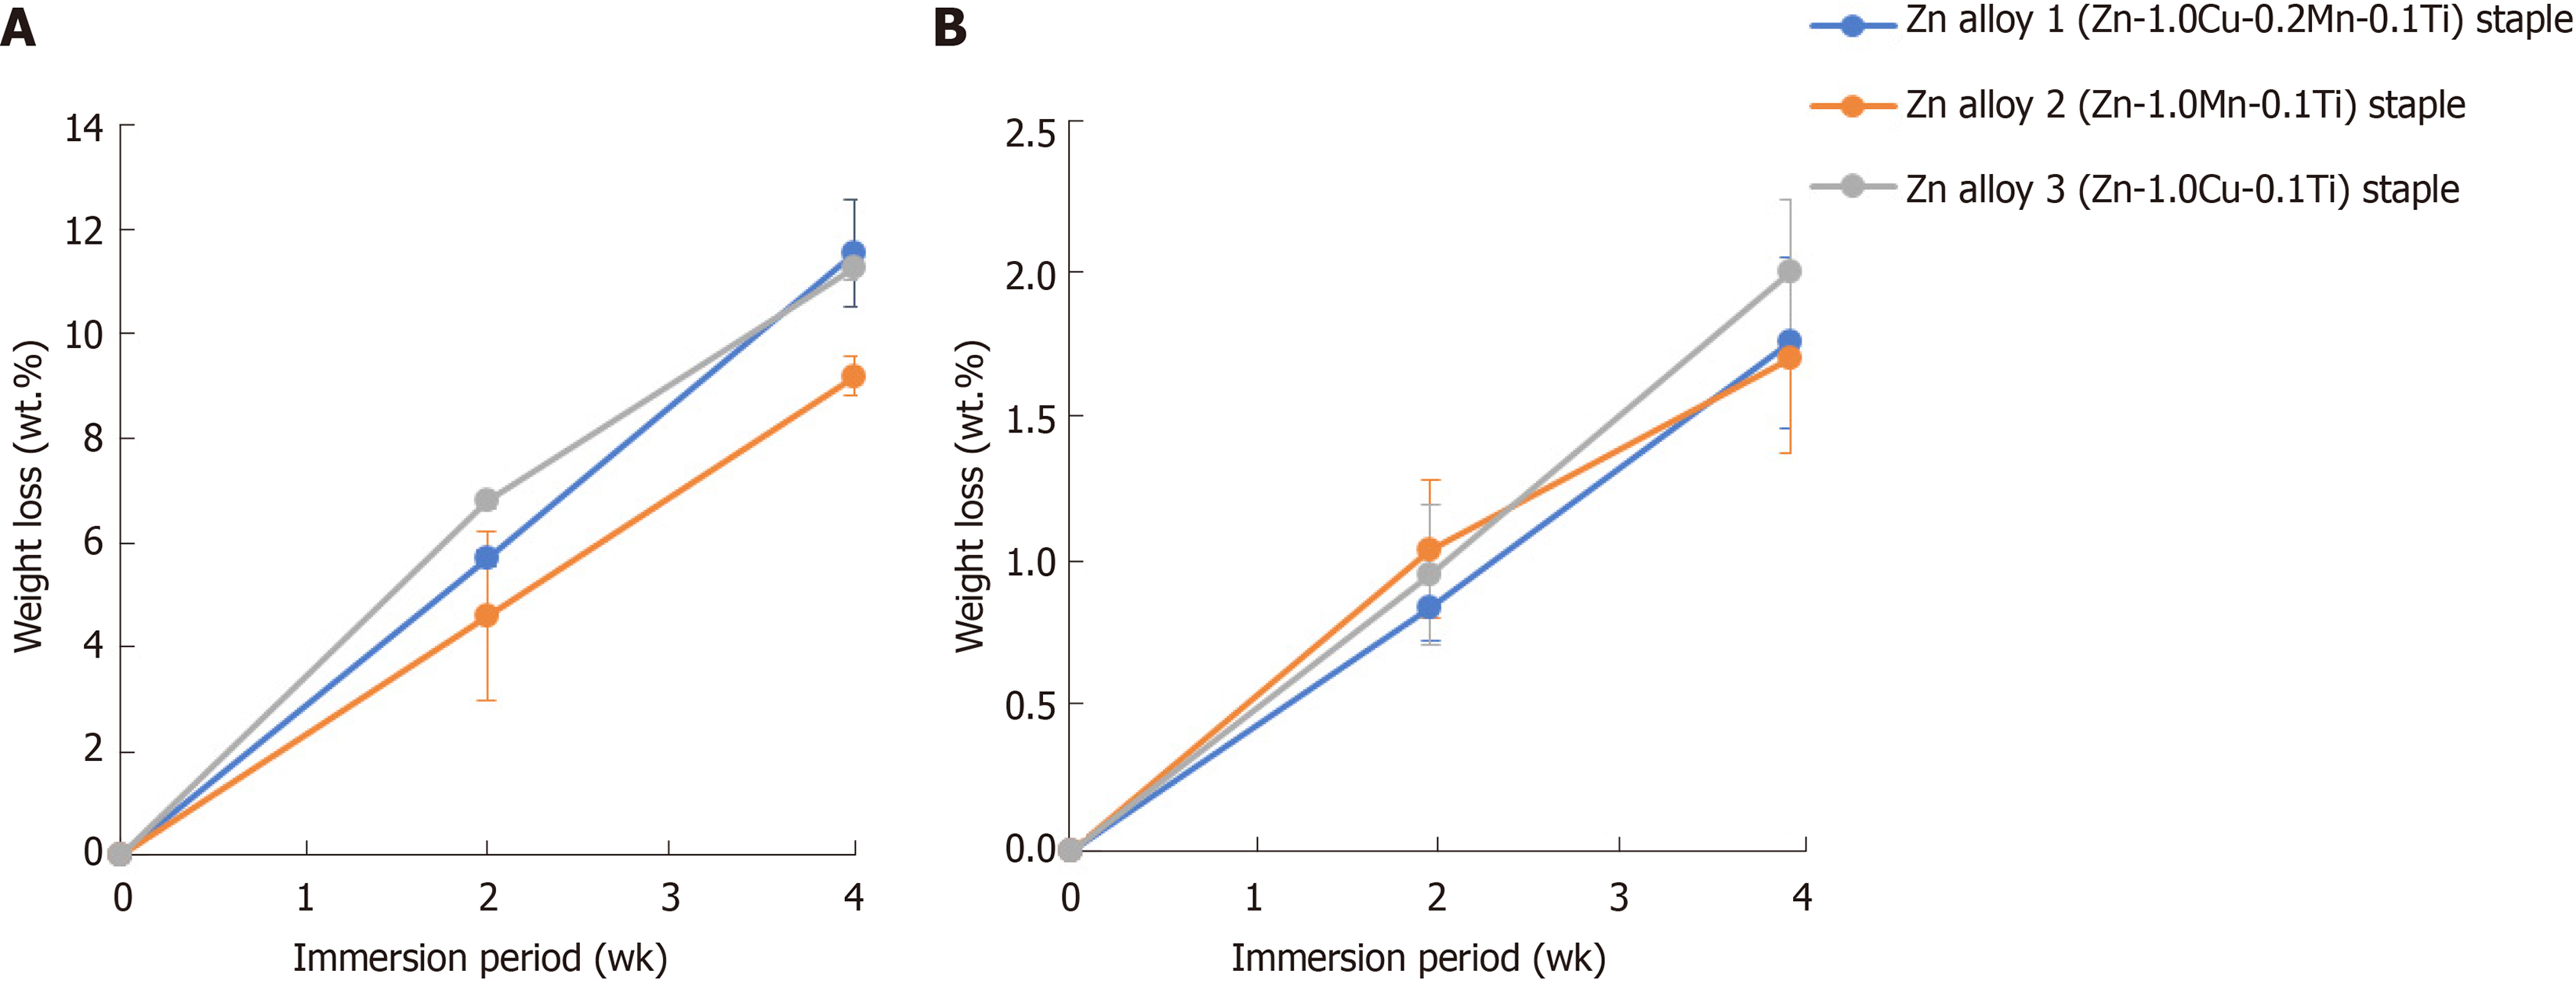
Figure 2 Weight change of Zn alloy staples after immersion in simulated body fluids.
A: Fed-state simulated intestinal fluid; B: Hank's balanced salt solution (+) without phenol red.
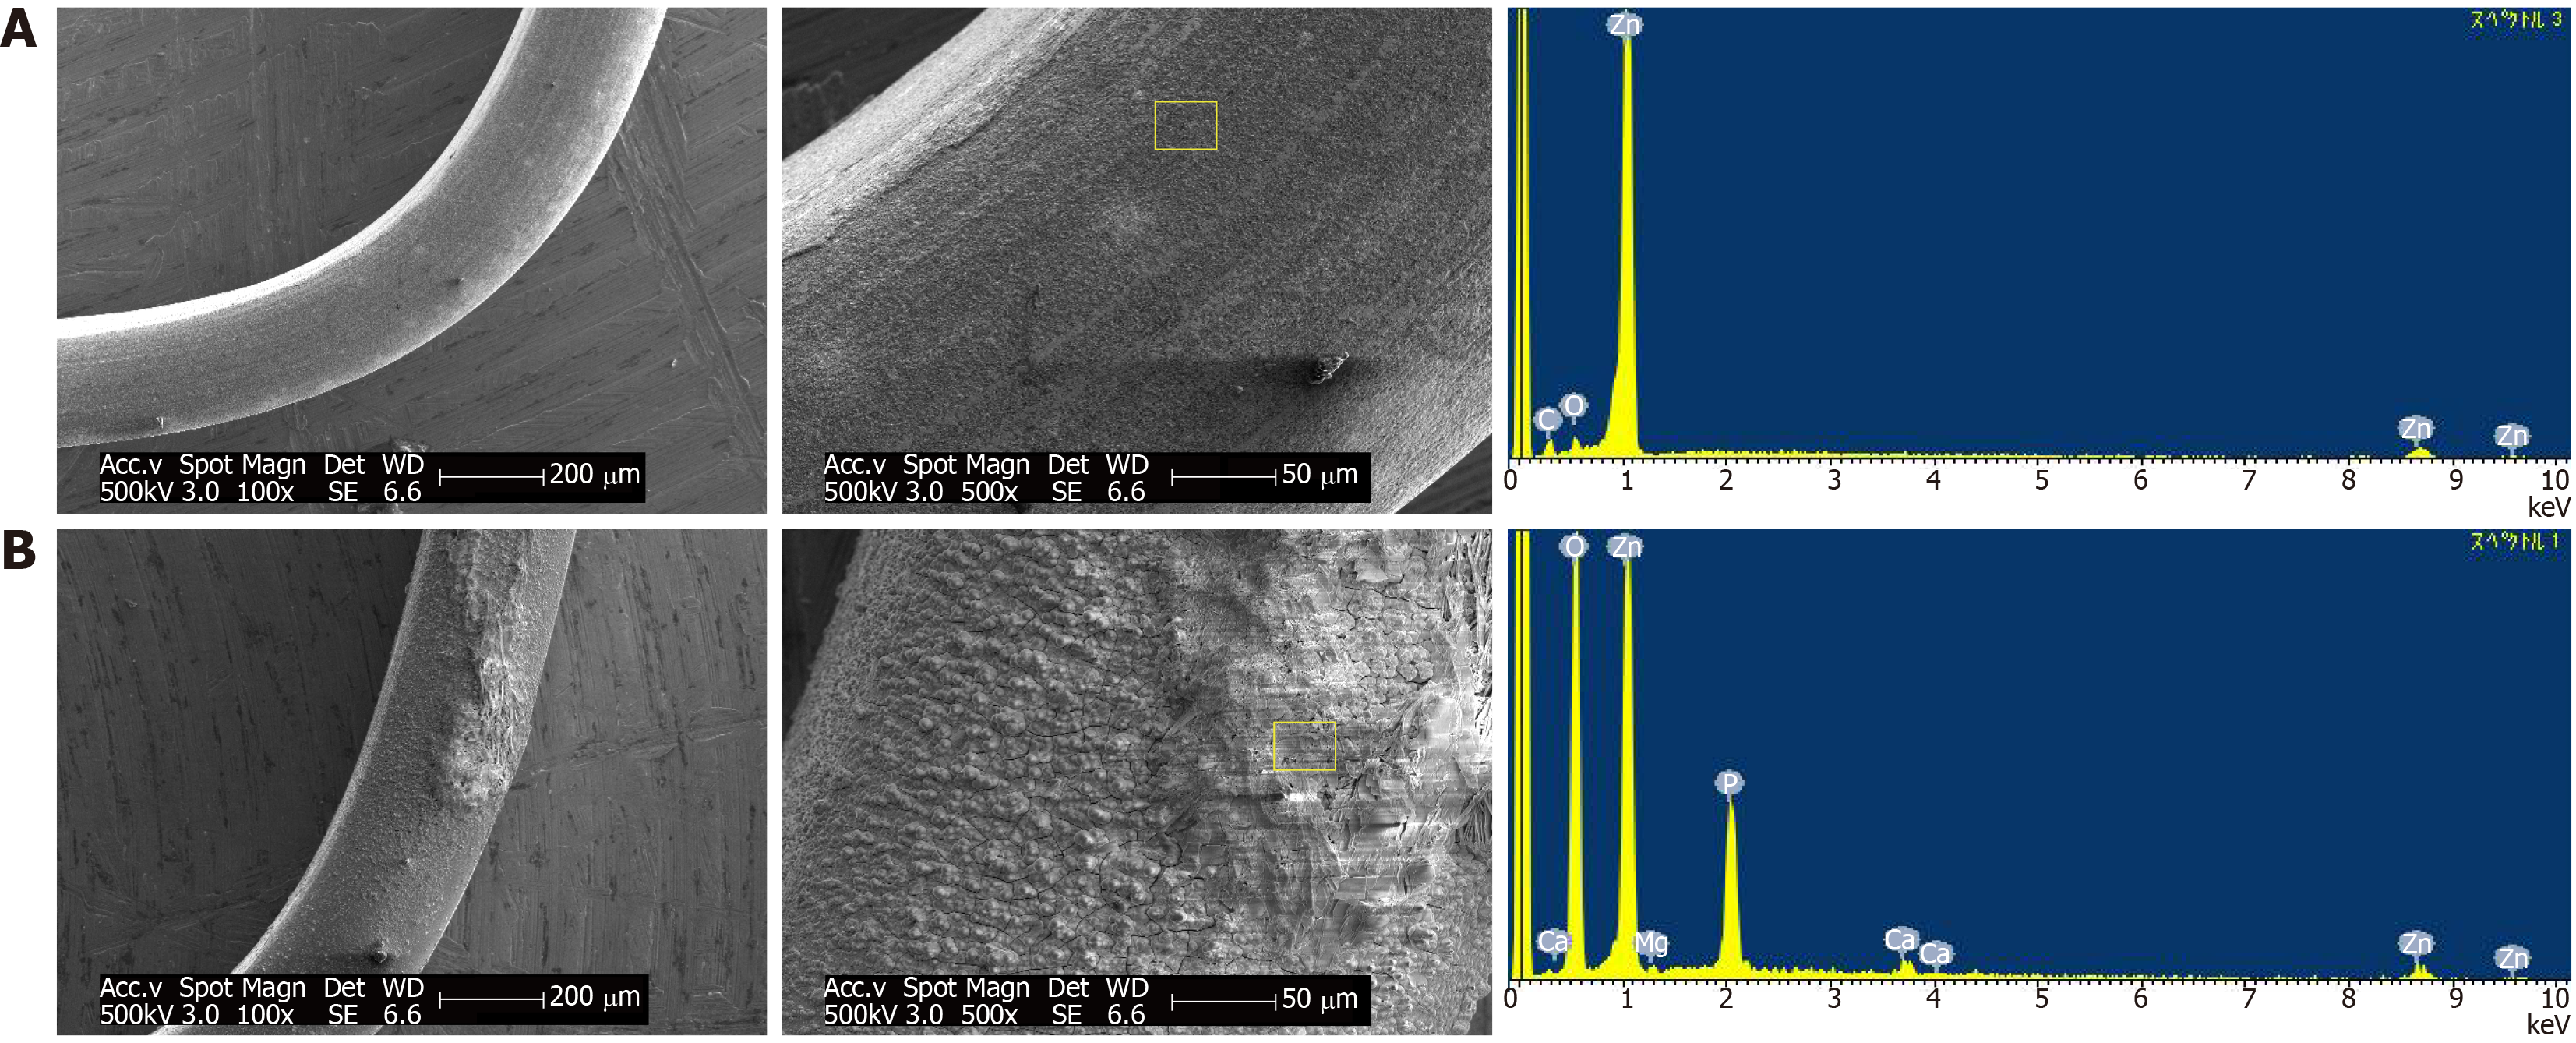
Figure 3 Representative scanning electron microscopy images and X-ray diffraction patterns of Zn–1.
0Cu–0.2Mn–0.1Ti (Zn alloy 1) staples after 4 wk of immersion in simulated body fluids. A: Fed-state simulated intestinal fluid; B: Hank's balanced salt solution (+) without phenol red.
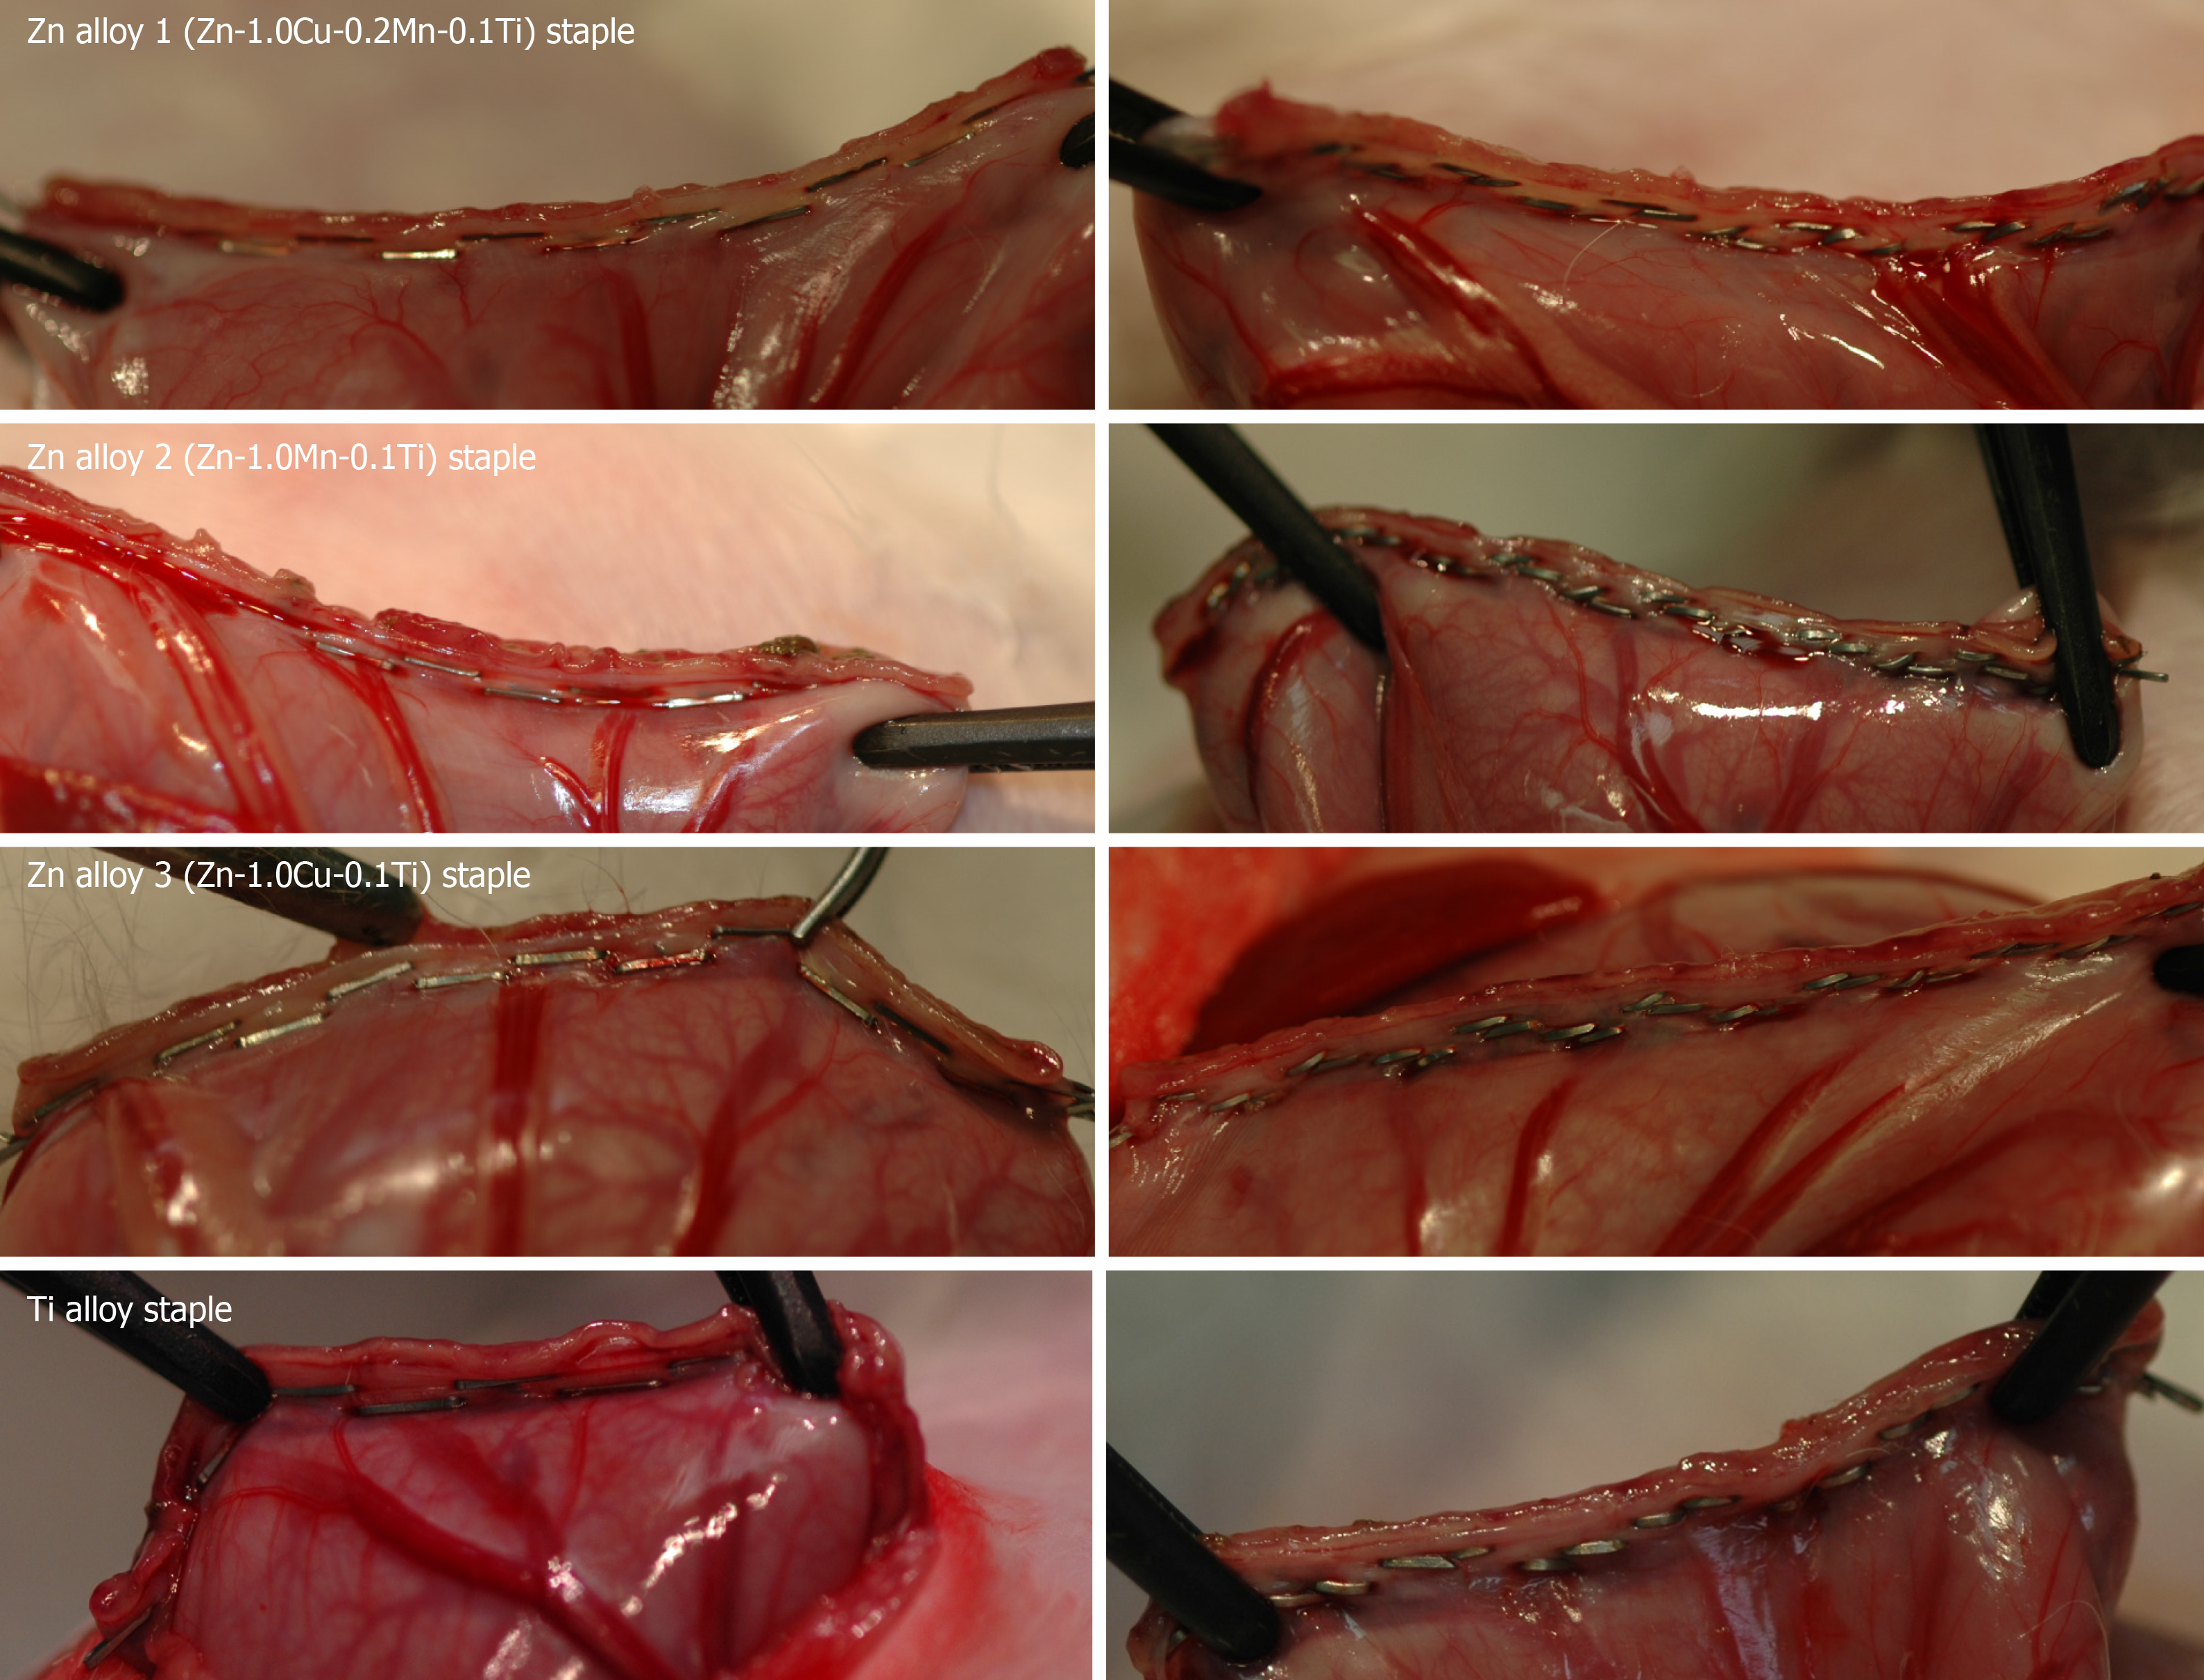
Figure 4 Staple line using Zn alloy and Ti alloy staples.
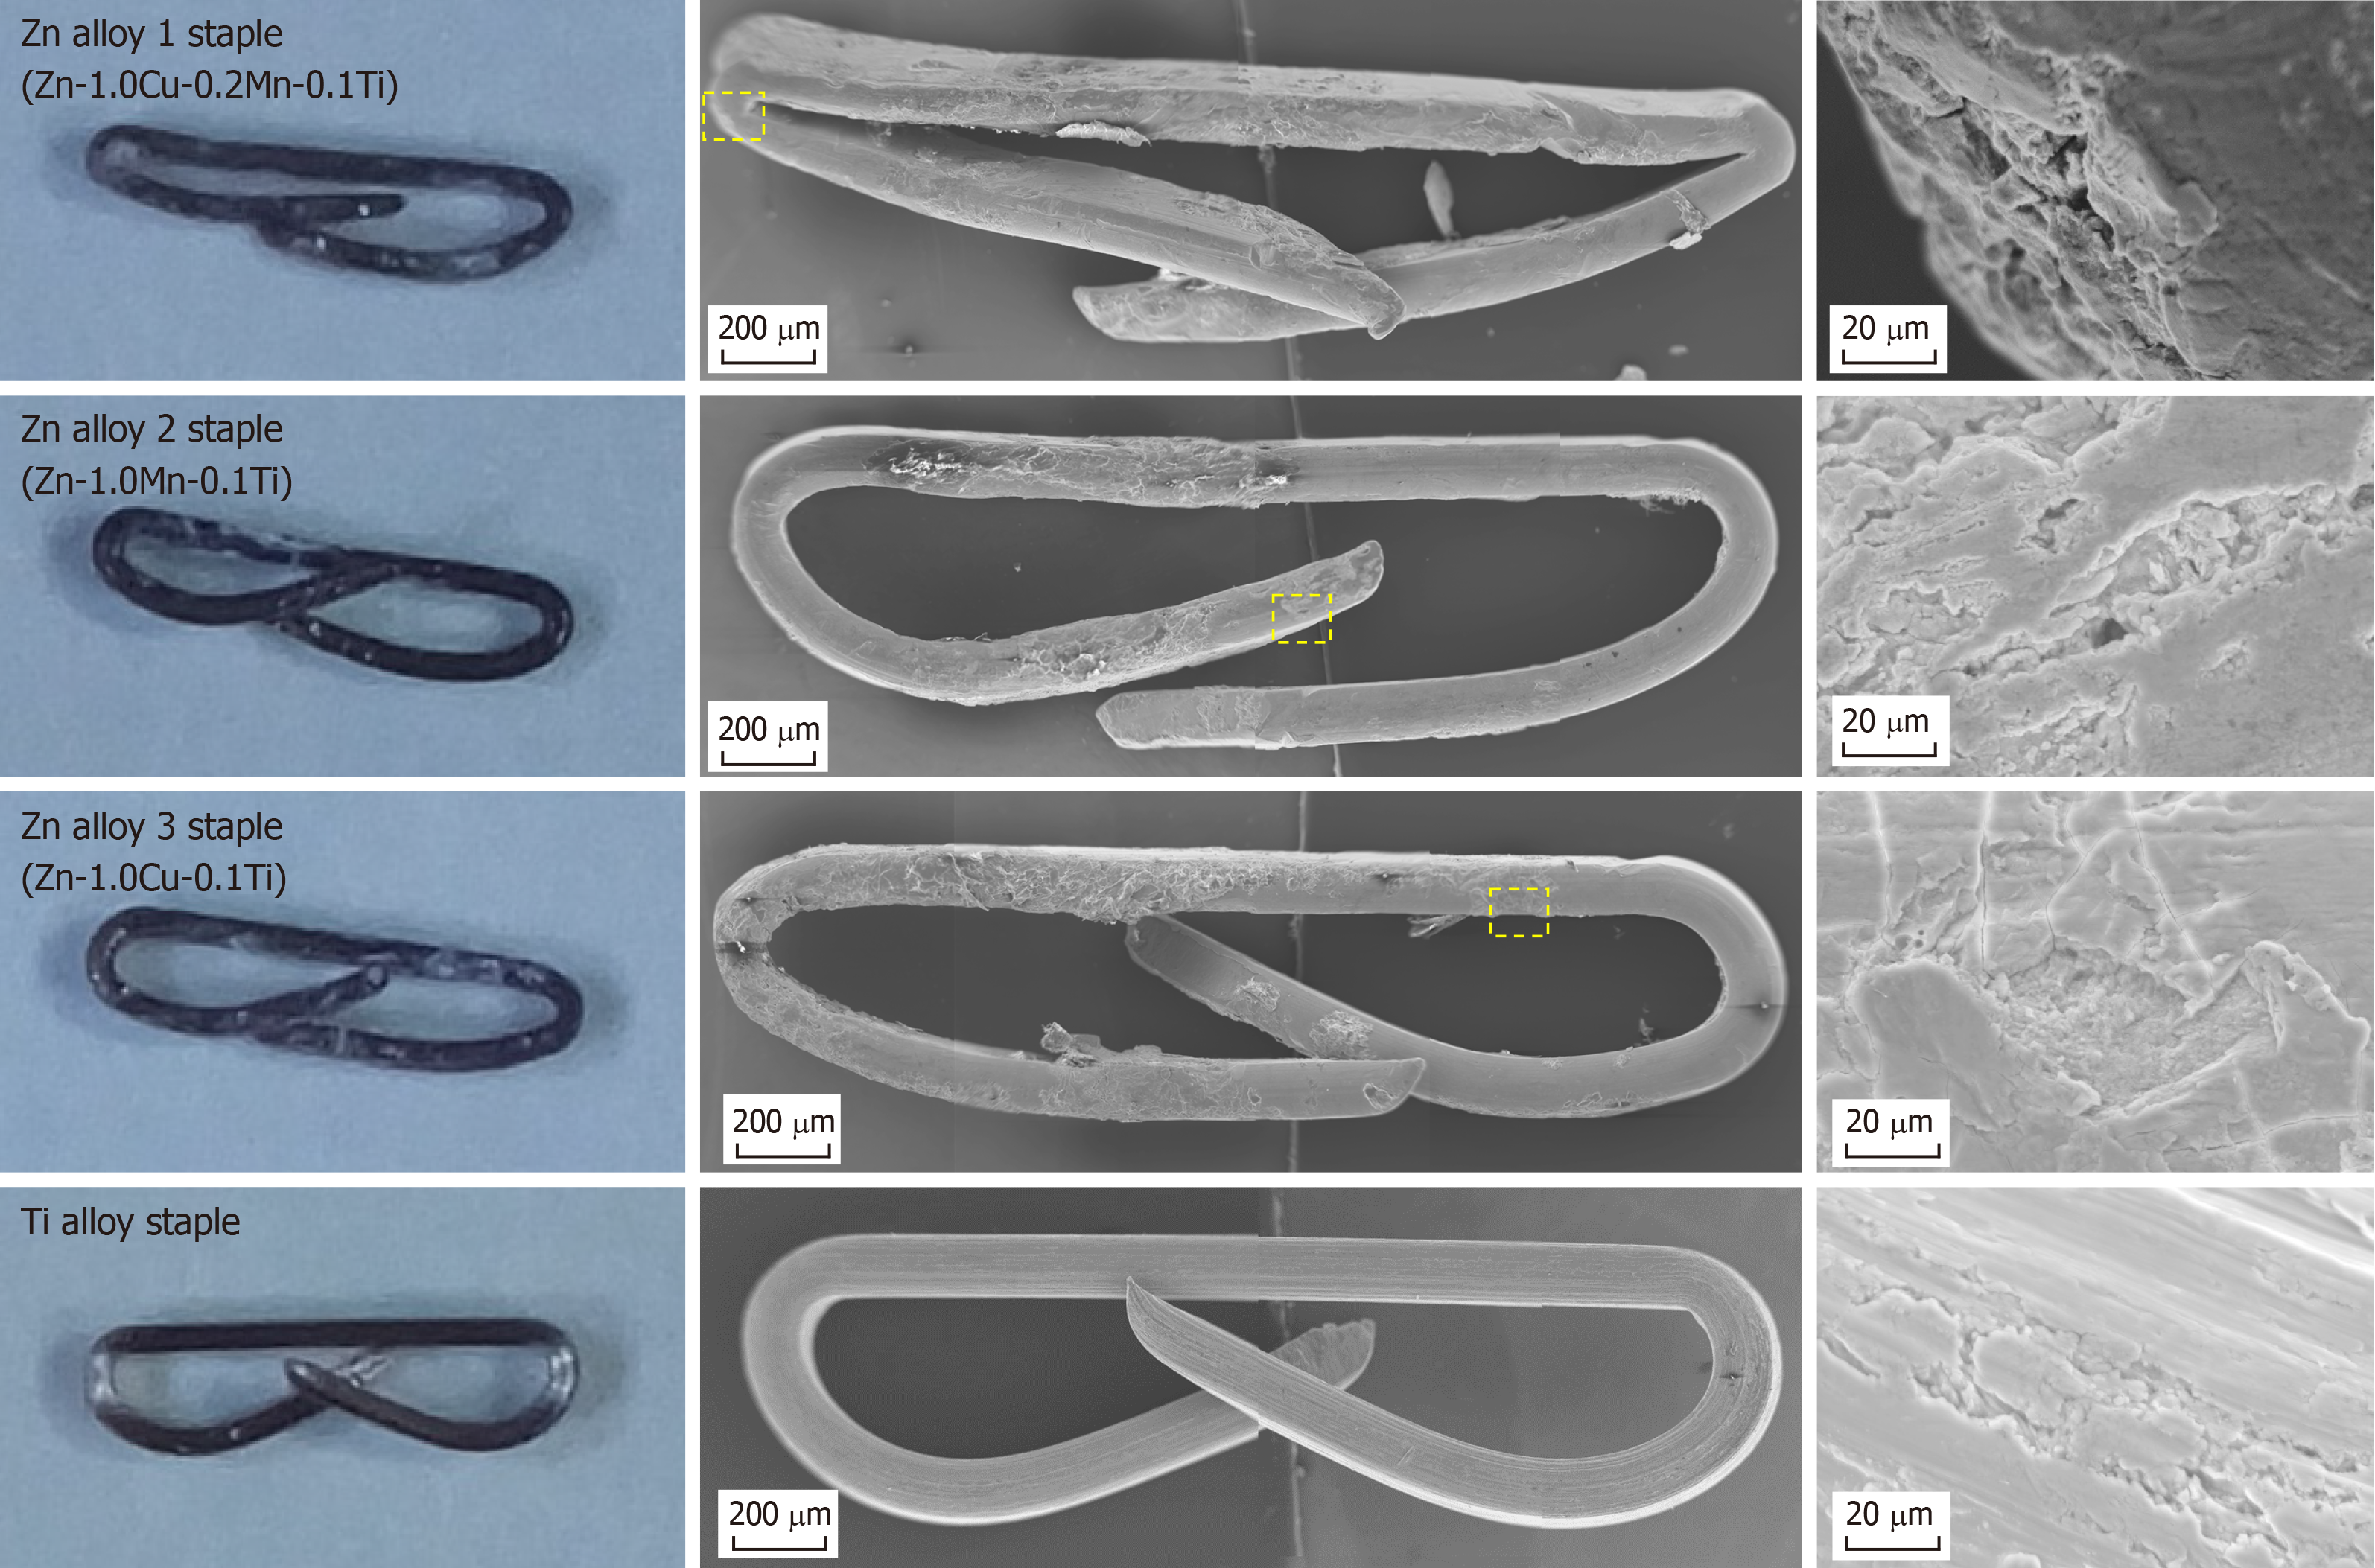
Figure 5 Macroscopic appearance and representative scanning electron microscopy images of staples after 12 wks’ implantation.
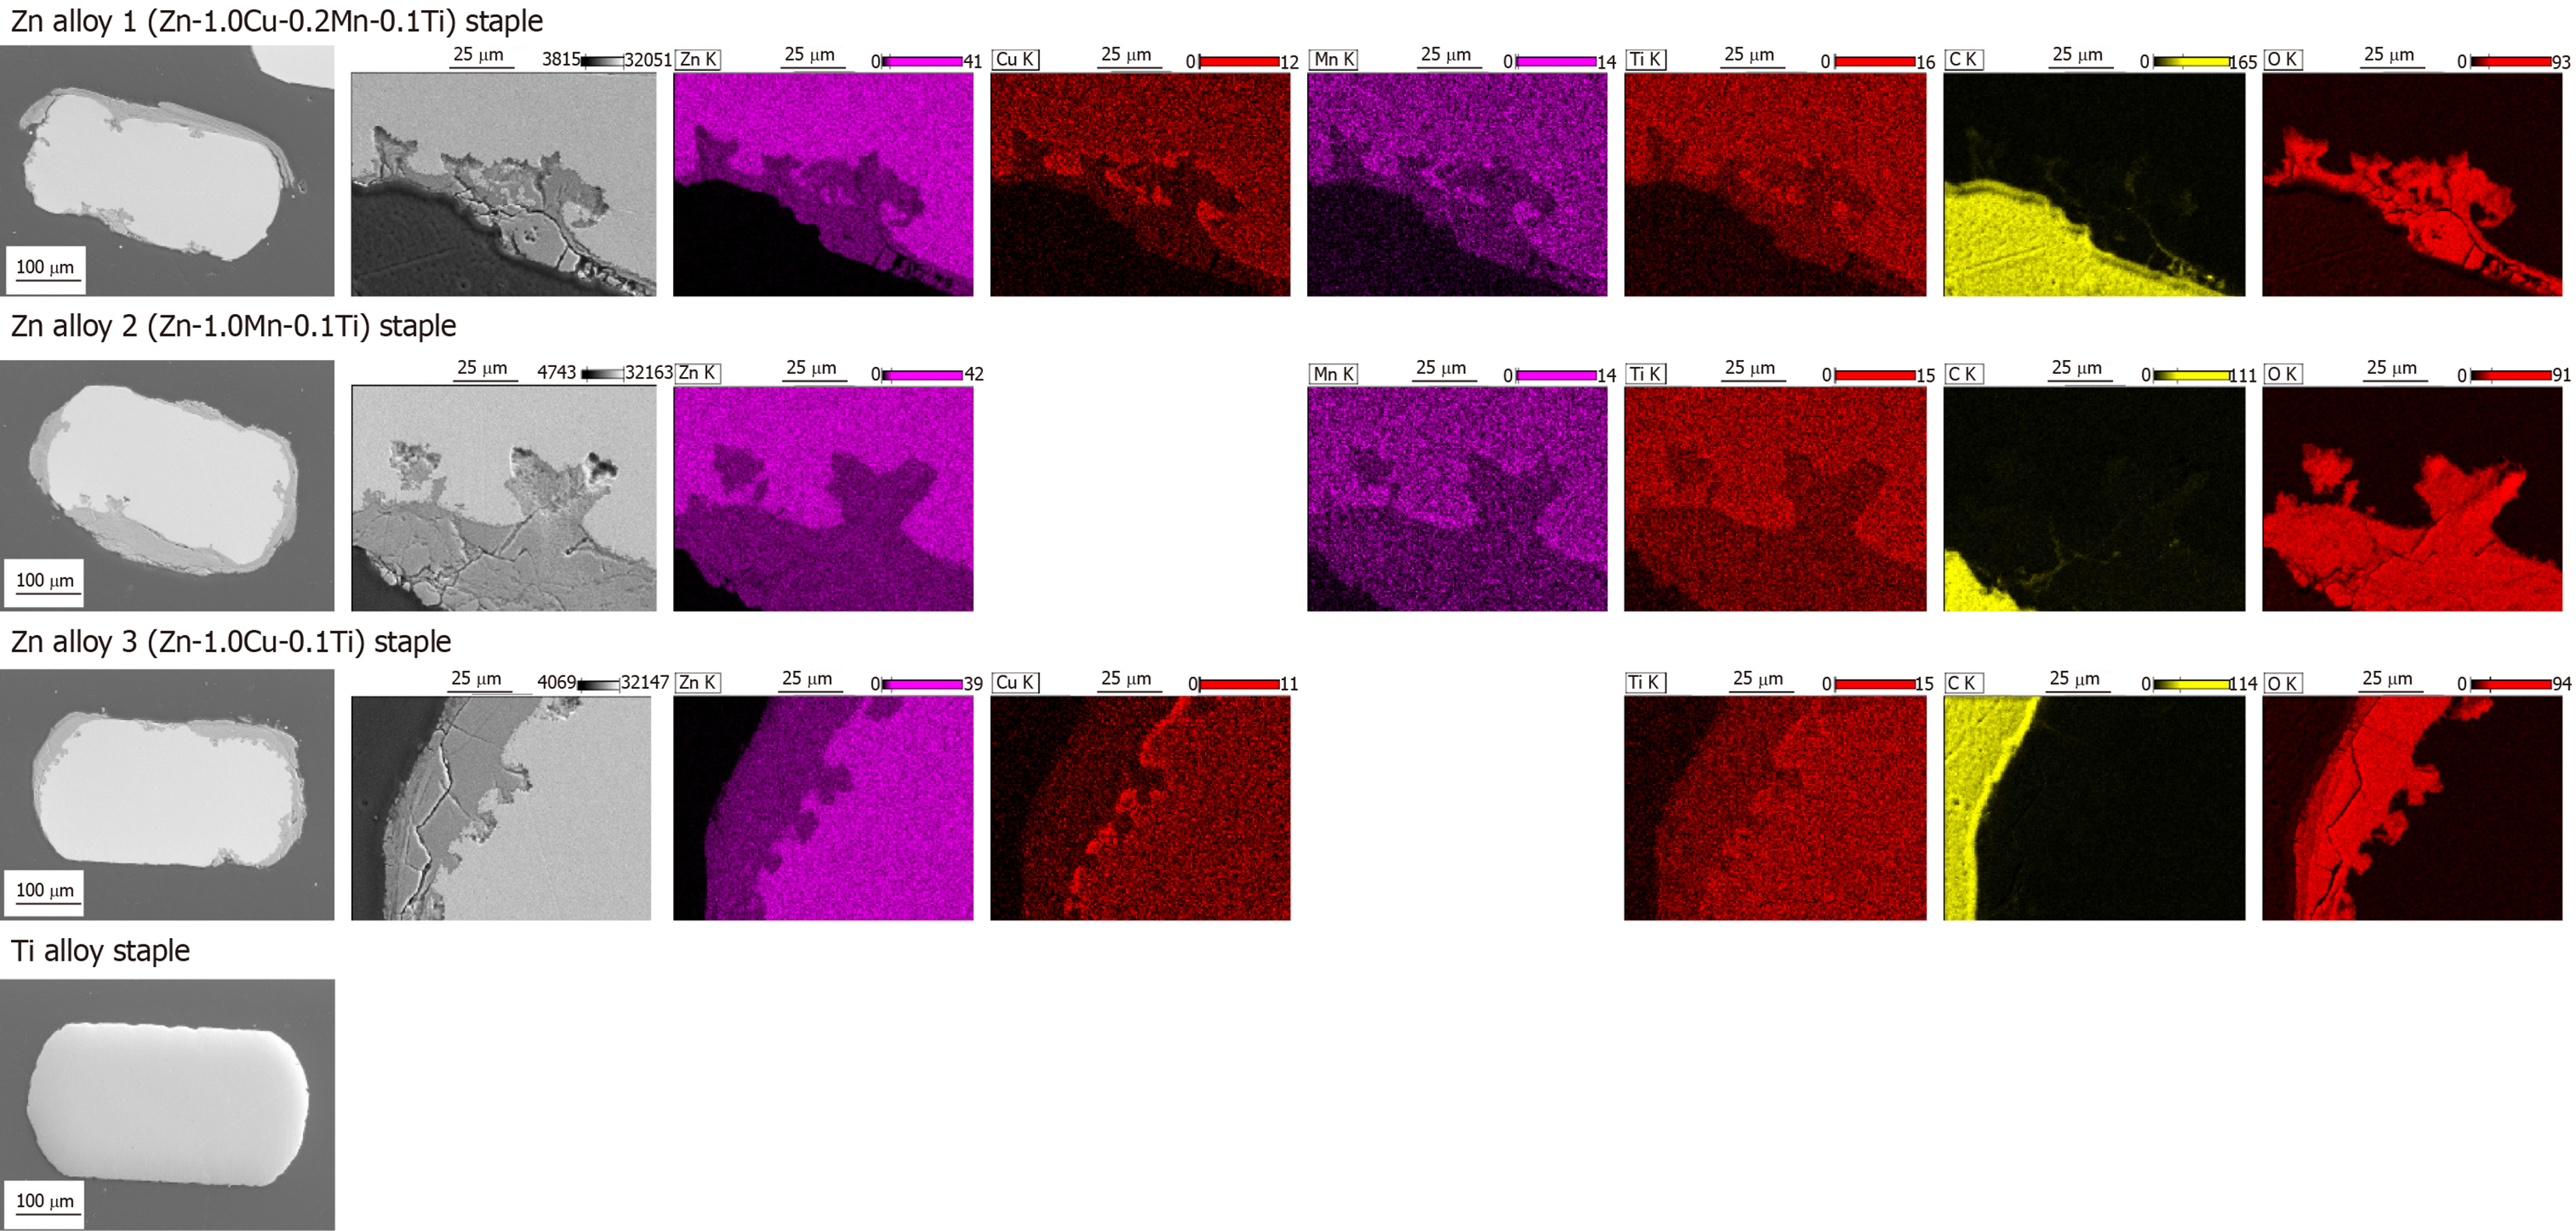
Figure 6 Representative scanning electron microscopy images and energy dispersive spectrometry elemental maps of staple cross-sections after 12 wks’ implantation.
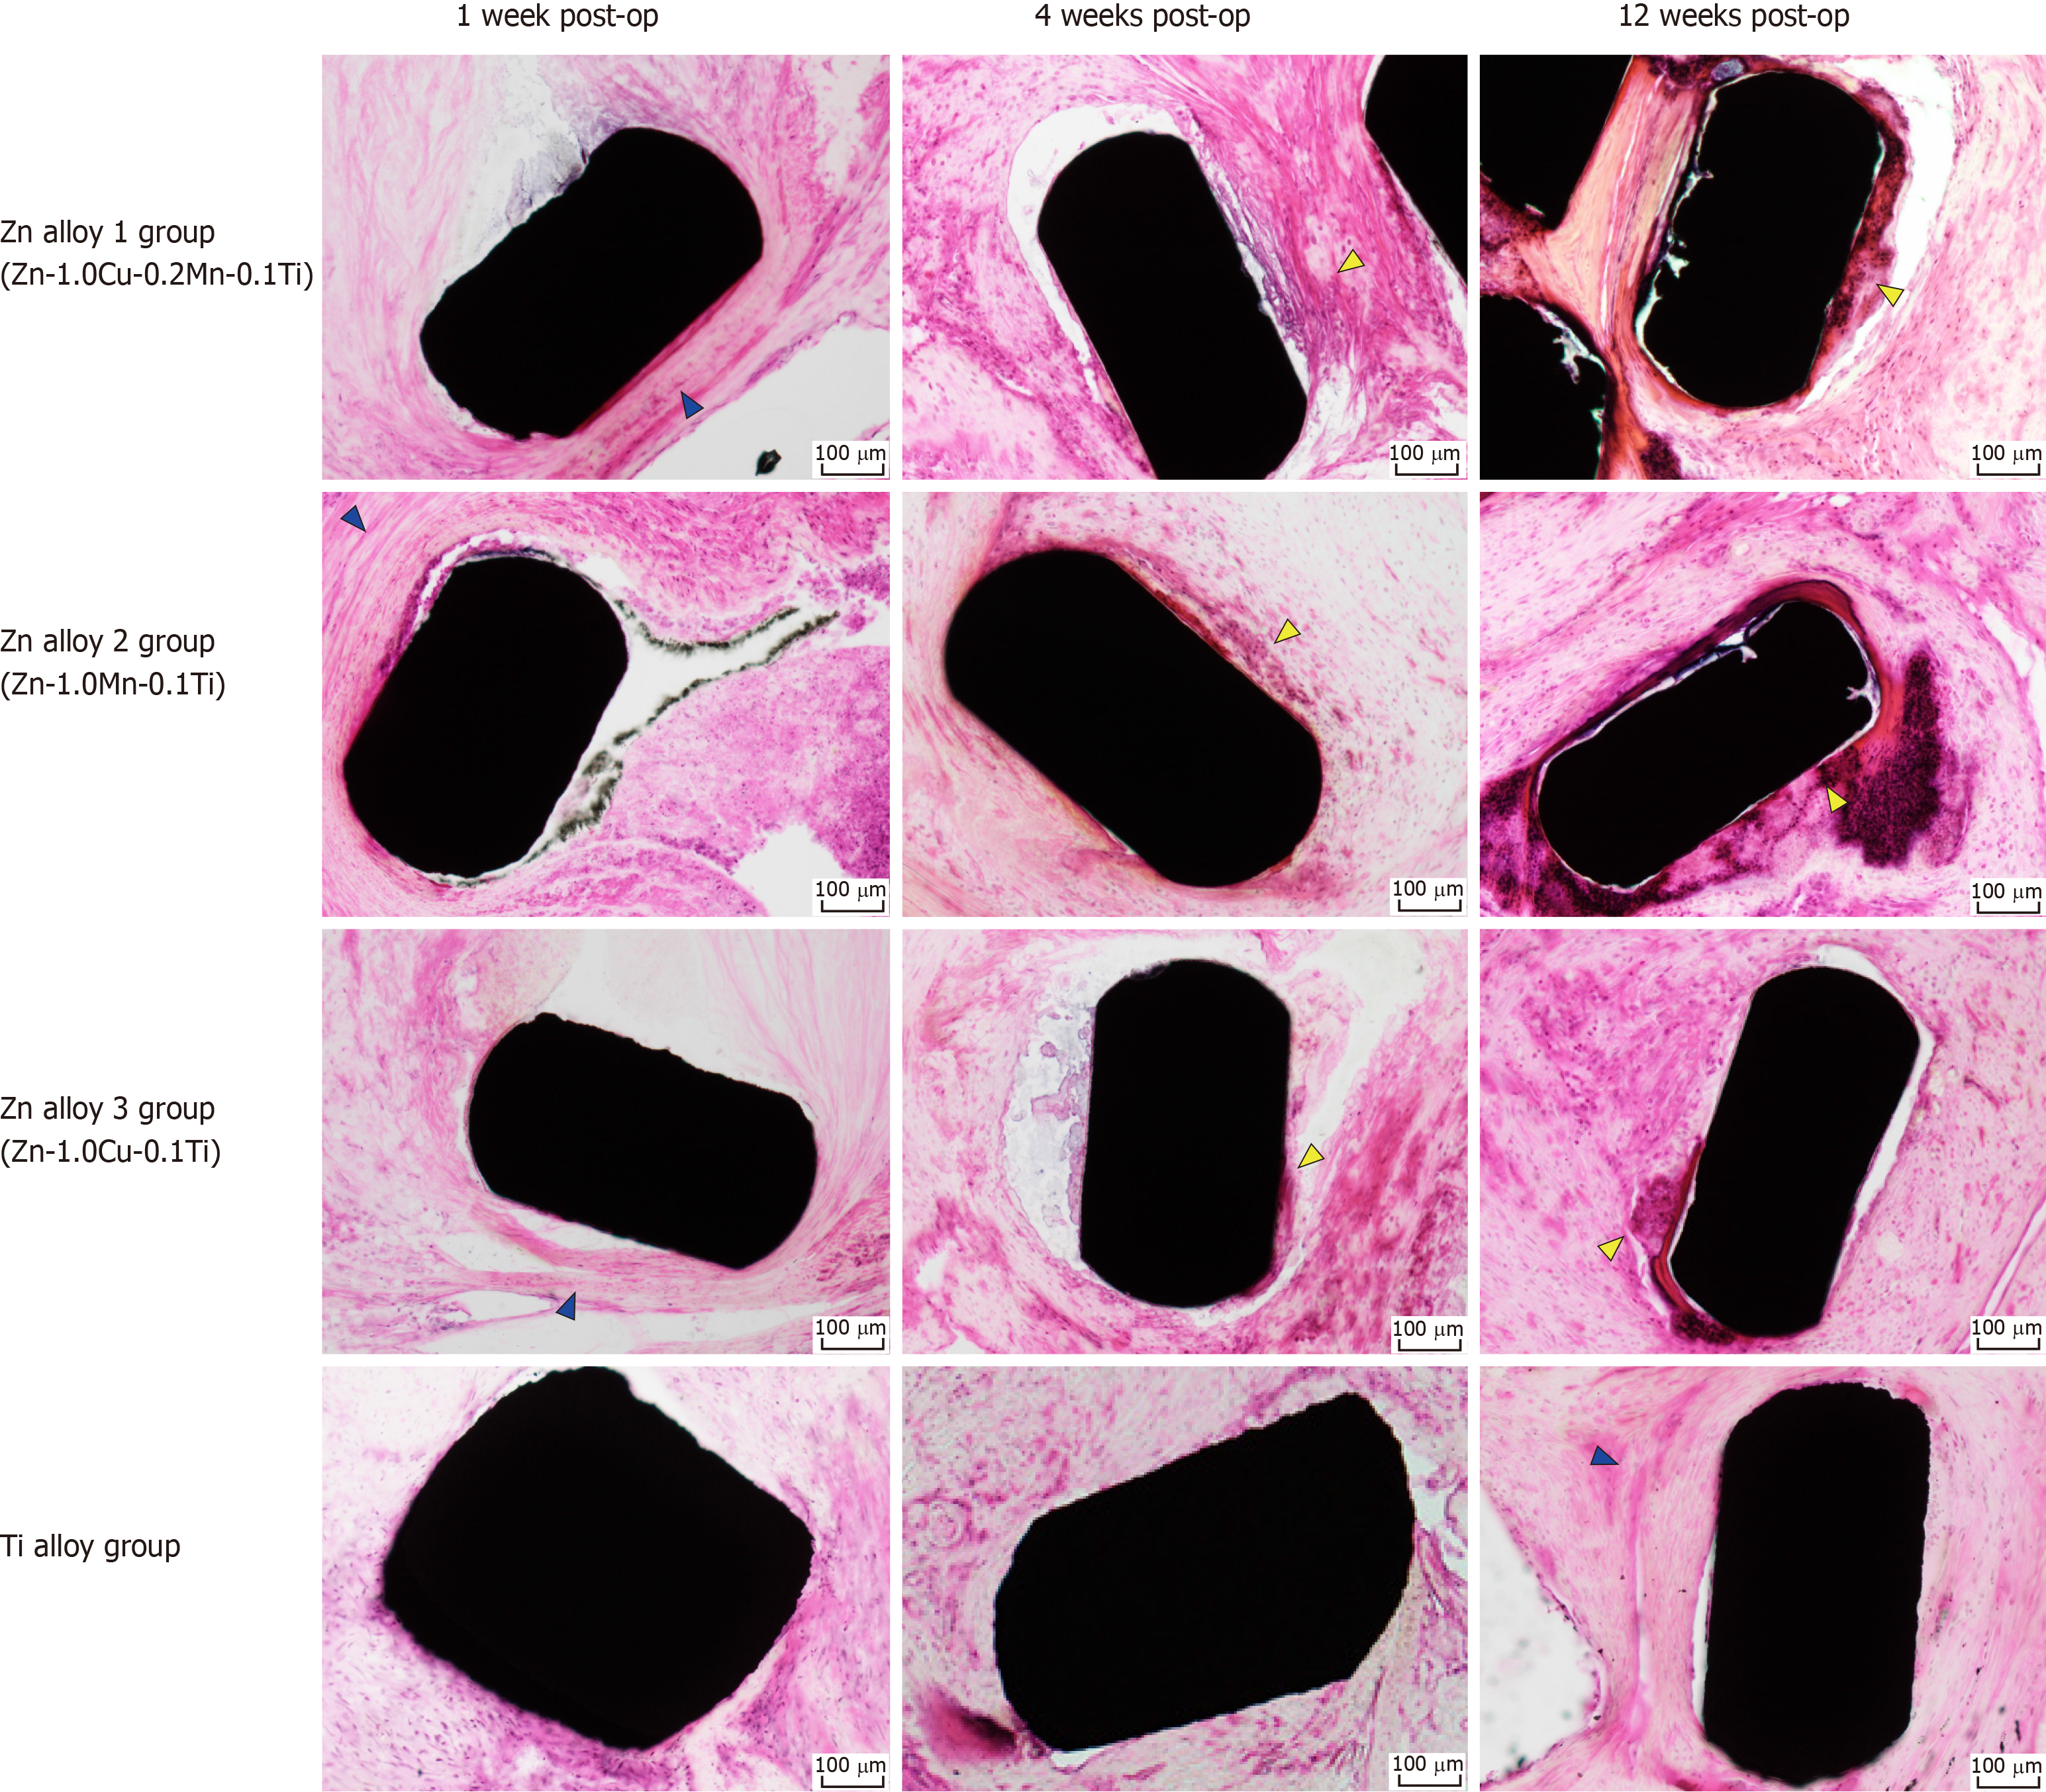
Figure 7 Histopathological images of rabbit gastric tissues surrounding Zn alloy and Ti alloy staples after hematoxylin–eosin staining.
Blue arrows indicate fibrous layers of tissue (observed around both, the Ti alloy and Zn alloy staples), and yellow arrows indicate inflammatory cell infiltrations (localized around Zn alloy staples only).
- Citation: Amano H, Miyake K, Hinoki A, Yokota K, Kinoshita F, Nakazawa A, Tanaka Y, Seto Y, Uchida H. Novel zinc alloys for biodegradable surgical staples. World J Clin Cases 2020; 8(3): 504-516
- URL: https://www.wjgnet.com/2307-8960/full/v8/i3/504.htm
- DOI: https://dx.doi.org/10.12998/wjcc.v8.i3.504


