Copyright
©The Author(s) 2020.
World J Clin Cases. Sep 26, 2020; 8(18): 4075-4093
Published online Sep 26, 2020. doi: 10.12998/wjcc.v8.i18.4075
Published online Sep 26, 2020. doi: 10.12998/wjcc.v8.i18.4075
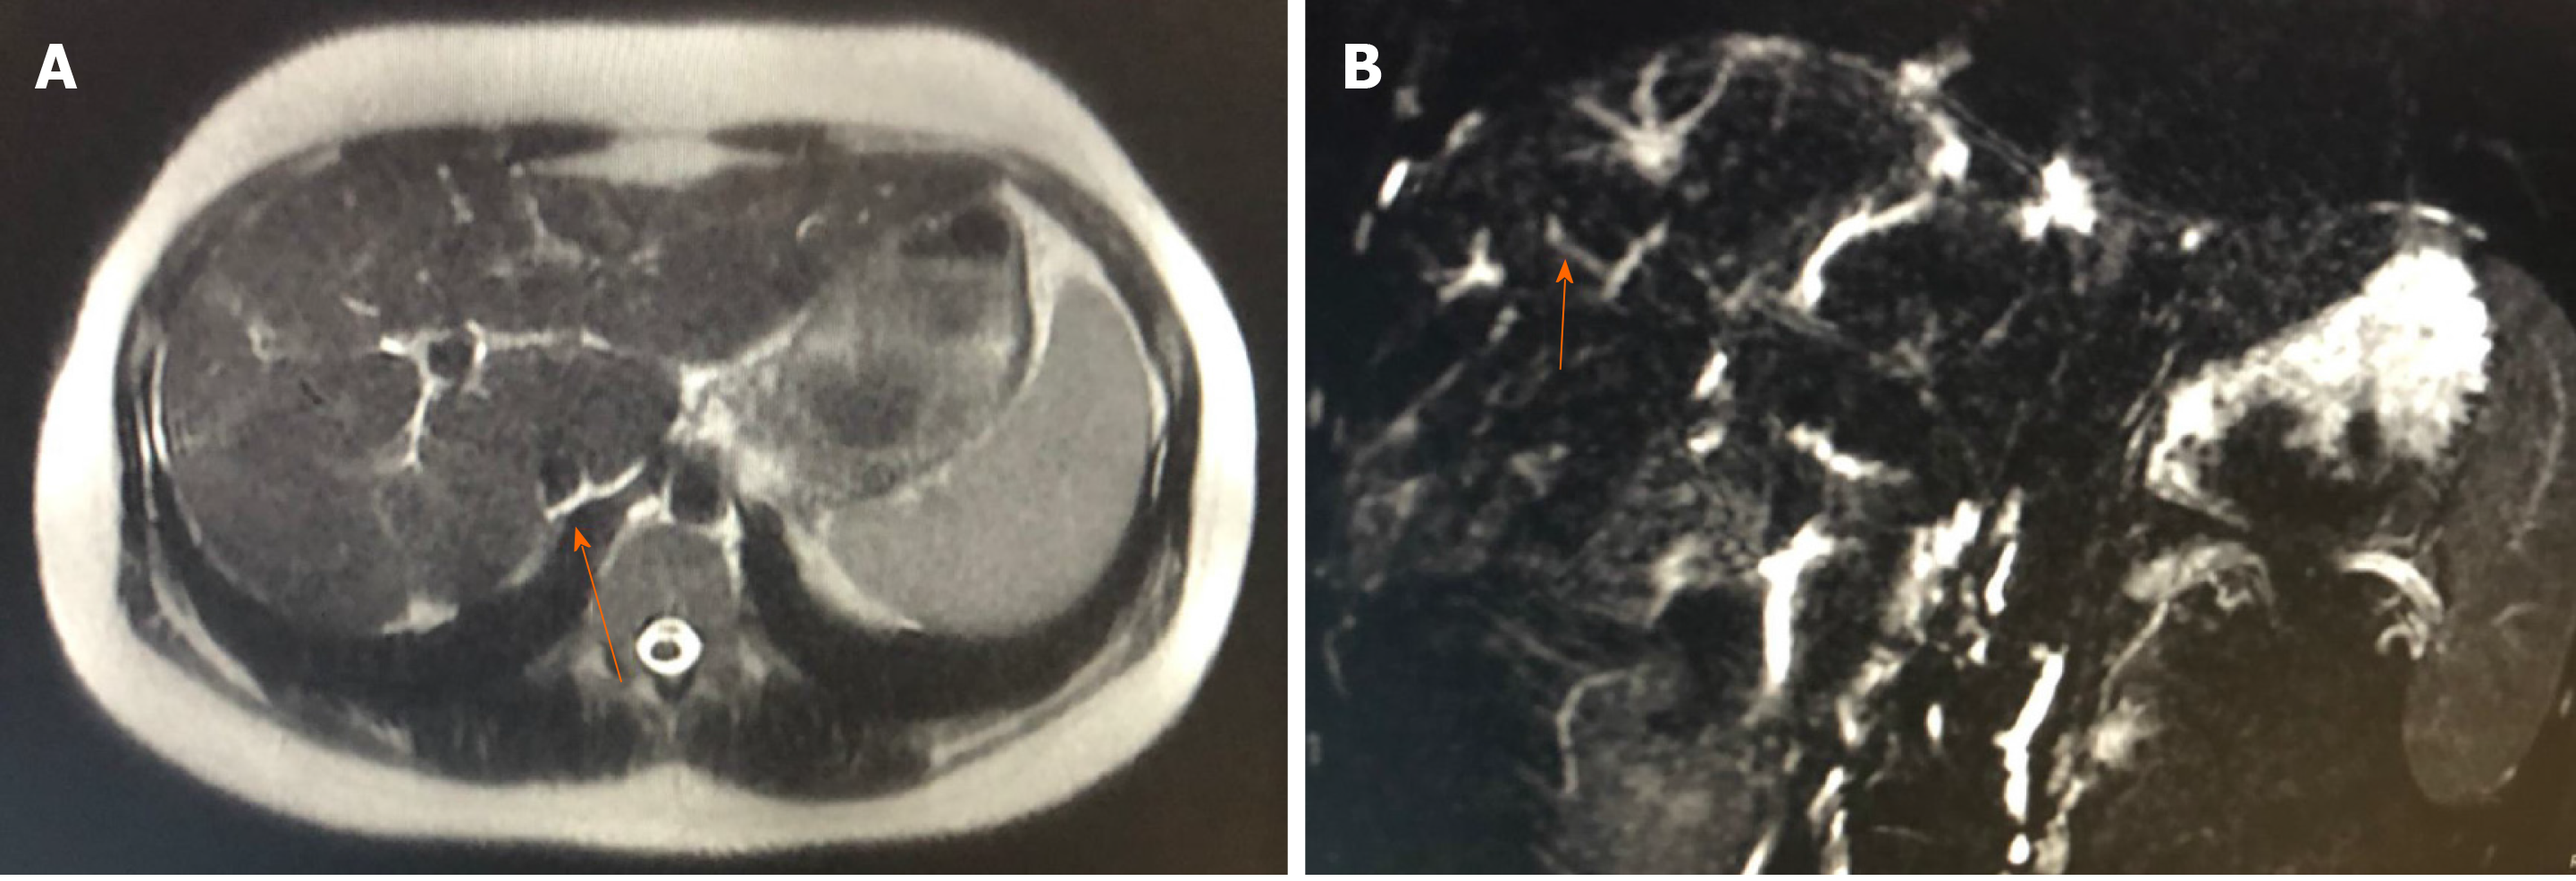
Figure 1 Magnetic resonance cholangiography.
A: Reduced-sized liver, with lobulated contours and blunt edges, showing caudate lobe hypertrophy and volumetric reduction of the right lobe periphery; B: Multiple focal areas of caliber reduction in the intrahepatic bile duct, with upstream biliary ectasia, associated with signs of distortion of the usual architecture and parietal irregularities in the bile duct.
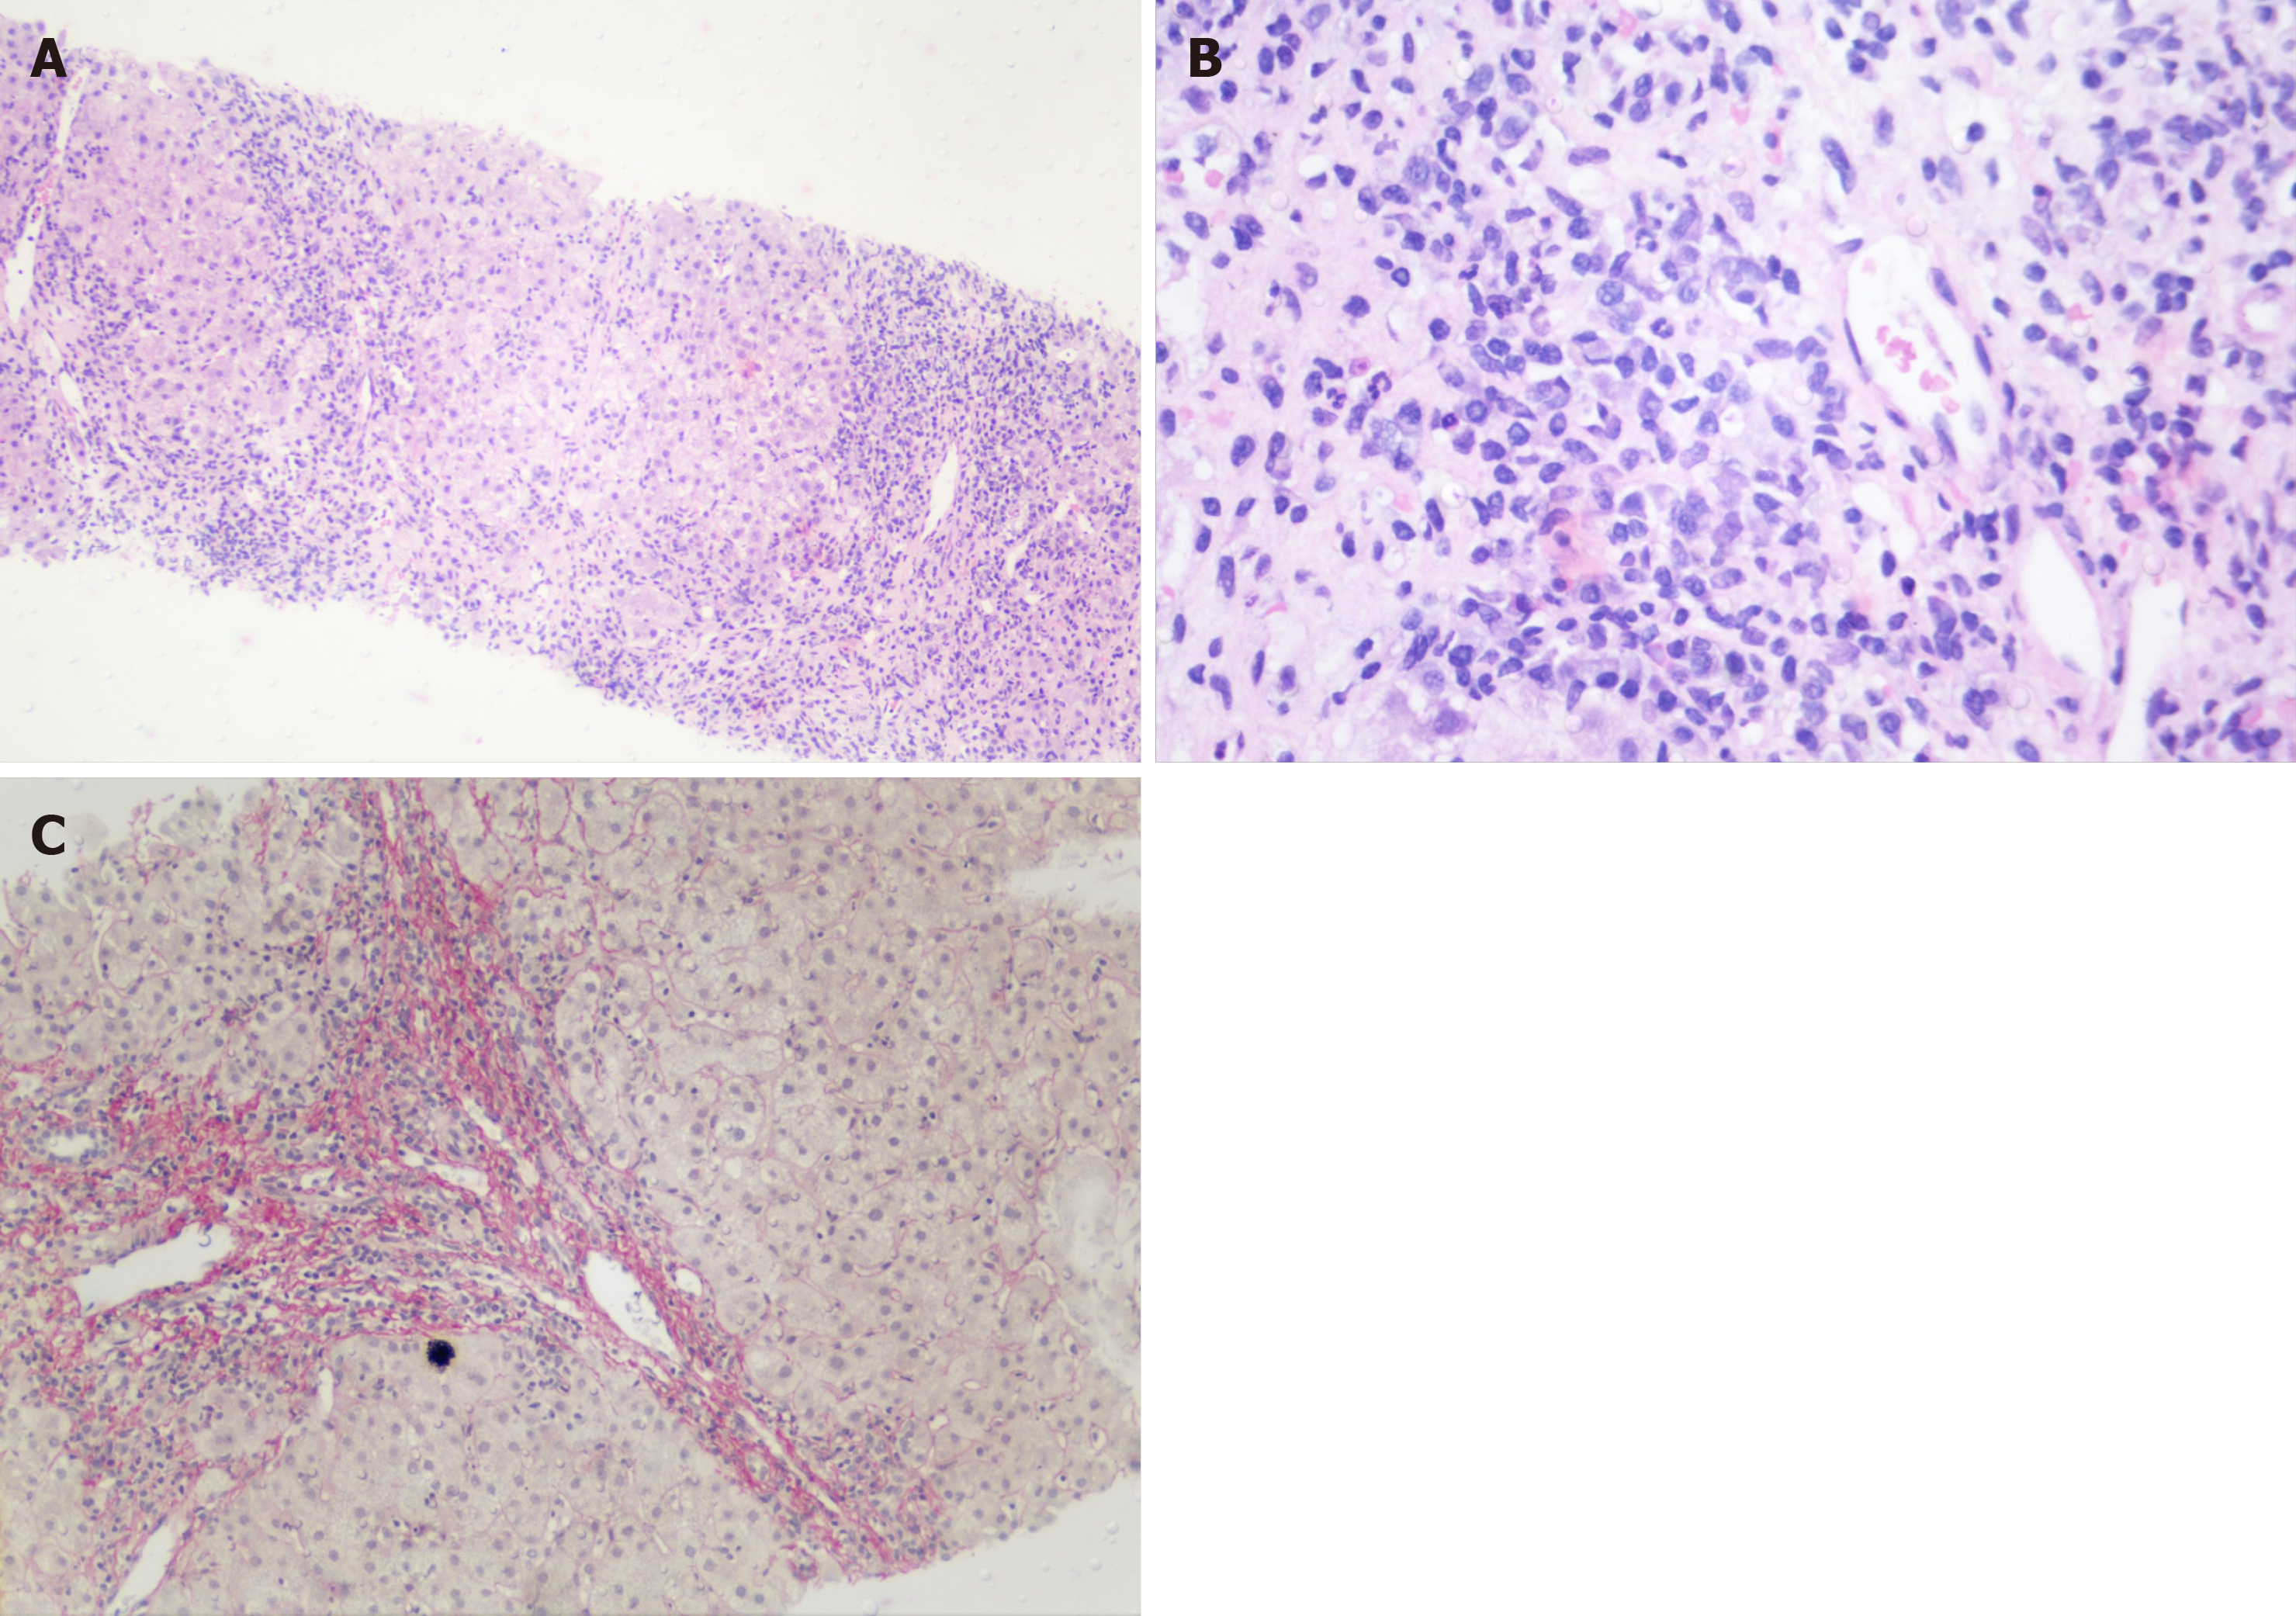
Figure 2 Liver biopsy.
A: Intense increase in periportal necroinflammatory activity (Hematoxylin-eosin staining 40 ×); B: Grouping of periportal plasmocyte cells (Hematoxylin-eosin staining 100 ×); and C: Fibrosis in red demarking a nodule (Picro Sirius Red 100 ×).
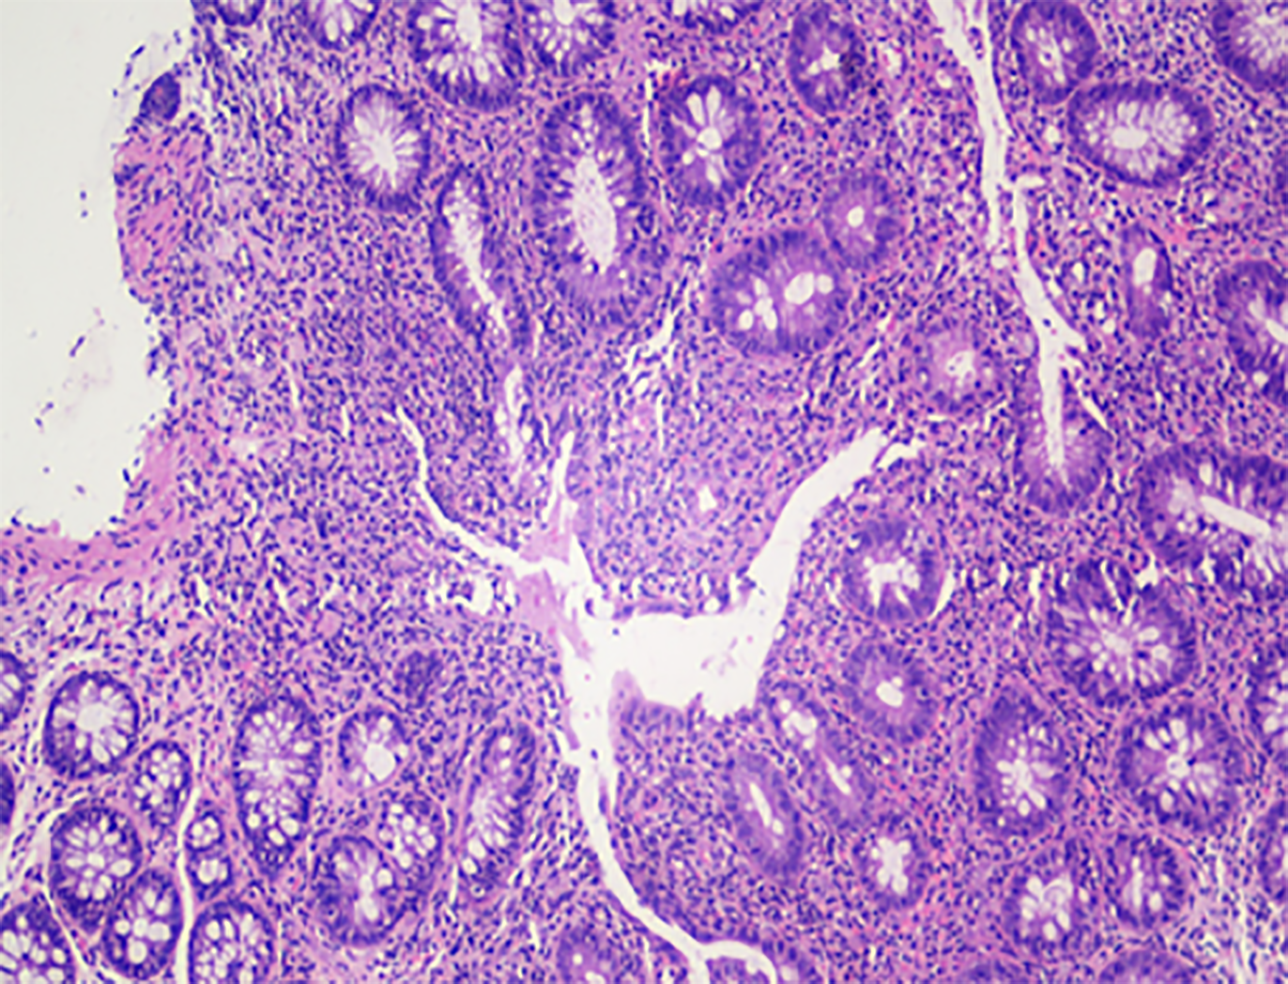
Figure 3 Ascending colon, biopsy.
Area of erosion in the ascending colon (Hematoxylin-eosin staining 100 ×).
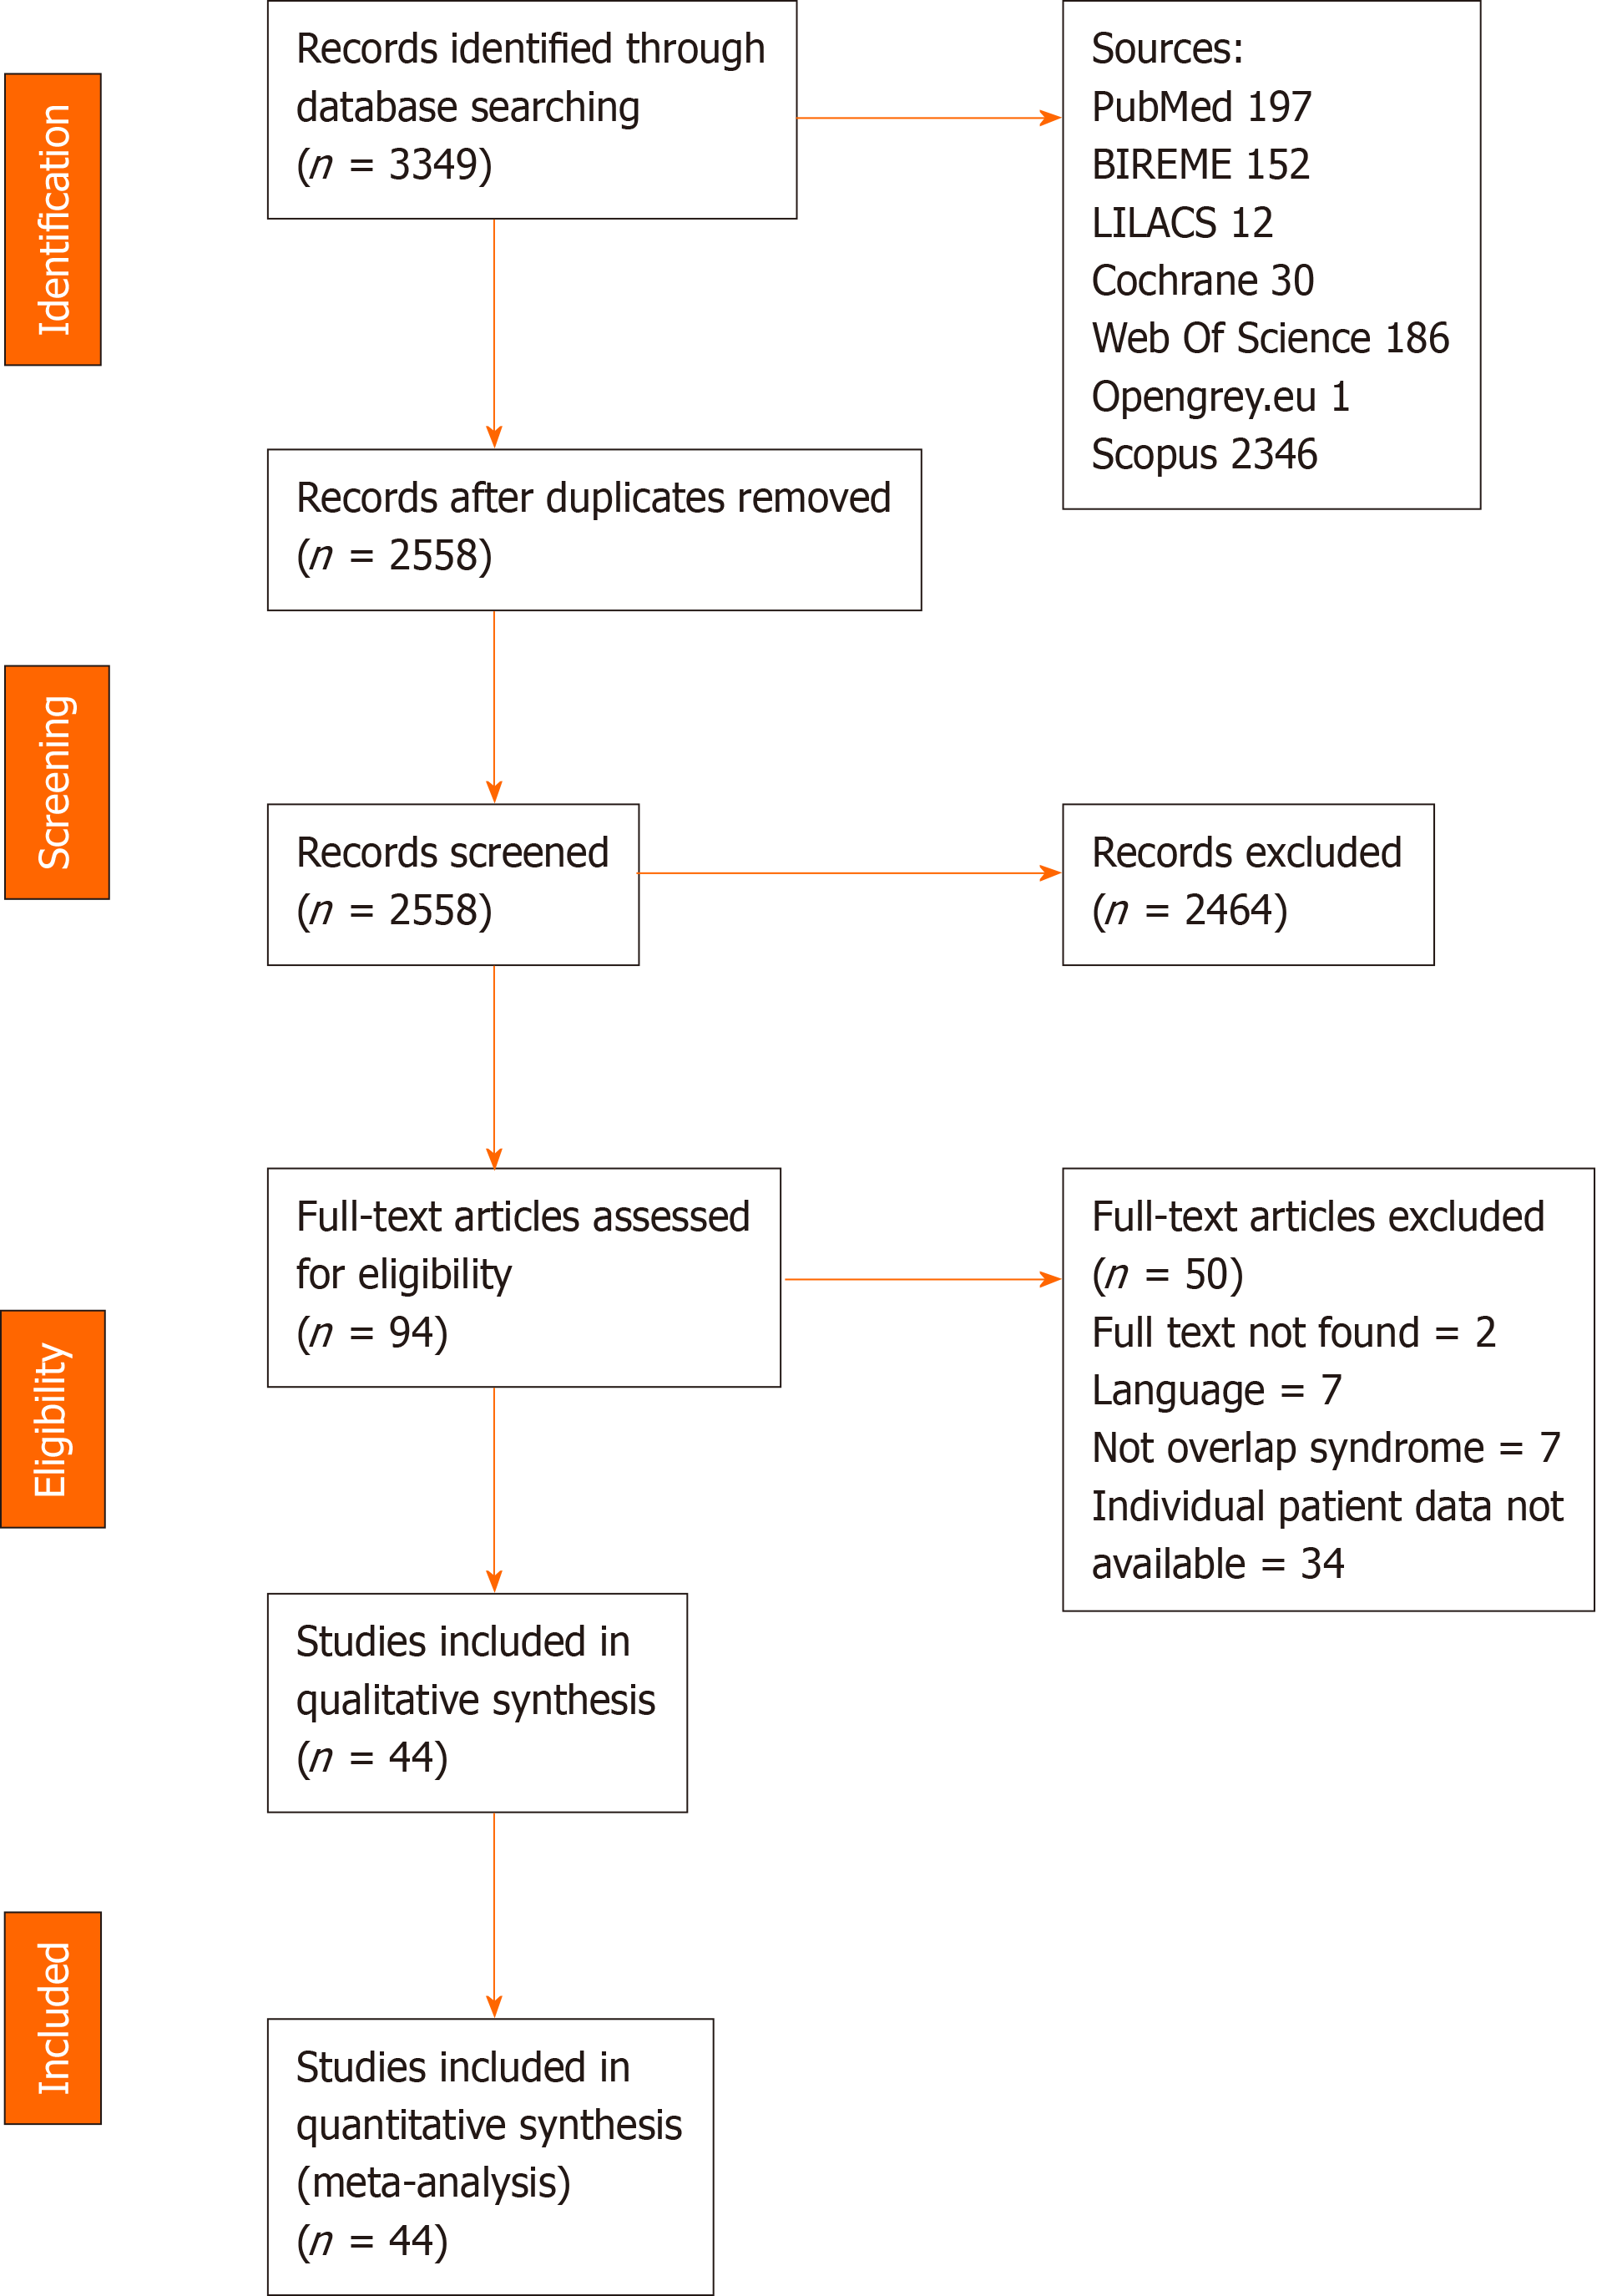
Figure 4 Prisma flowchart.
- Citation: Ballotin VR, Bigarella LG, Riva F, Onzi G, Balbinot RA, Balbinot SS, Soldera J. Primary sclerosing cholangitis and autoimmune hepatitis overlap syndrome associated with inflammatory bowel disease: A case report and systematic review. World J Clin Cases 2020; 8(18): 4075-4093
- URL: https://www.wjgnet.com/2307-8960/full/v8/i18/4075.htm
- DOI: https://dx.doi.org/10.12998/wjcc.v8.i18.4075


