Copyright
©The Author(s) 2020.
World J Clin Cases. Sep 6, 2020; 8(17): 3867-3874
Published online Sep 6, 2020. doi: 10.12998/wjcc.v8.i17.3867
Published online Sep 6, 2020. doi: 10.12998/wjcc.v8.i17.3867
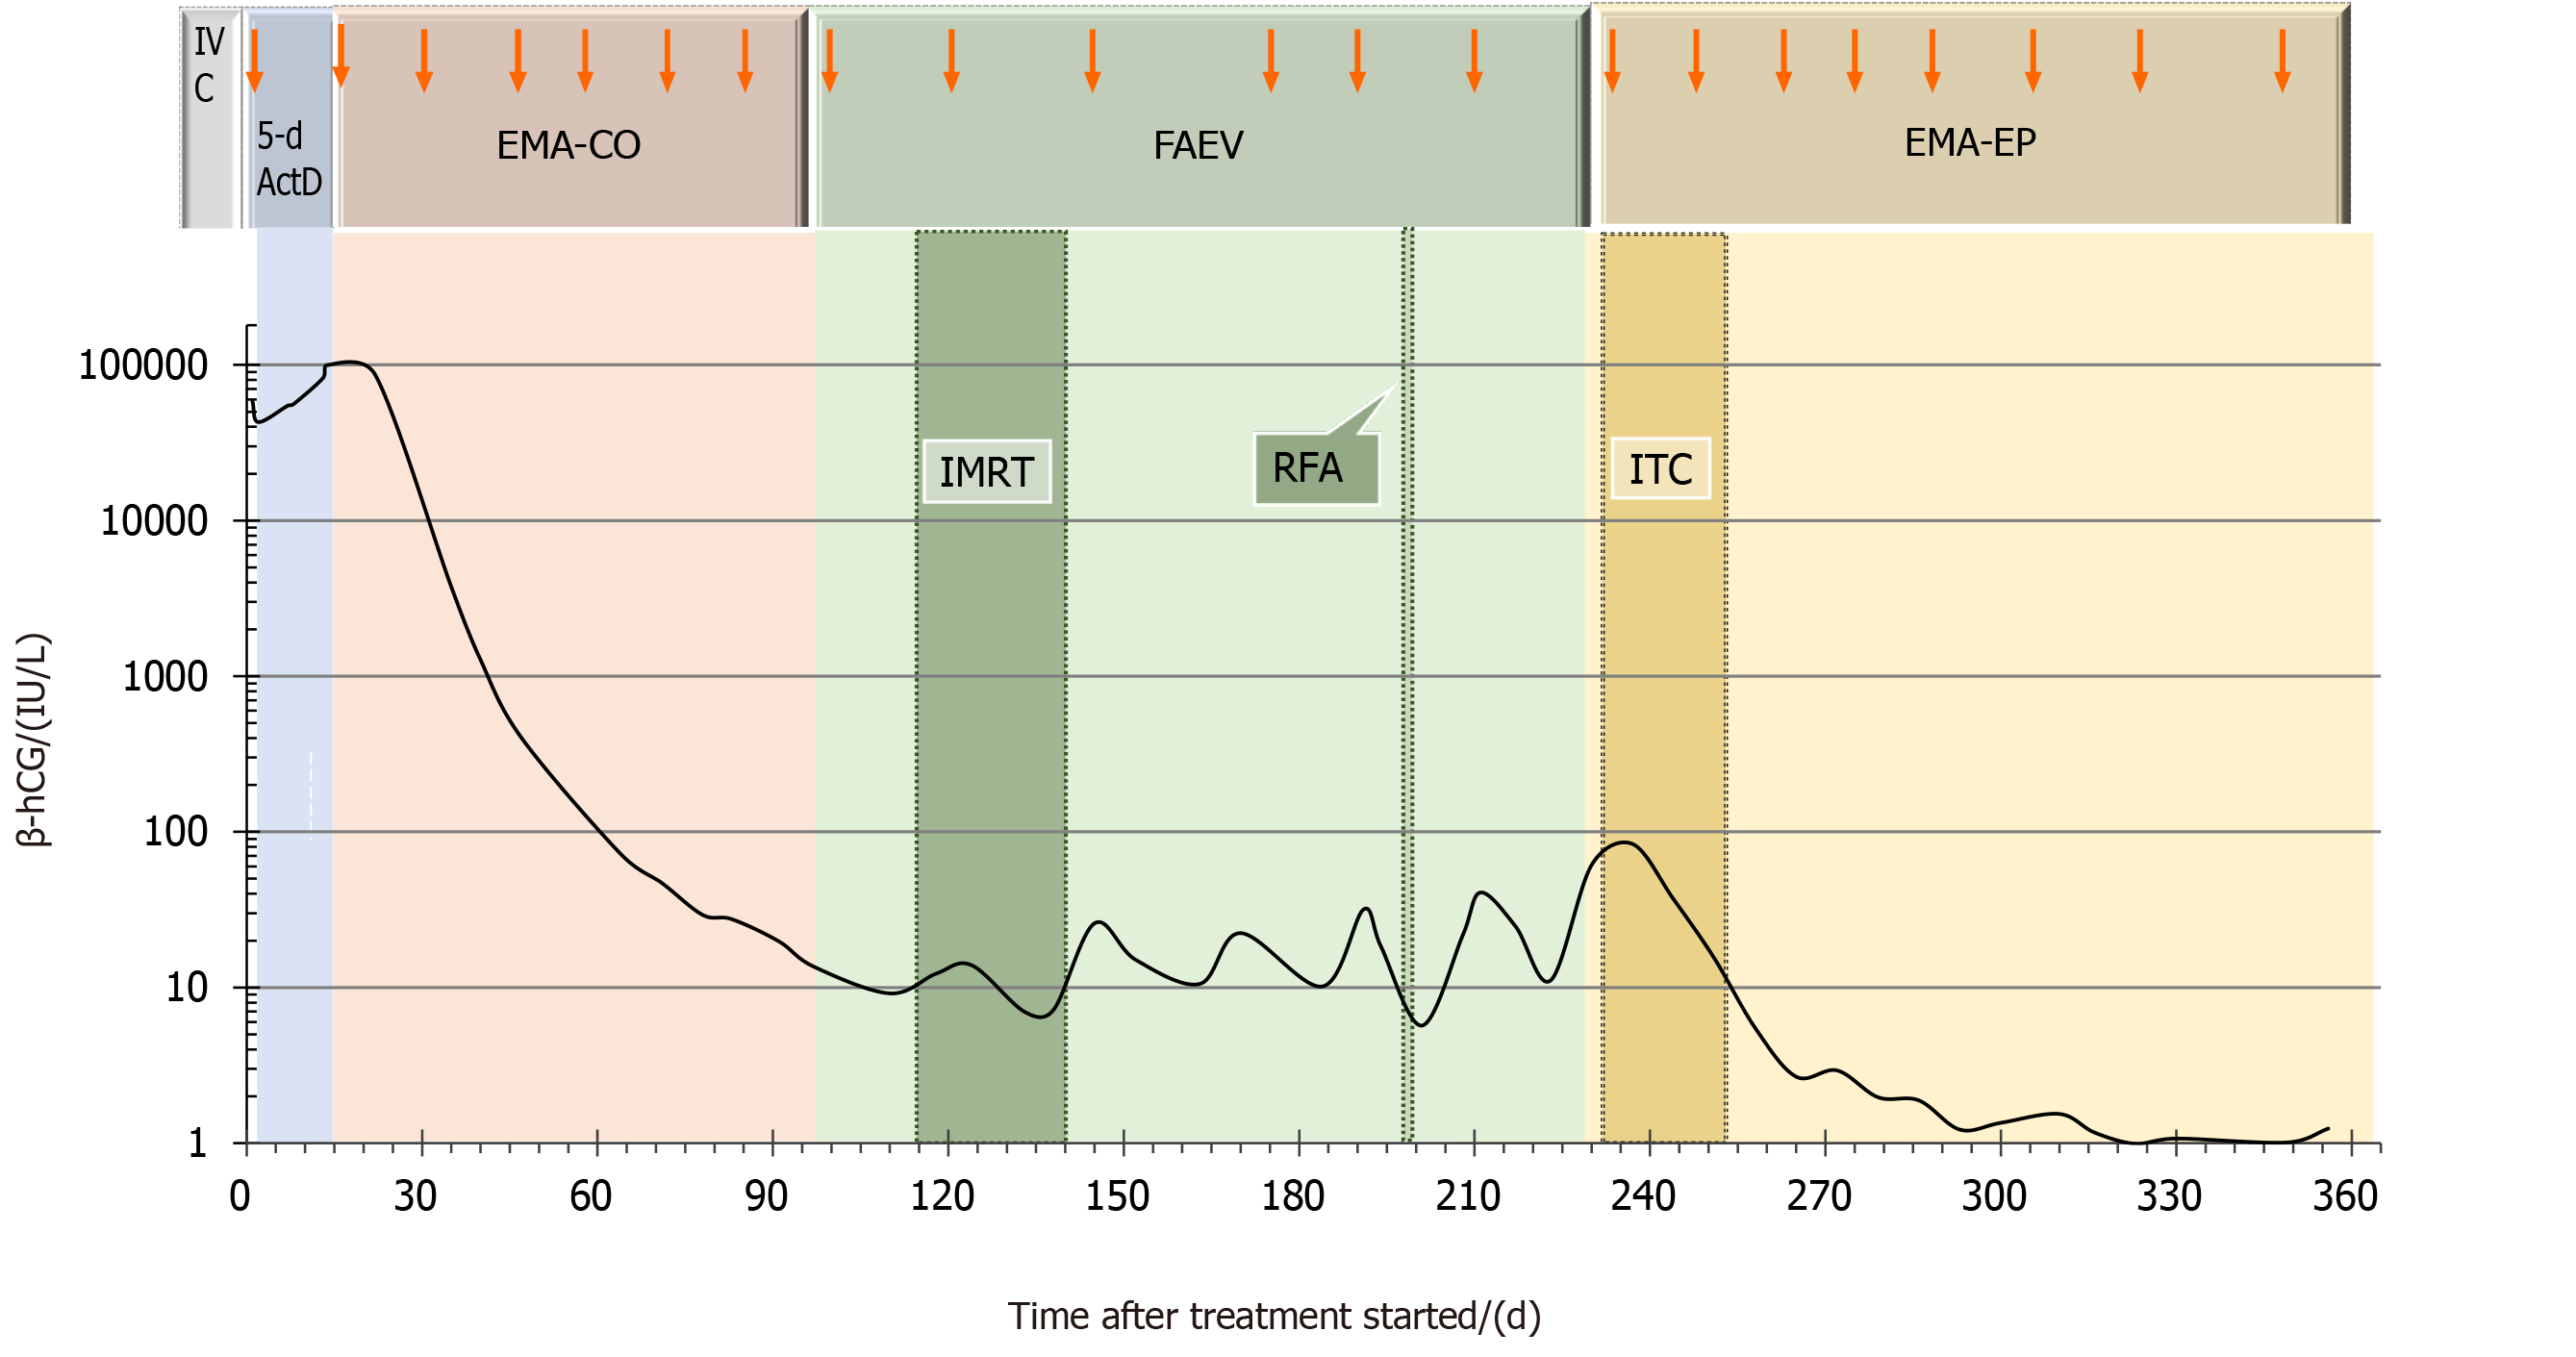
Figure 1 A logarithmic graphical representation of the serial β-human chorionic gonadotropin levels as a line graph has been depicted.
The X-axis denotes the day after treatment started, and the Y-axis denotes the serum concentration of serial β-human chorionic gonadotropin levels. The arrow represents the start of each course of intravenous chemotherapy. IVC: Intravenous chemotherapy; EMA-CO: Etoposide, methotrexate, actinomycin-D, vincristine, cyclophosphamide; FAEV: Floxuridine, dactinomycin, etoposide and vincristine; EMA-EP: Methotrexate, etoposide, actinomycin D, etoposide and cisplatin; β-hCG: β-Human chorionic gonadotropin; IMRT: Intensity-modulated radiation therapy; RFA: Radiofrequency ablation; ITC: Intrathecal chemotherapy.
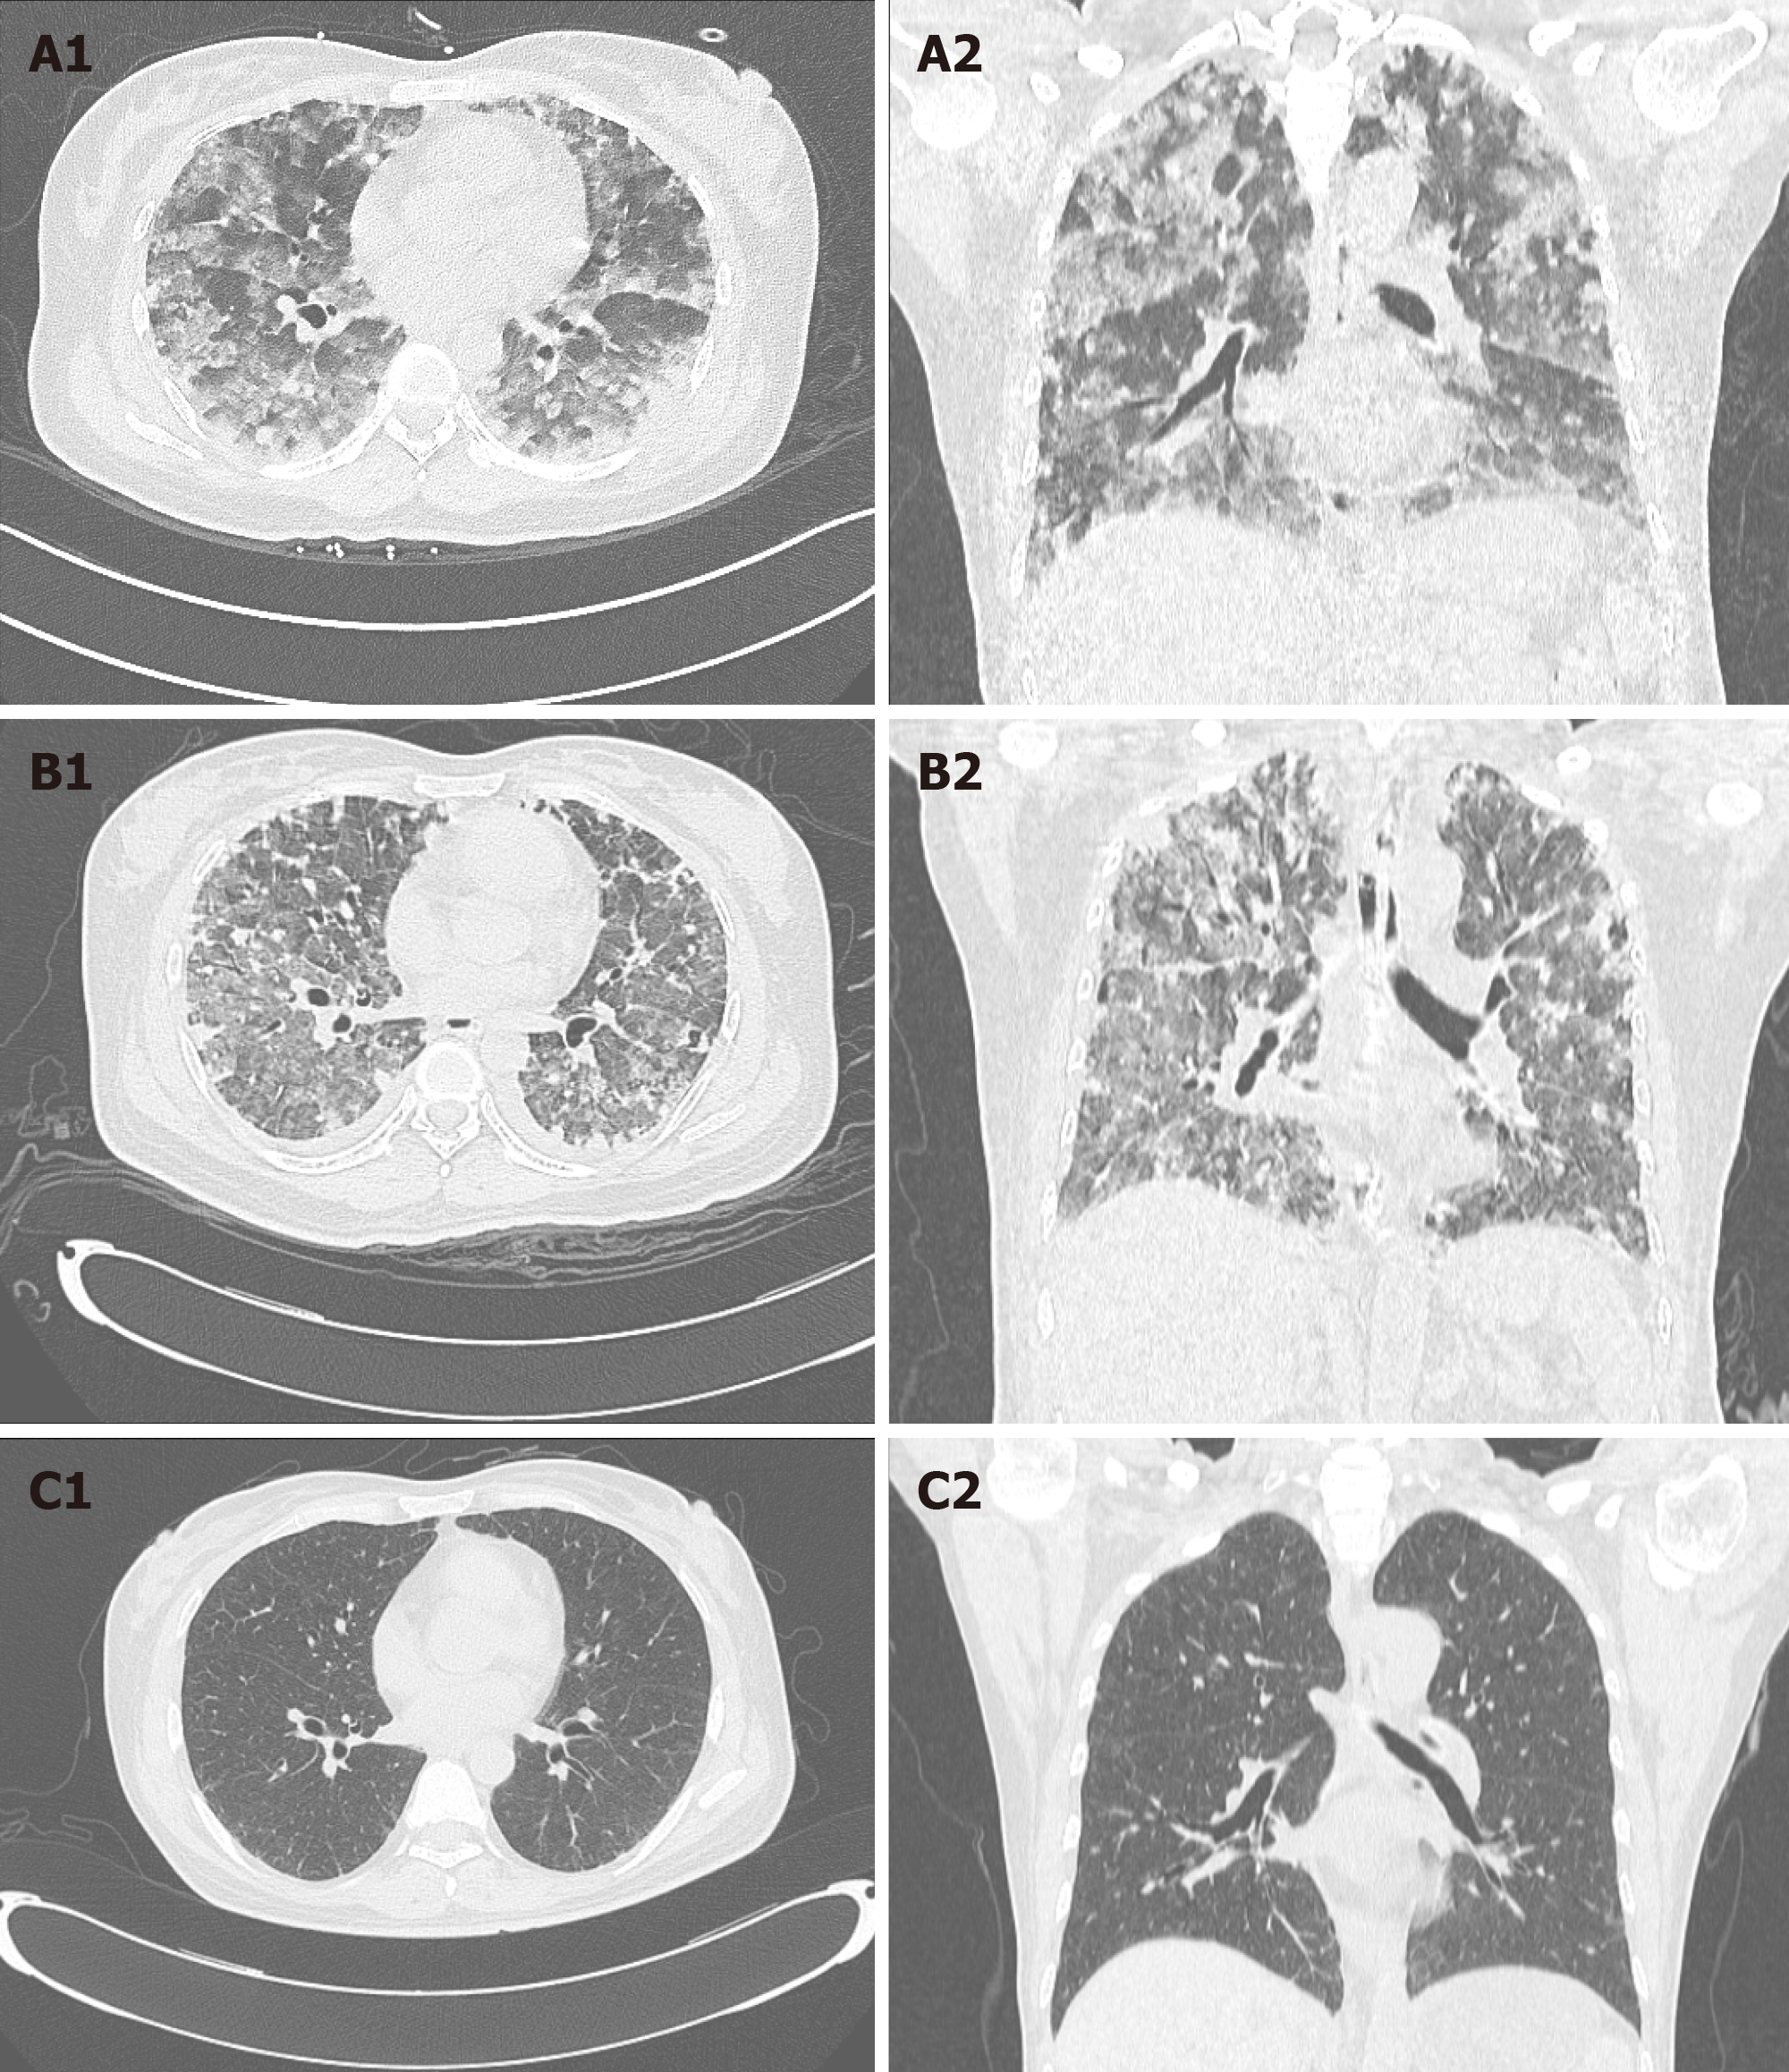
Figure 2 Comparison of pulmonary lesions.
A: Lung computed tomography before chemotherapy; B: Lung computed tomography after the first chemotherapy; C: Lung computed tomography after the last chemotherapy.
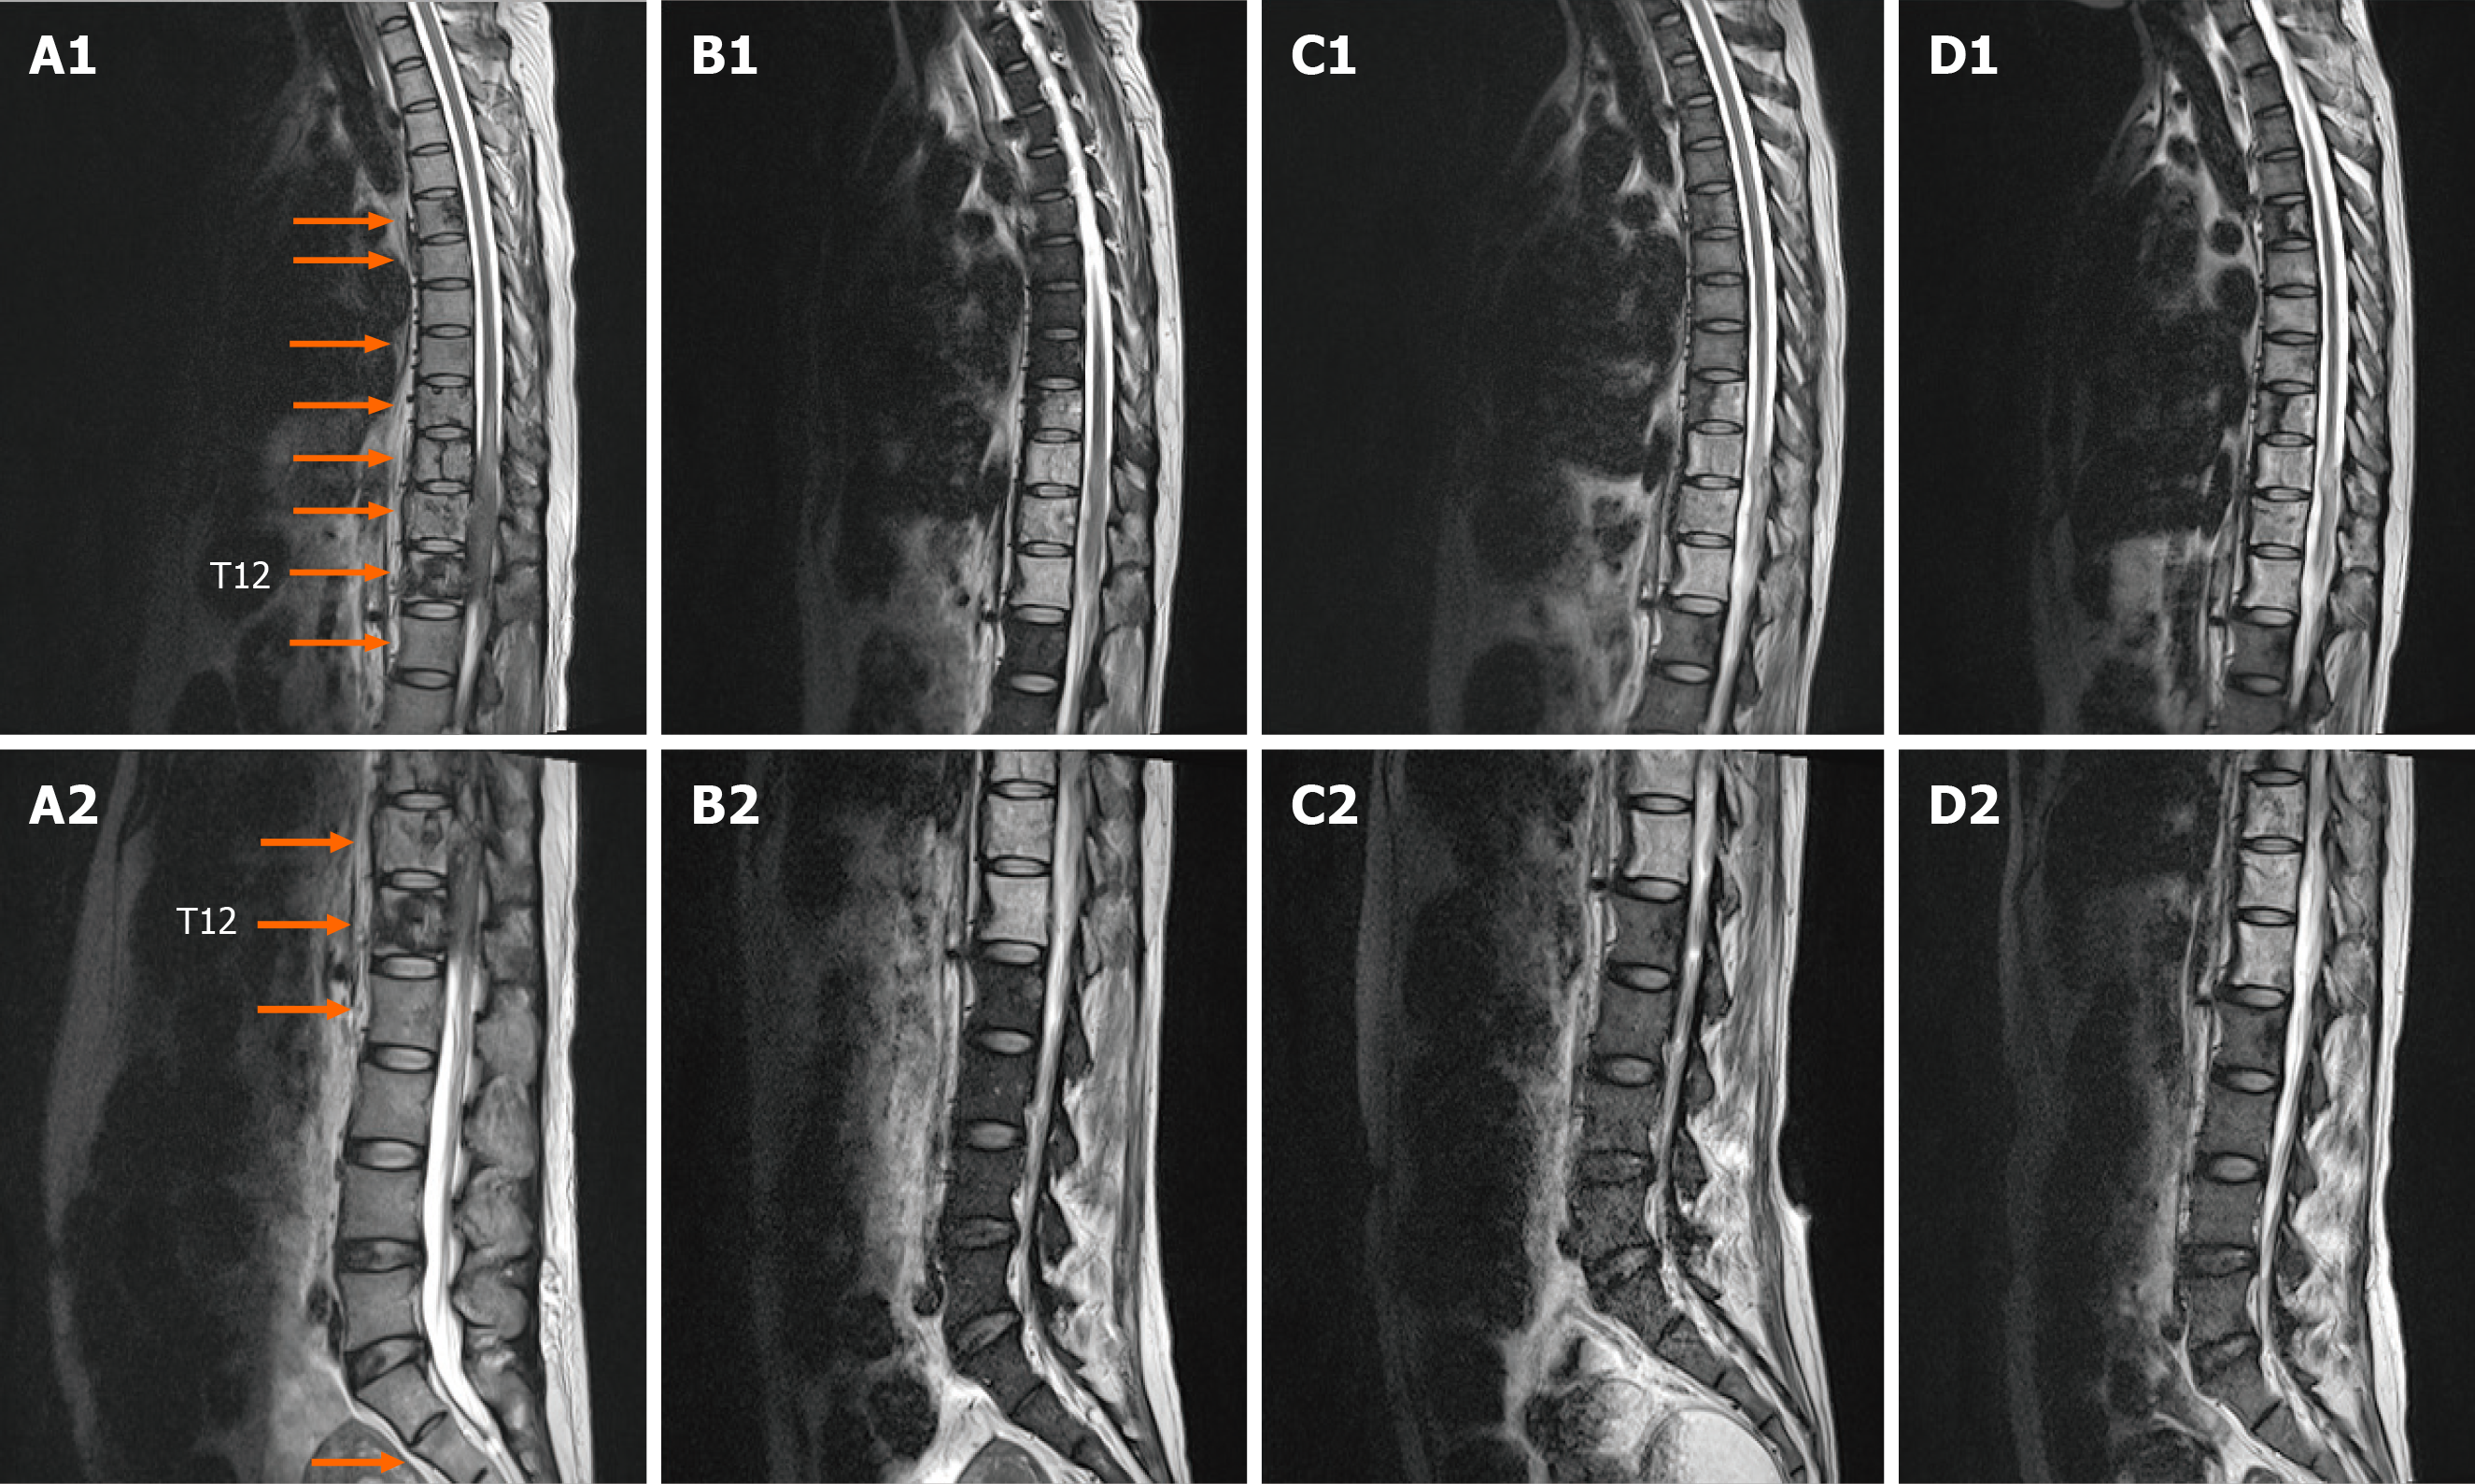
Figure 3 Comparison of spinal lesions.
A: Spinal magnetic resonance imaging (MRI) revealed T2-weighted scans at the initial presentation; B: Spinal MRI revealed T2-weighted scans before radiation; C: Spinal MRI revealed T2-weighted scans 1 mo after radiation; D: Spinal MRI revealed T2-weighted scans 6 mo after radiation. The arrow points to the bone metastatic lesion area.
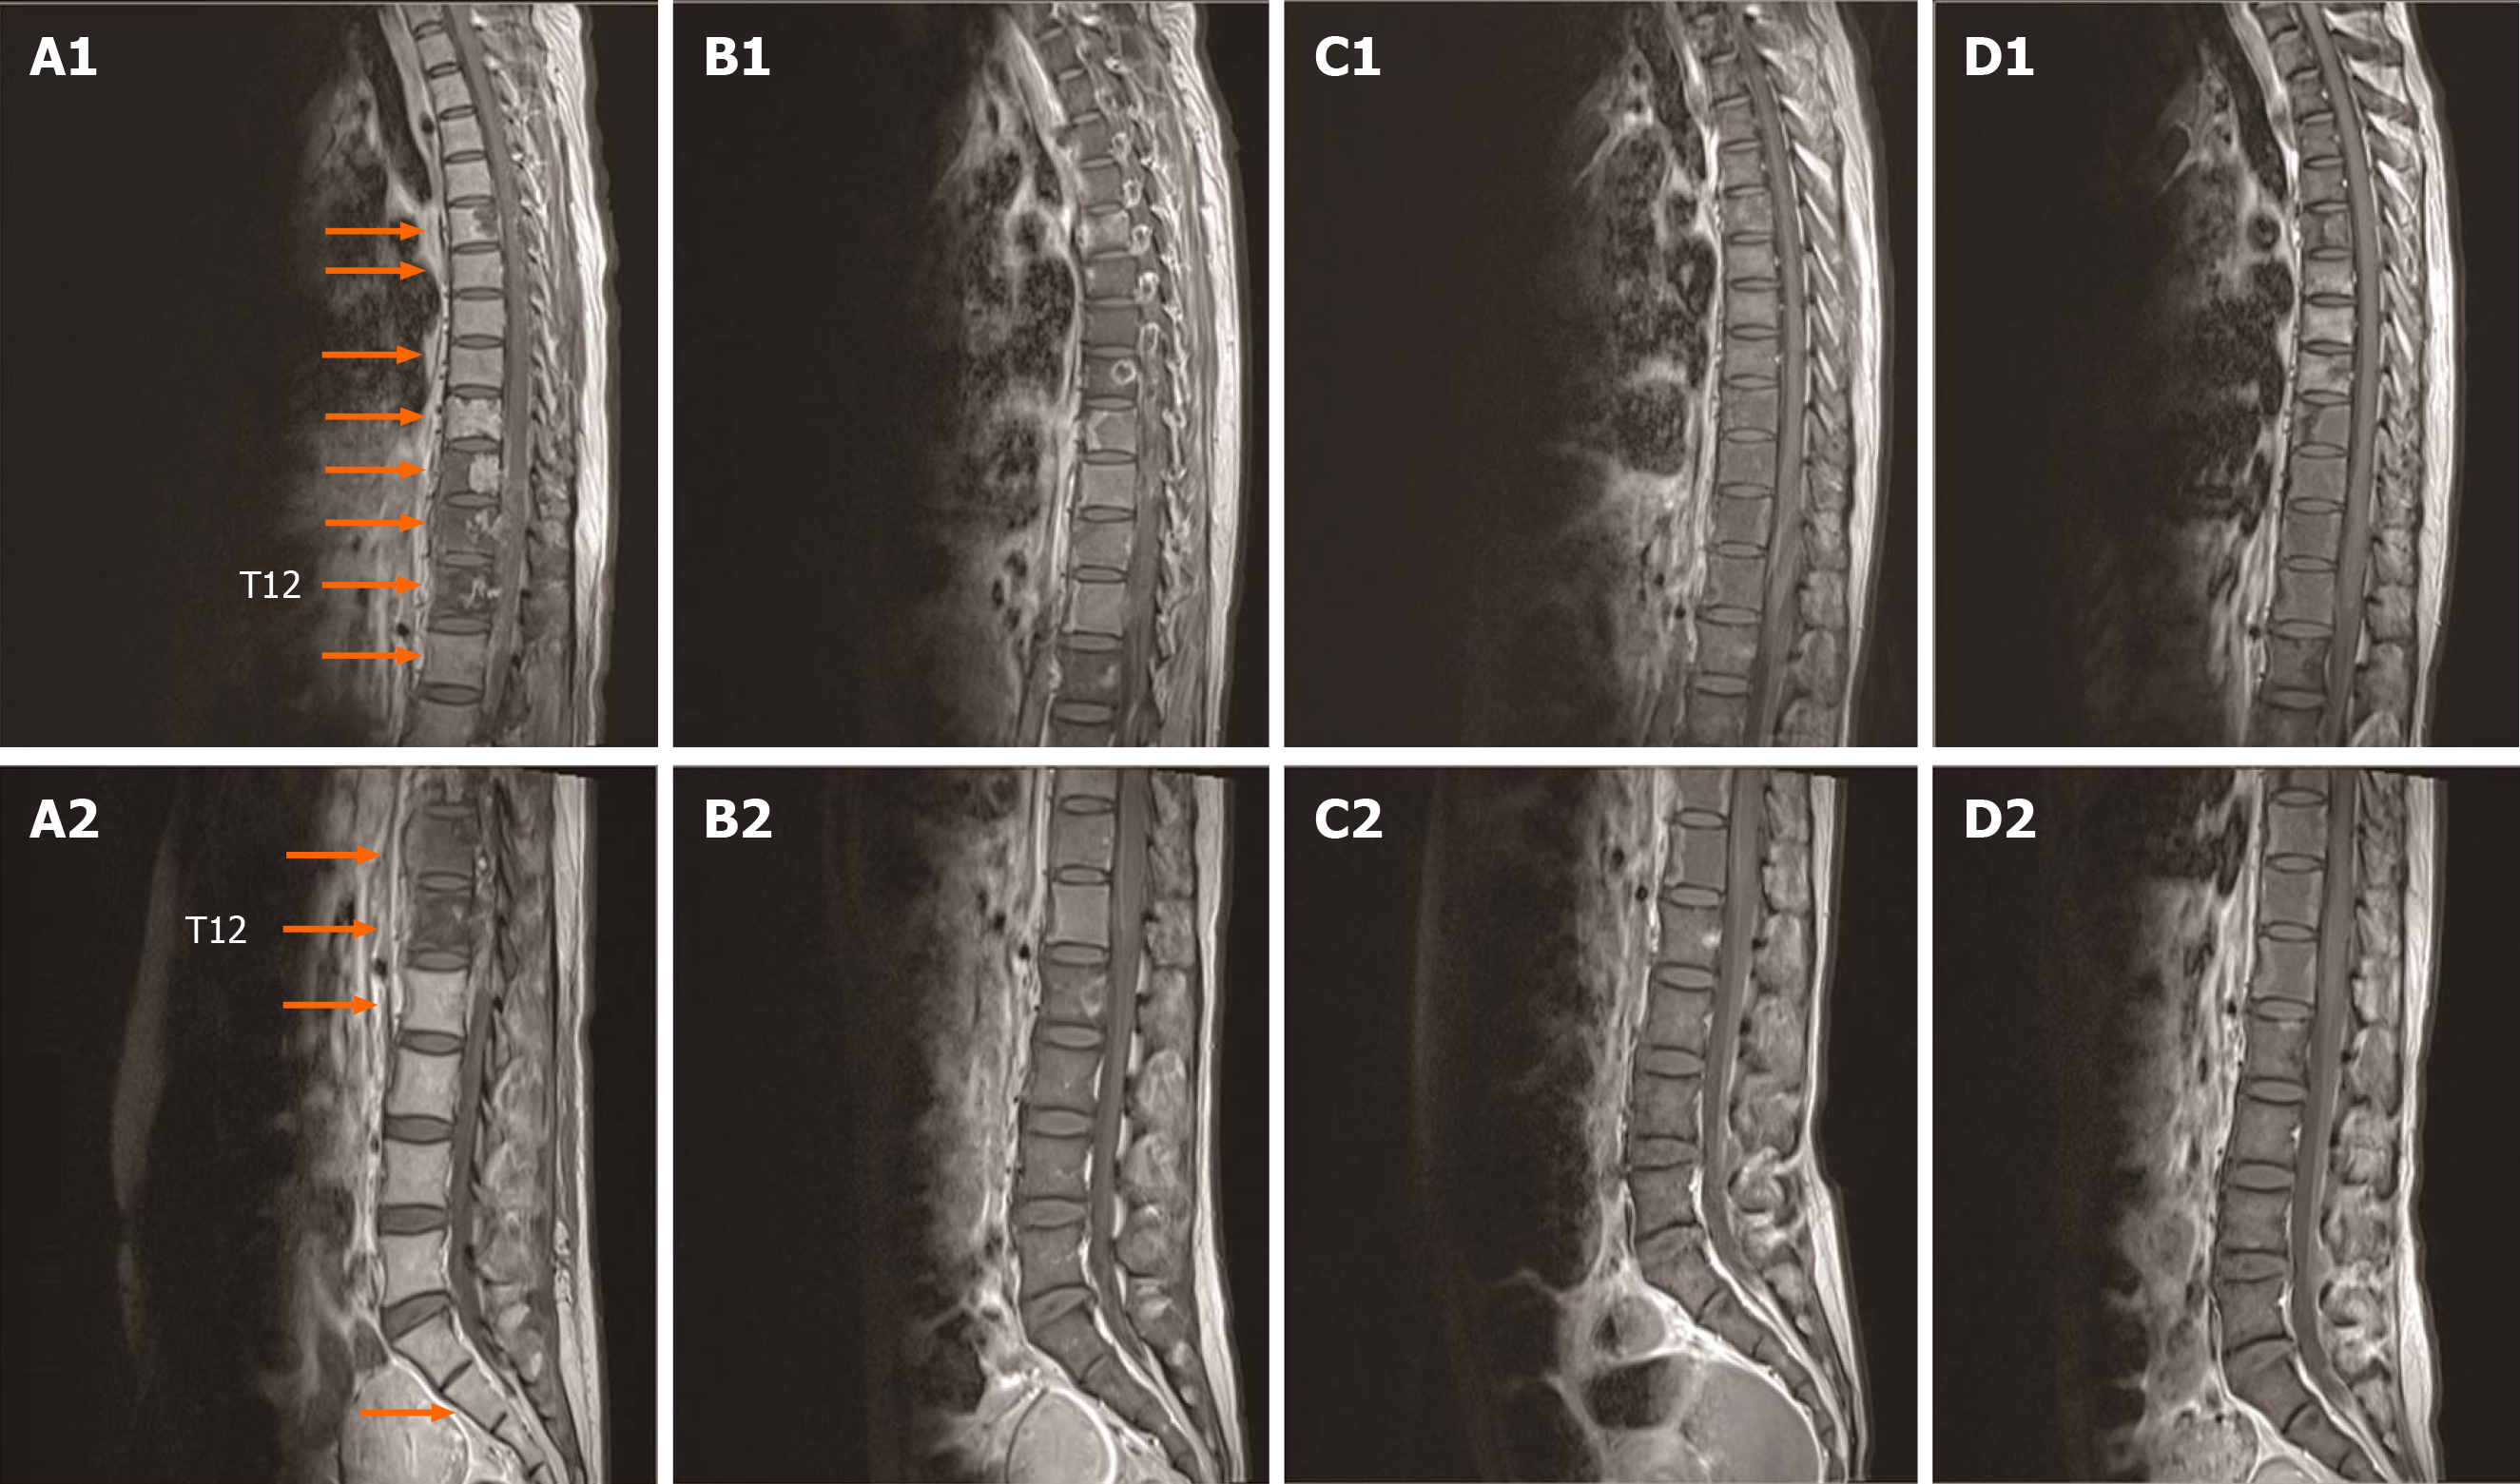
Figure 4 Comparison of spinal lesions.
A: Spinal magnetic resonance imaging (MRI) revealed enhancement scans at the initial presentation; B: Spinal MRI revealed enhancement scans before radiation; C: Spinal MRI revealed enhancement scans 1 mo after radiation; D: Spinal MRI revealed enhancement scans 6 mo after radiation. The arrow points to the bone metastatic lesion area.
- Citation: Lin YY, Sun Y, Jiang Y, Song BZ, Ke LJ. Multidisciplinary treatment of life-threatening hemoptysis and paraplegia of choriocarcinoma with pulmonary, hepatic and spinal metastases: A case report. World J Clin Cases 2020; 8(17): 3867-3874
- URL: https://www.wjgnet.com/2307-8960/full/v8/i17/3867.htm
- DOI: https://dx.doi.org/10.12998/wjcc.v8.i17.3867


