Copyright
©The Author(s) 2020.
World J Clin Cases. May 26, 2020; 8(10): 2056-2065
Published online May 26, 2020. doi: 10.12998/wjcc.v8.i10.2056
Published online May 26, 2020. doi: 10.12998/wjcc.v8.i10.2056
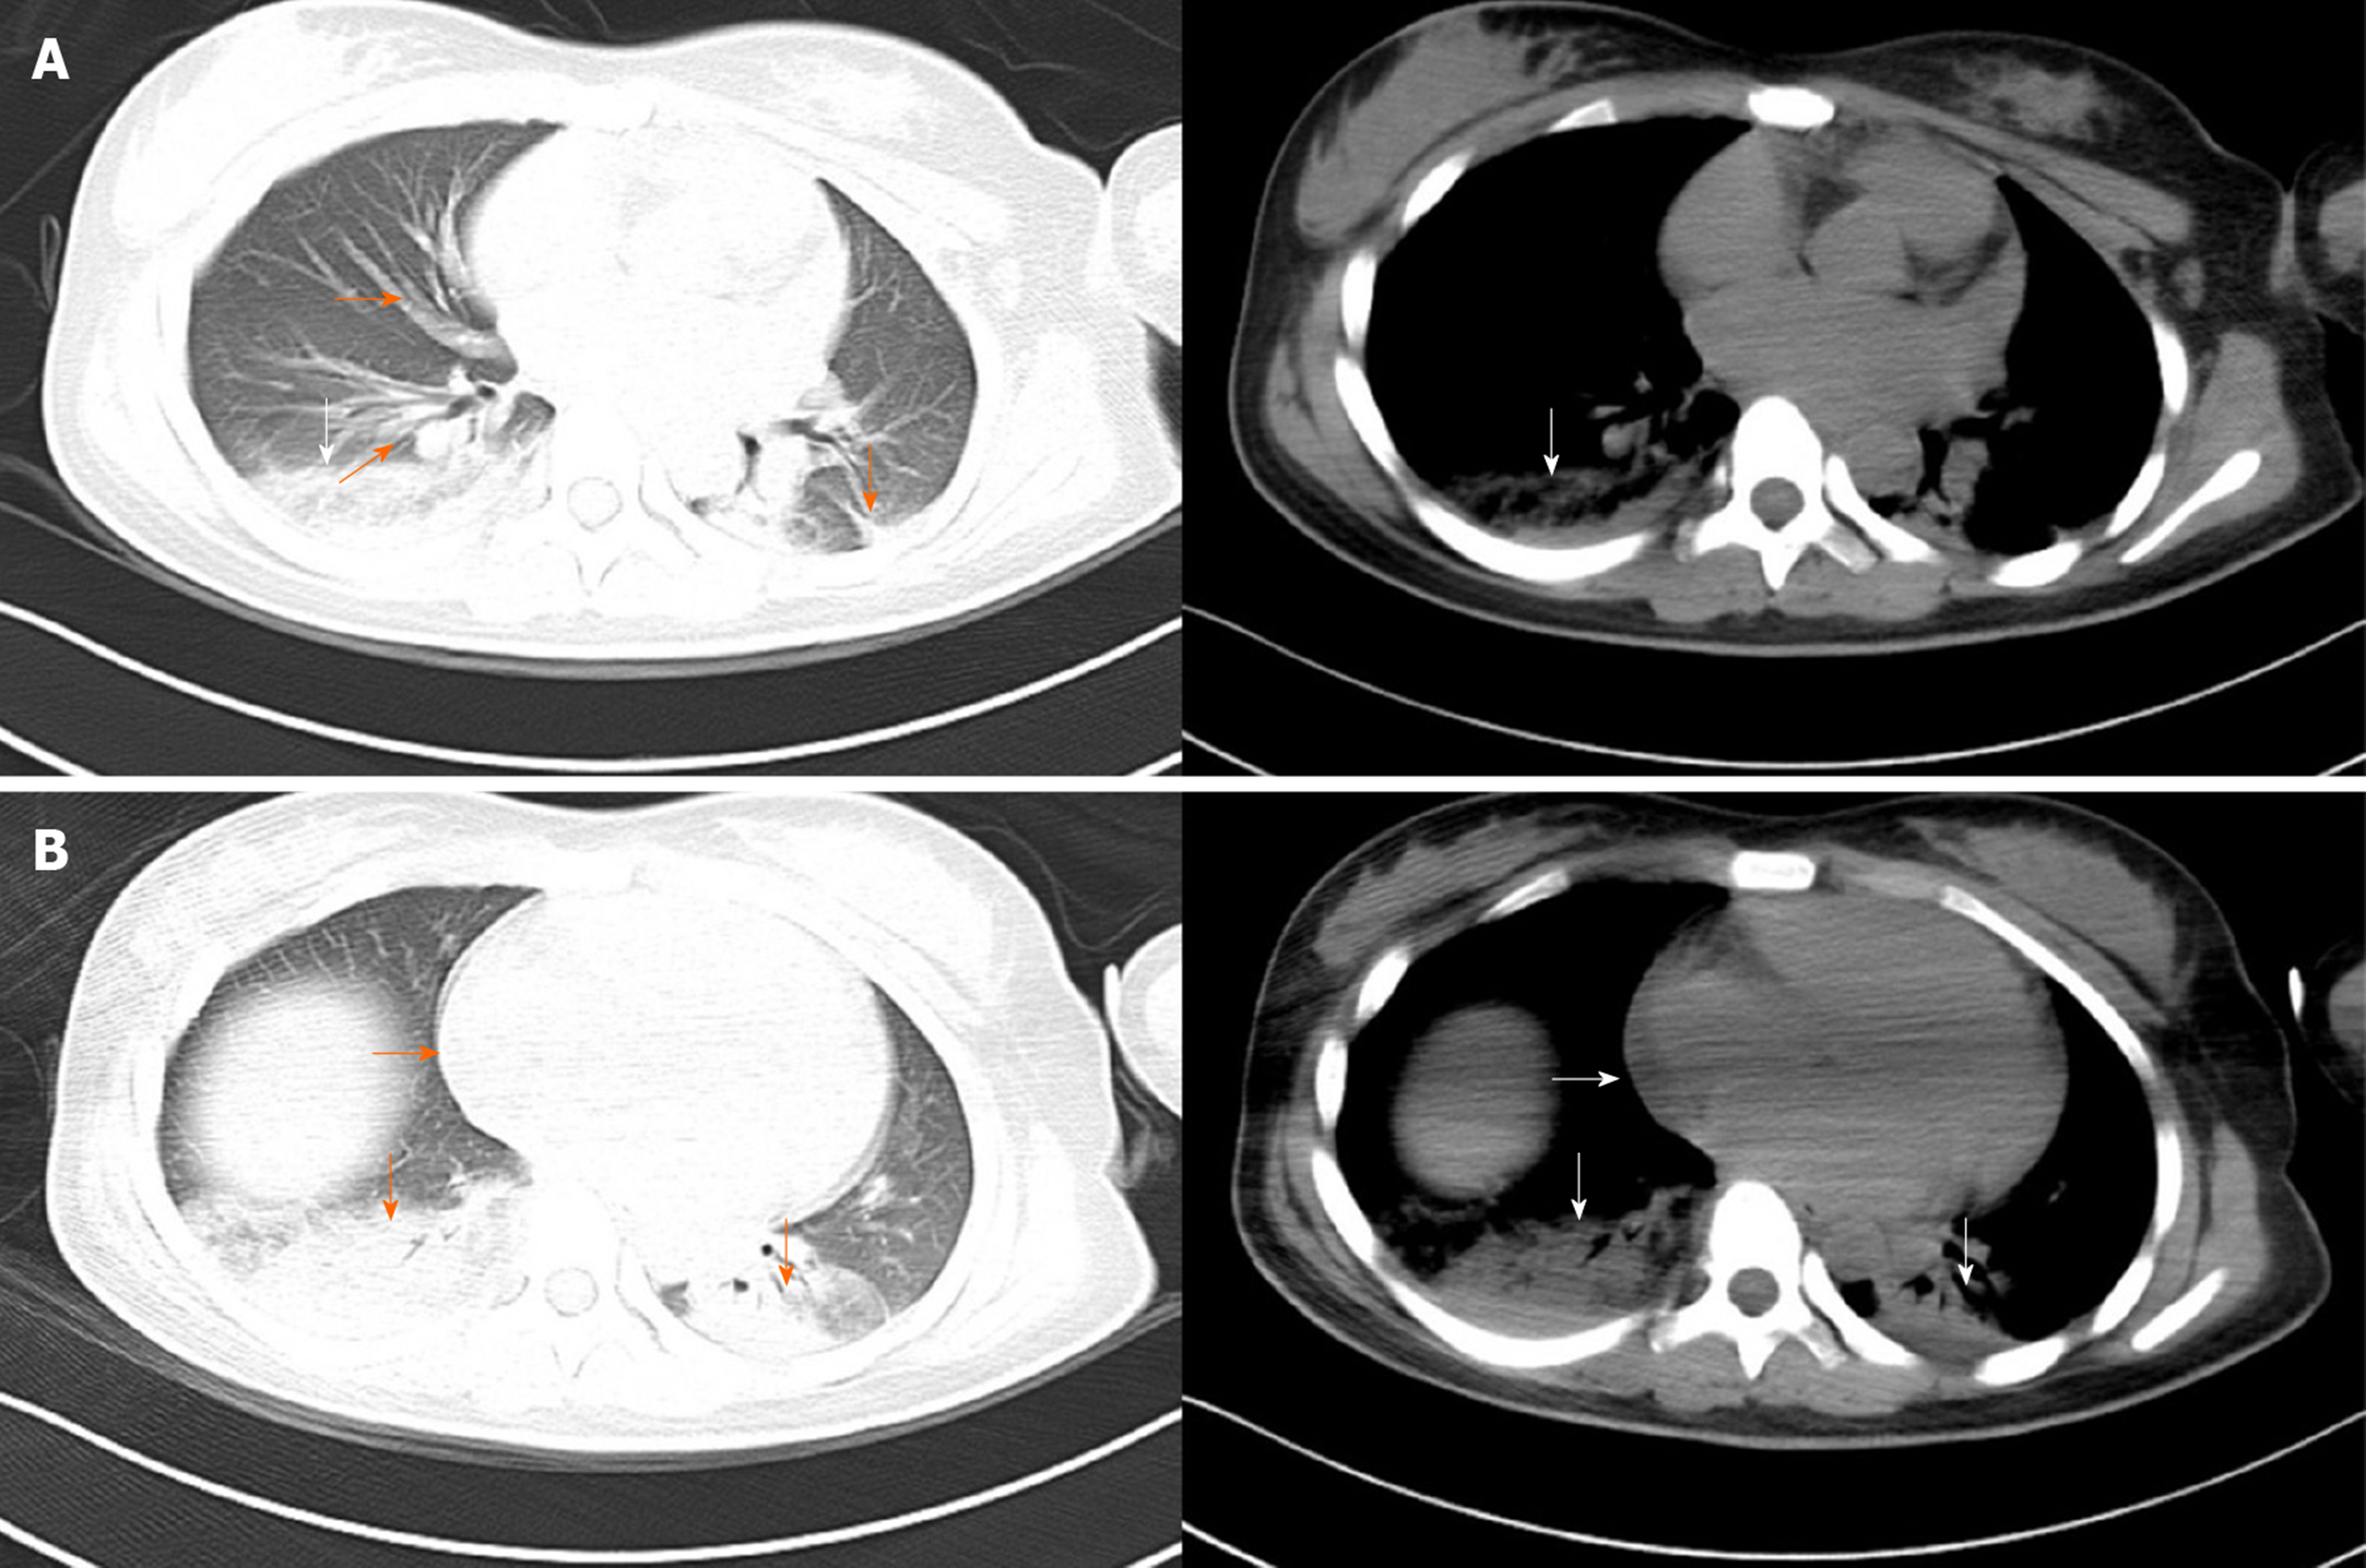
Figure 1 Computed tomography scan of the chest.
A: Image showing increased pulmonary vascular diameter (orange horizontal arrow), ground-glass attenuation (orange oblique arrow), interlobar fissure effusion (orange vertical arrow) and consolidation in the right lower lobe of the lung (white vertical arrow); B: Image showing an enlarged heart (horizontal arrow) and consolidation in both lower lobes of the lung (vertical arrow).
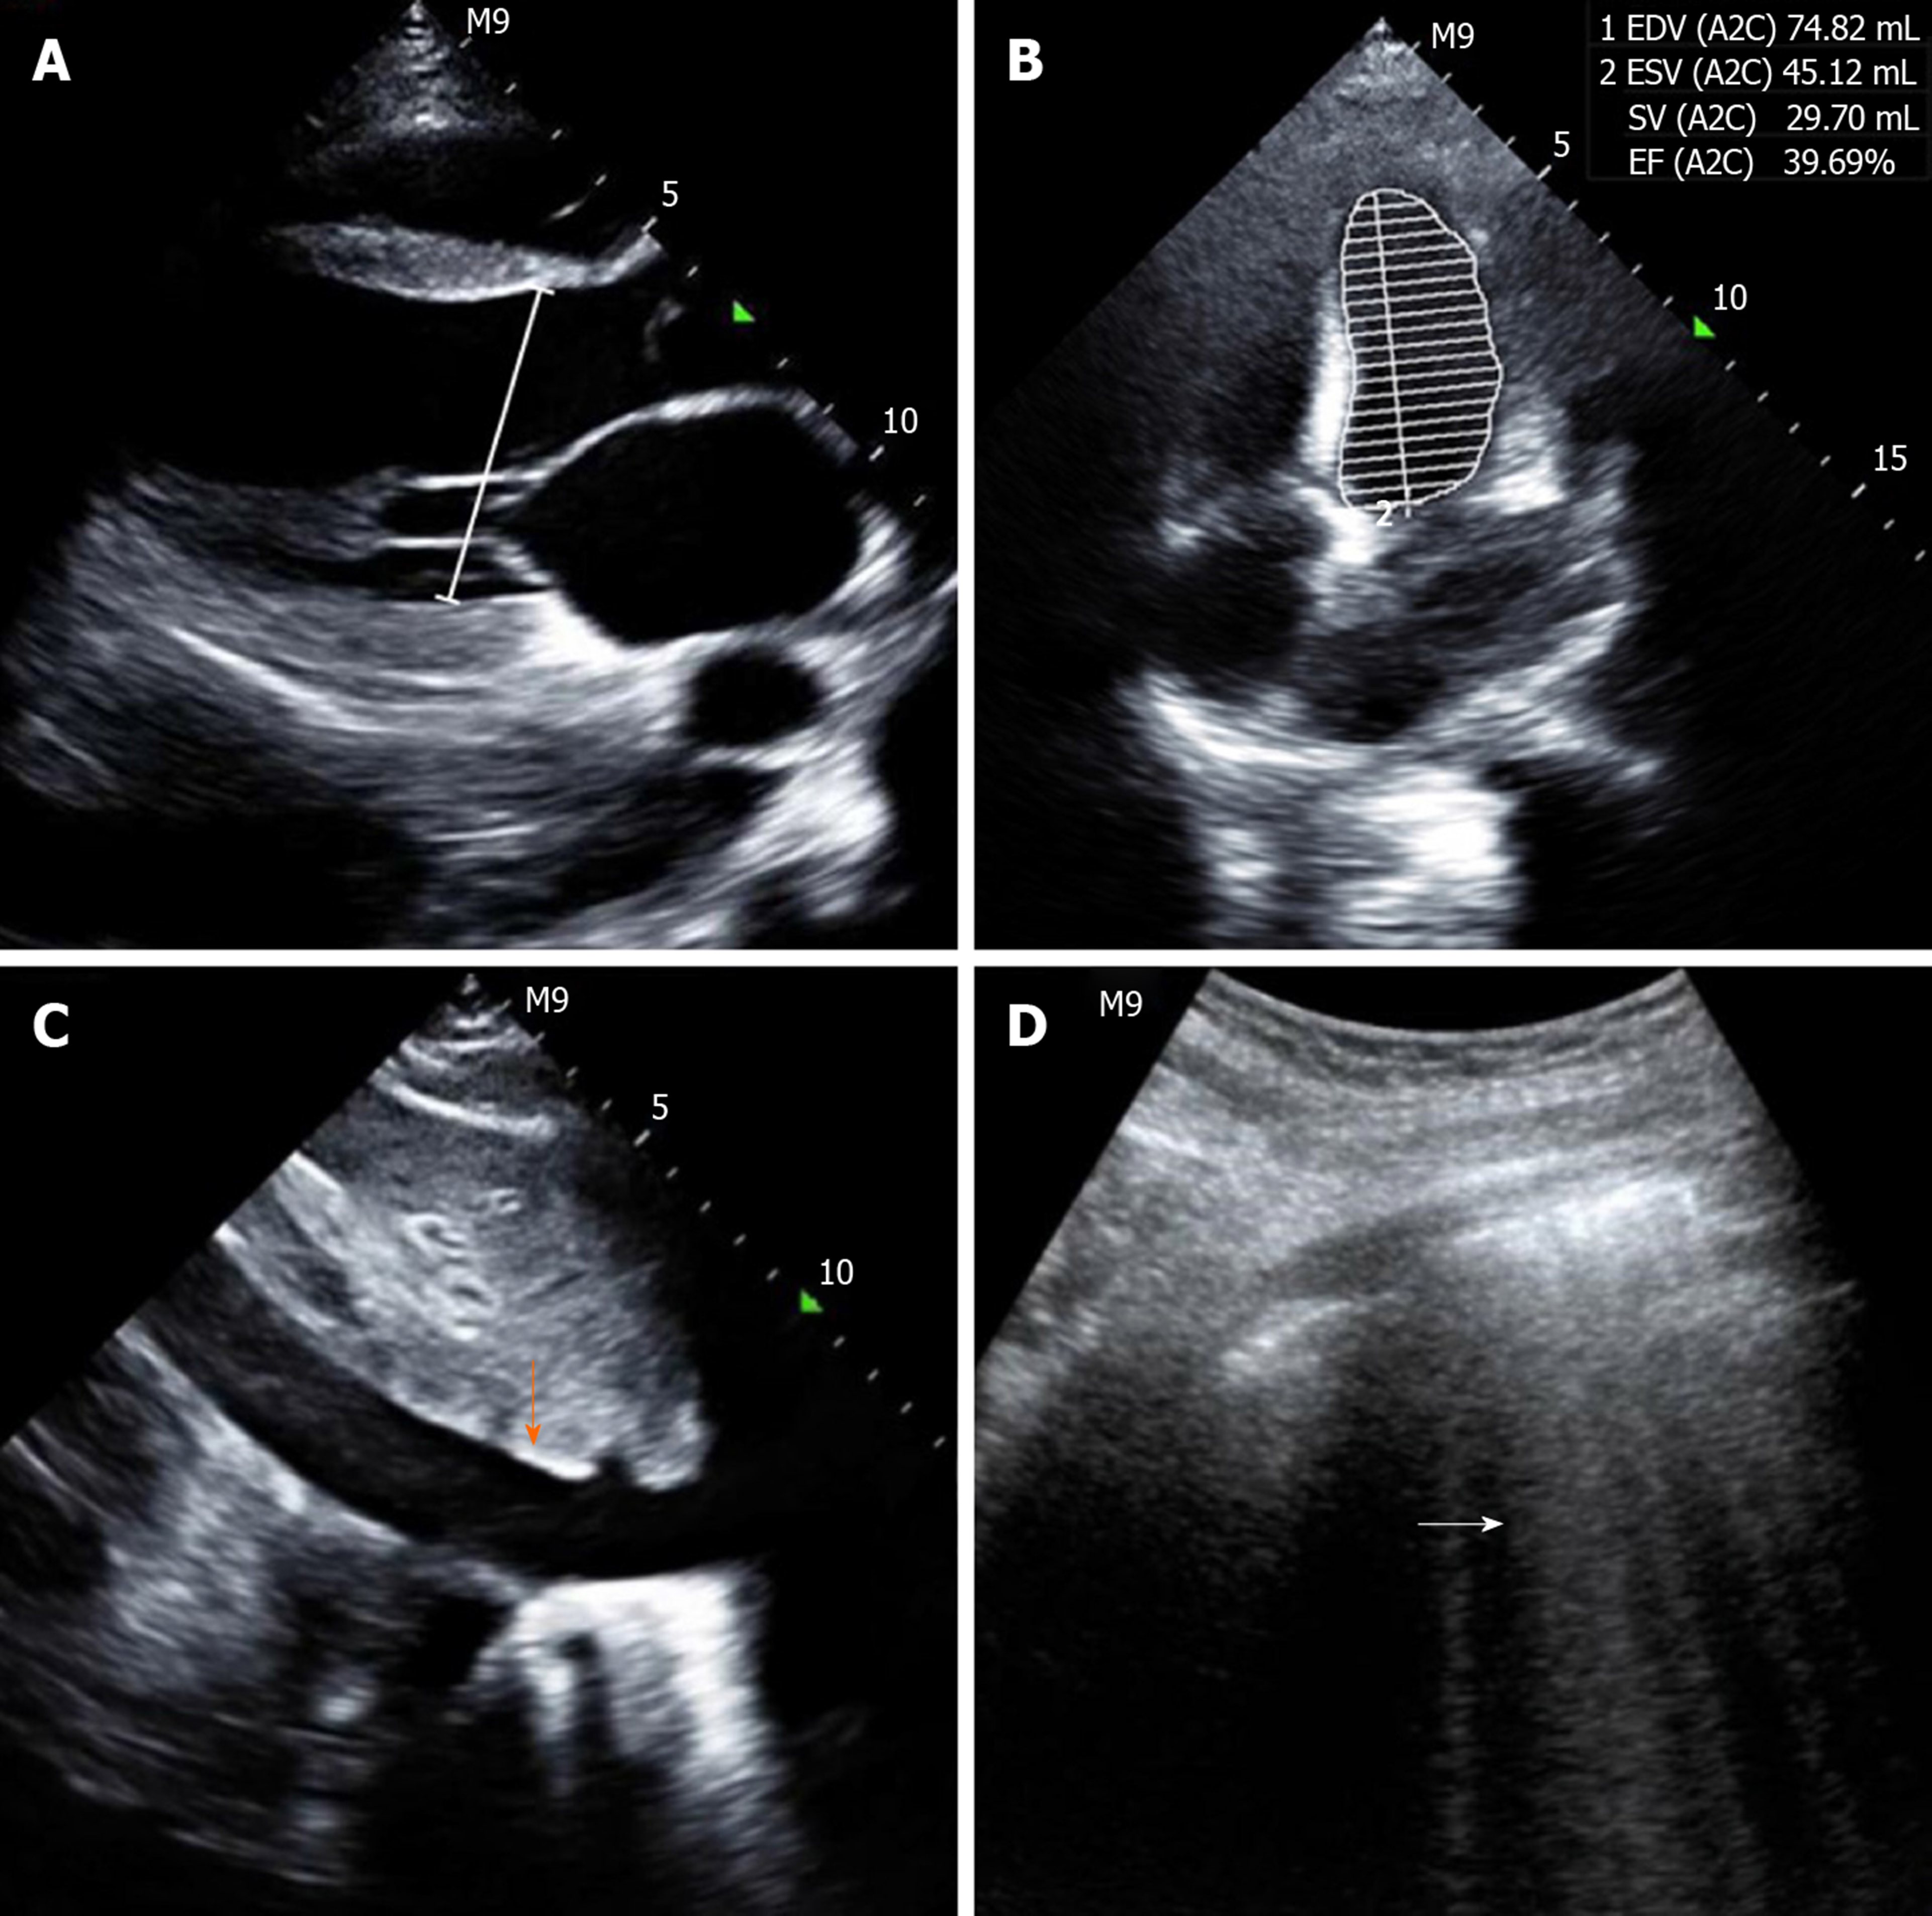
Figure 2 Point-of-care ultrasound before undergoing therapy.
A: Image showing an enlarged heart with a left ventricular end diastolic diameter of 50 mm (white line); B: Image showing a decreased left ventricular ejection fraction of 39.69%; C: Image showing a widened inferior vena cava with a diameter of 22 mm (orange vertical arrow); D: Image showing diffuse B lines in both lung fields (white horizontal arrow).
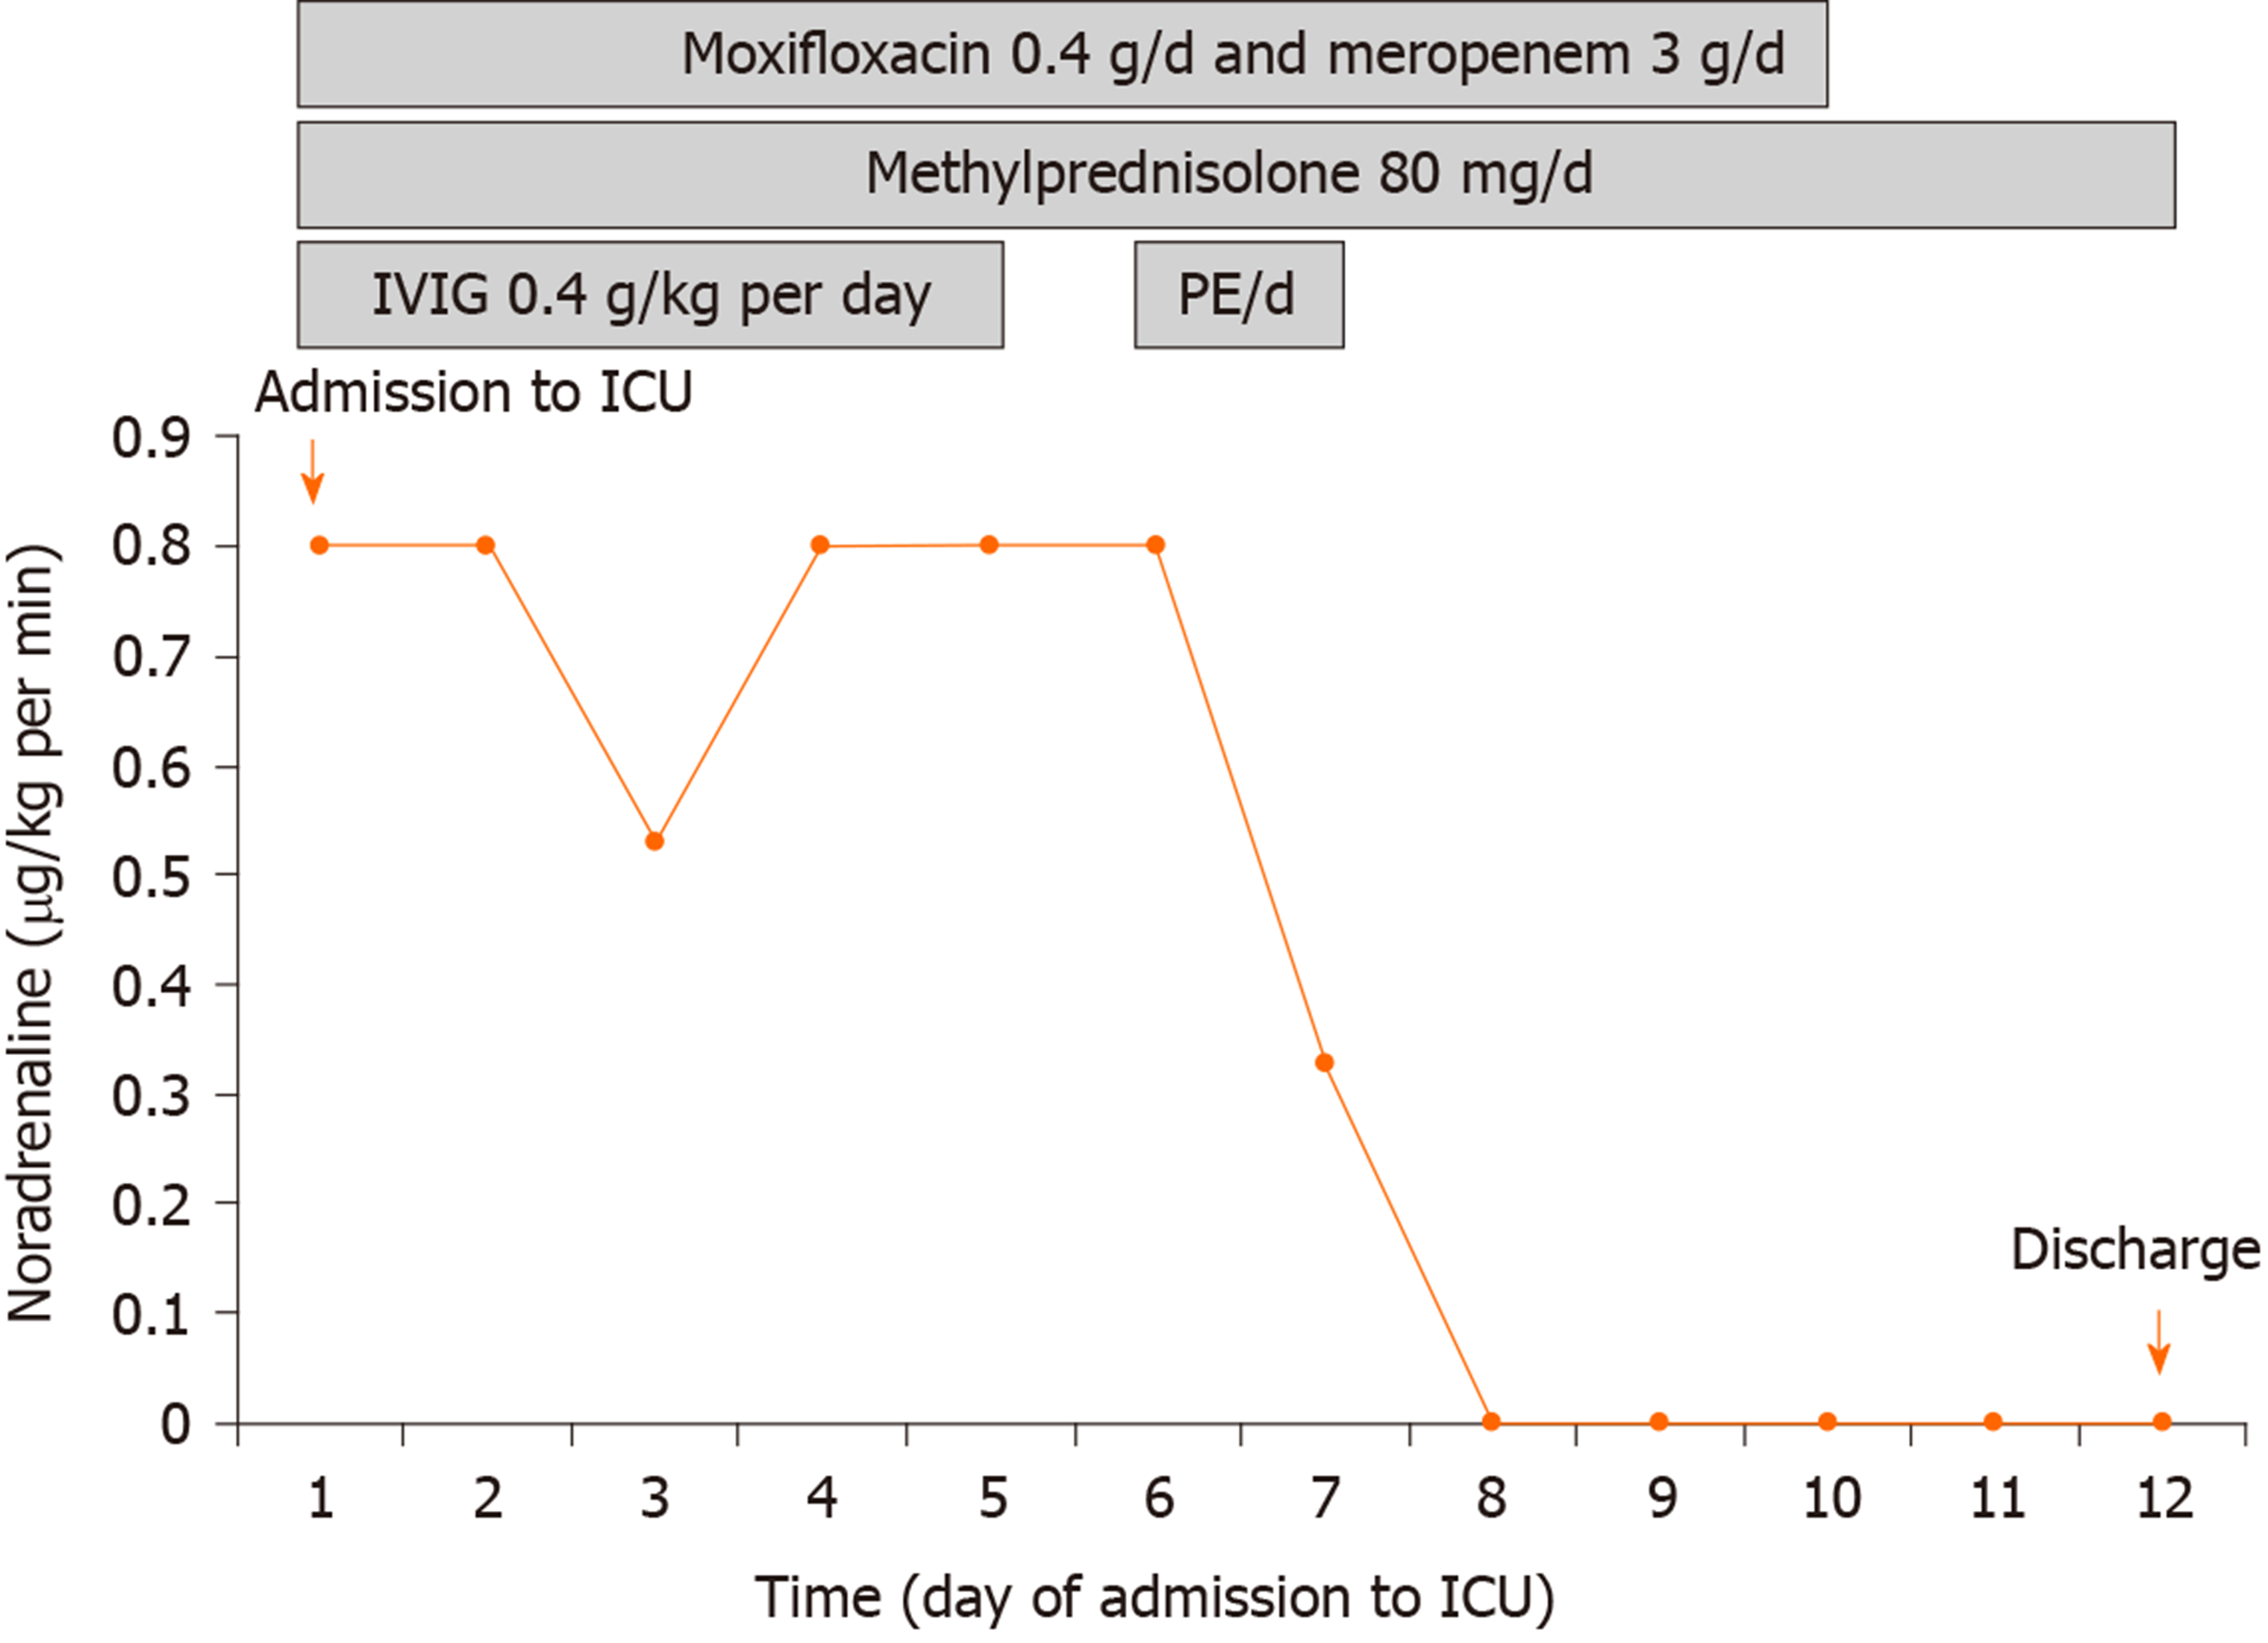
Figure 3 Clinical course and vasopressor doses.
Moxifloxacin and meropenem were prescribed on days 1-10. Methylprednisolone was administered on days 1-12. IVIG was administered on days 1-5. PE was conducted twice on days 6 and 7, respectively. IVIG: Intravenous immunoglobulin; PE: Plasma exchange.
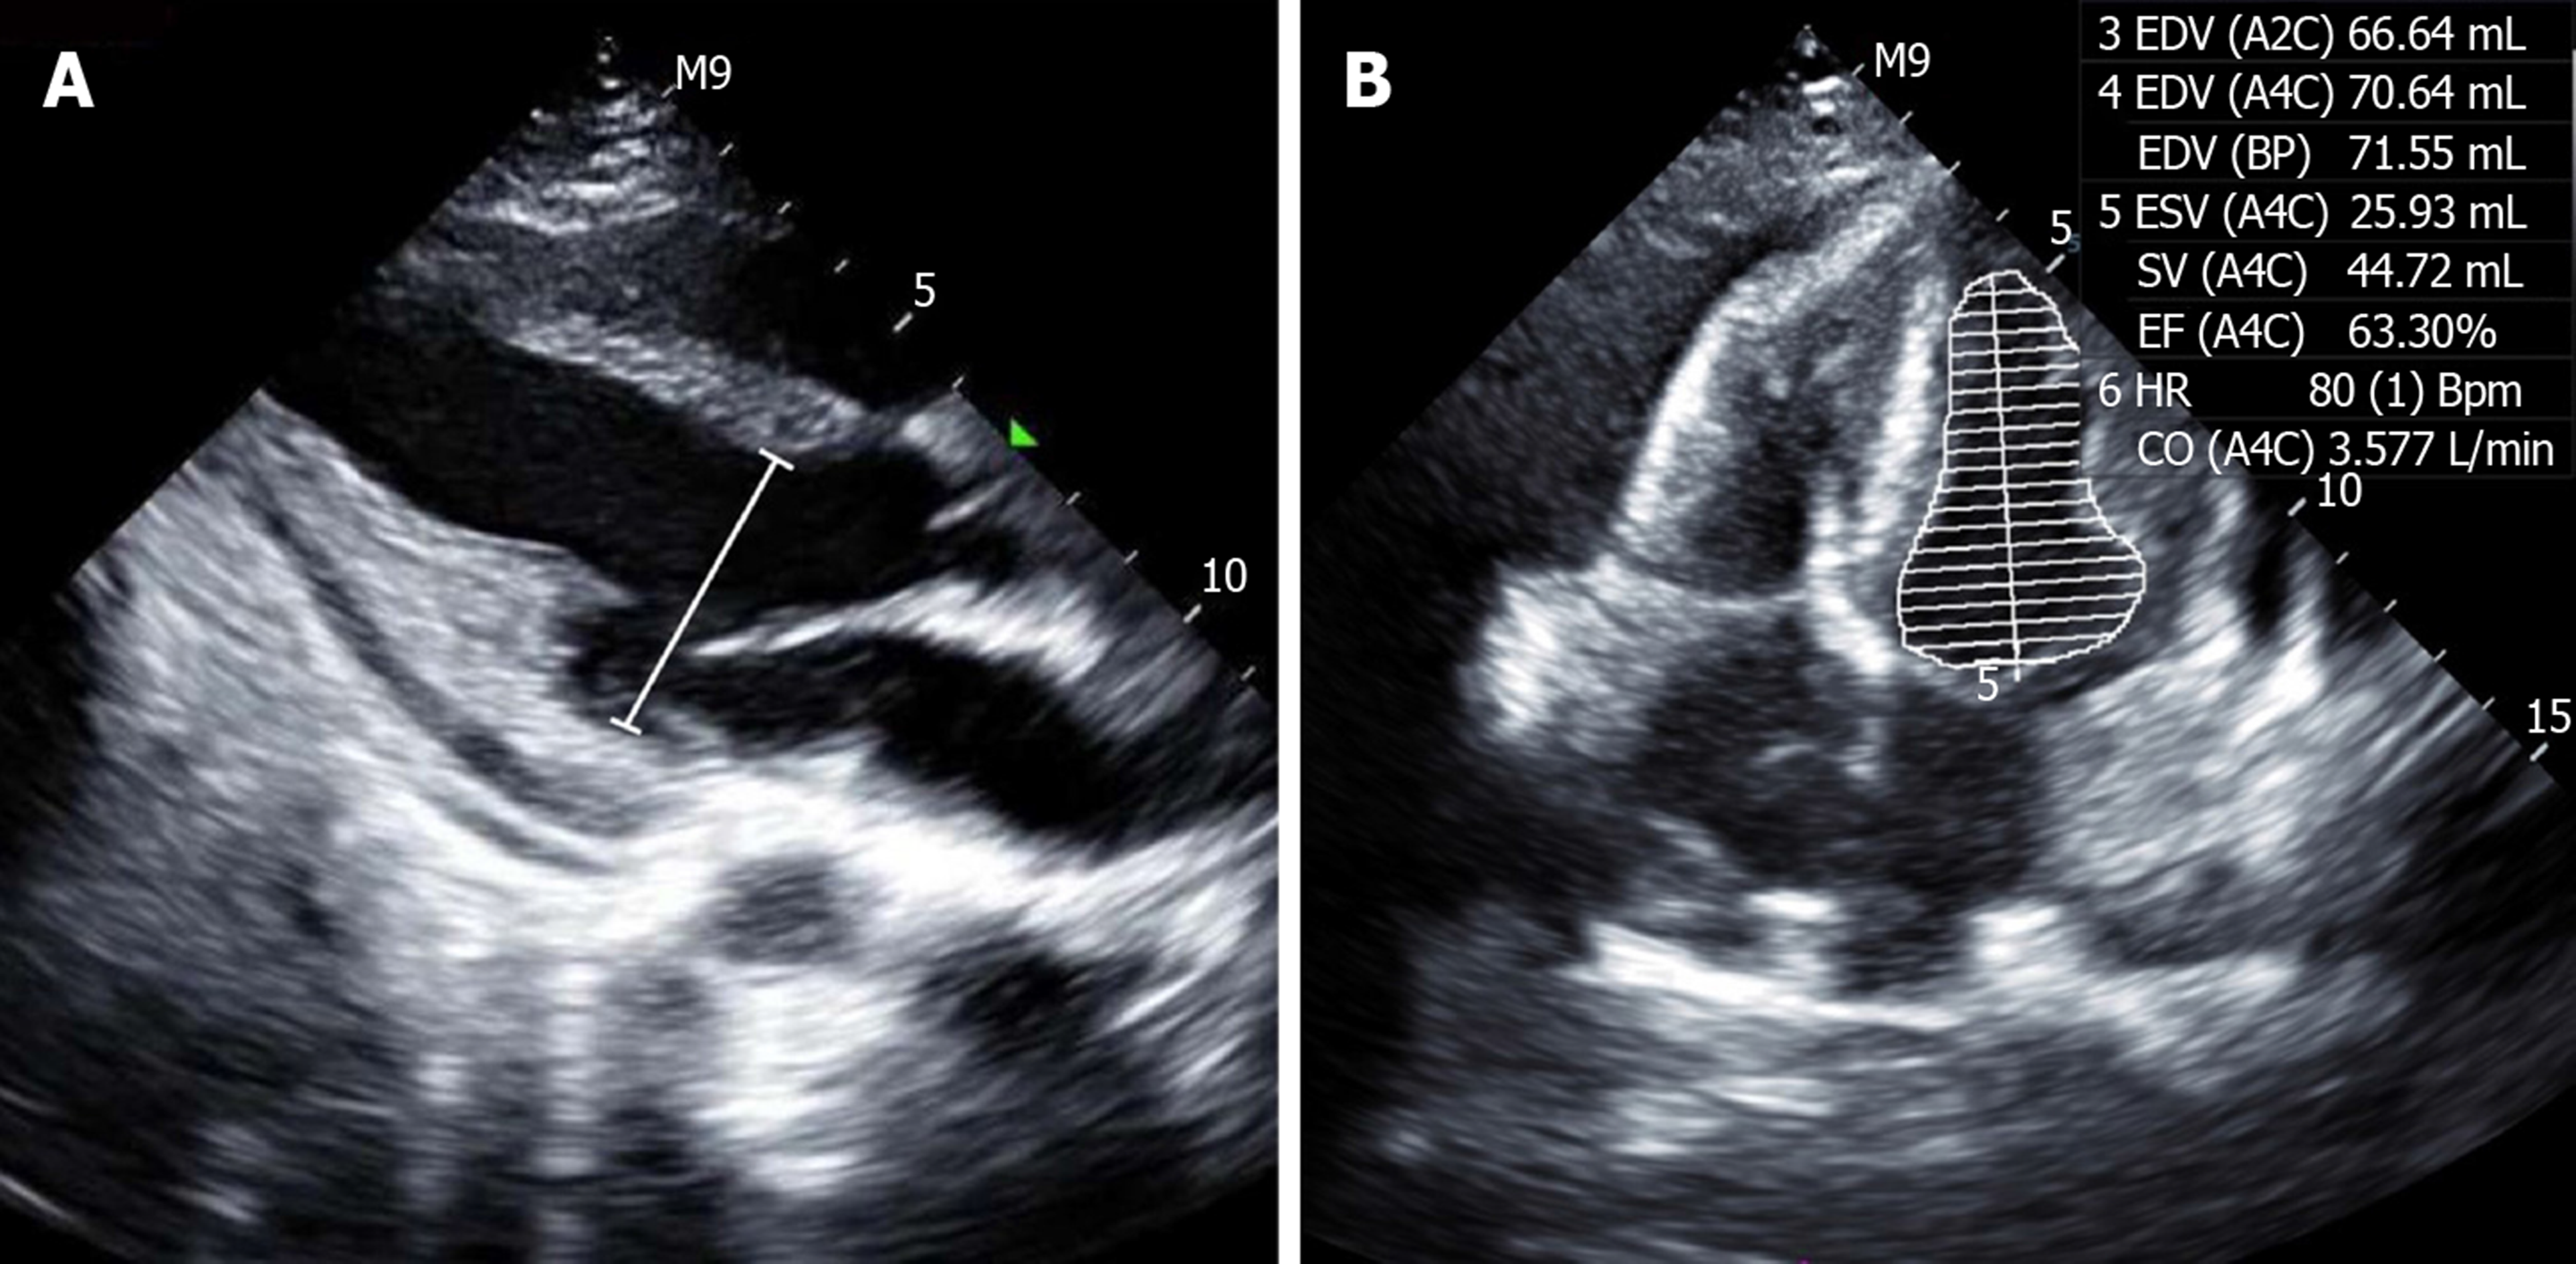
Figure 4 Point-of-care ultrasound after undergoing therapy.
A: Image showing a normal left ventricular end diastolic diameter of 38 mm (white line); B: Image showing a normal left ventricular ejection fraction of 63.3%.
- Citation: Xing ZX, Yu K, Yang H, Liu GY, Chen N, Wang Y, Chen M. Successful use of plasma exchange in fulminant lupus myocarditis coexisting with pneumonia: A case report. World J Clin Cases 2020; 8(10): 2056-2065
- URL: https://www.wjgnet.com/2307-8960/full/v8/i10/2056.htm
- DOI: https://dx.doi.org/10.12998/wjcc.v8.i10.2056


