Copyright
©The Author(s) 2020.
World J Clin Cases. May 26, 2020; 8(10): 1988-1994
Published online May 26, 2020. doi: 10.12998/wjcc.v8.i10.1988
Published online May 26, 2020. doi: 10.12998/wjcc.v8.i10.1988
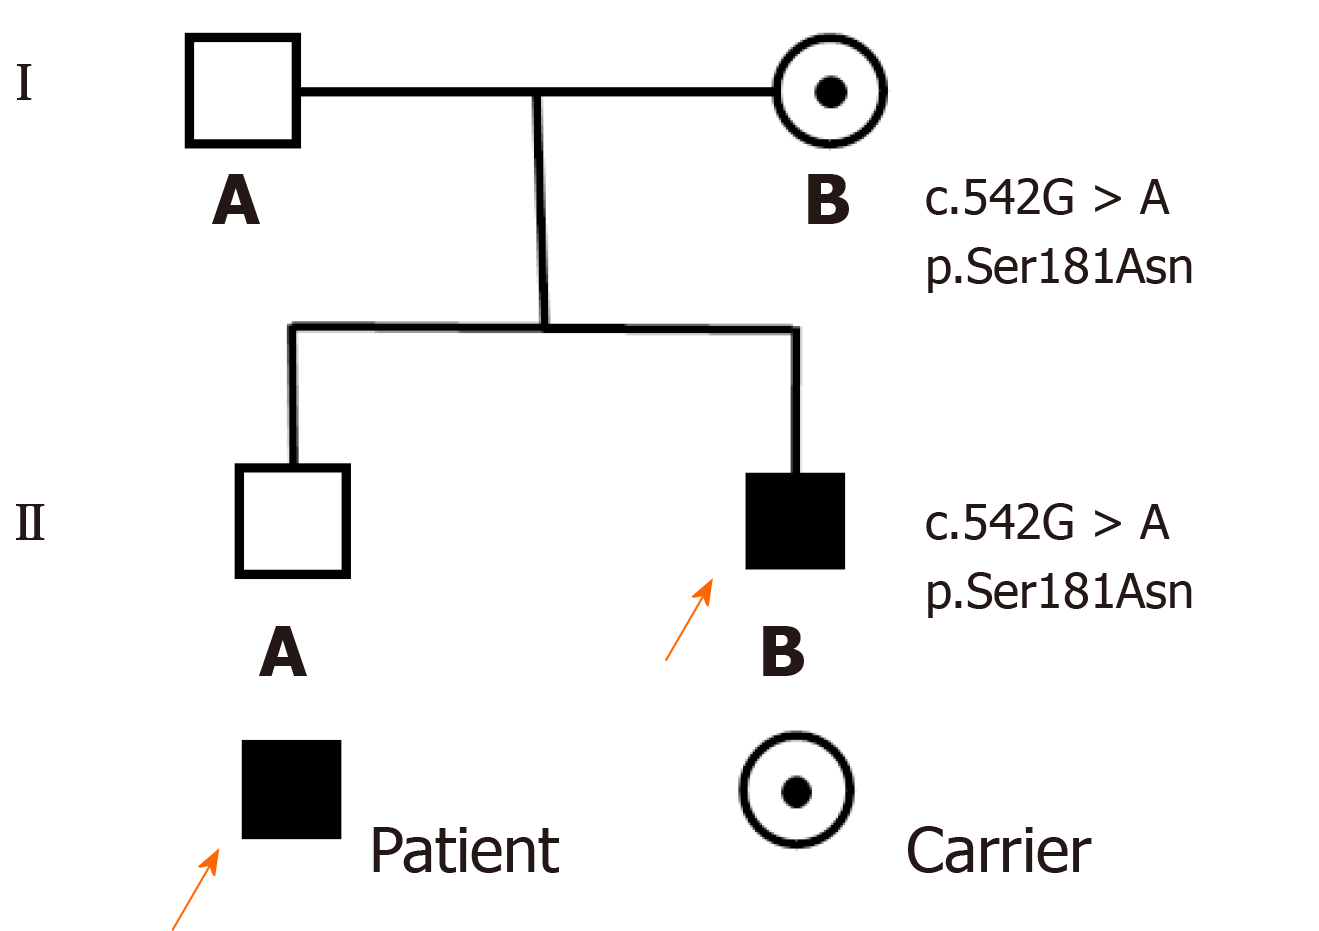
Figure 1 Family pedigree.
The black square and arrow indicate the patient, the point inside the circle indicates a heterozygous carrier of the gene, and white squares represent normal members in the family.
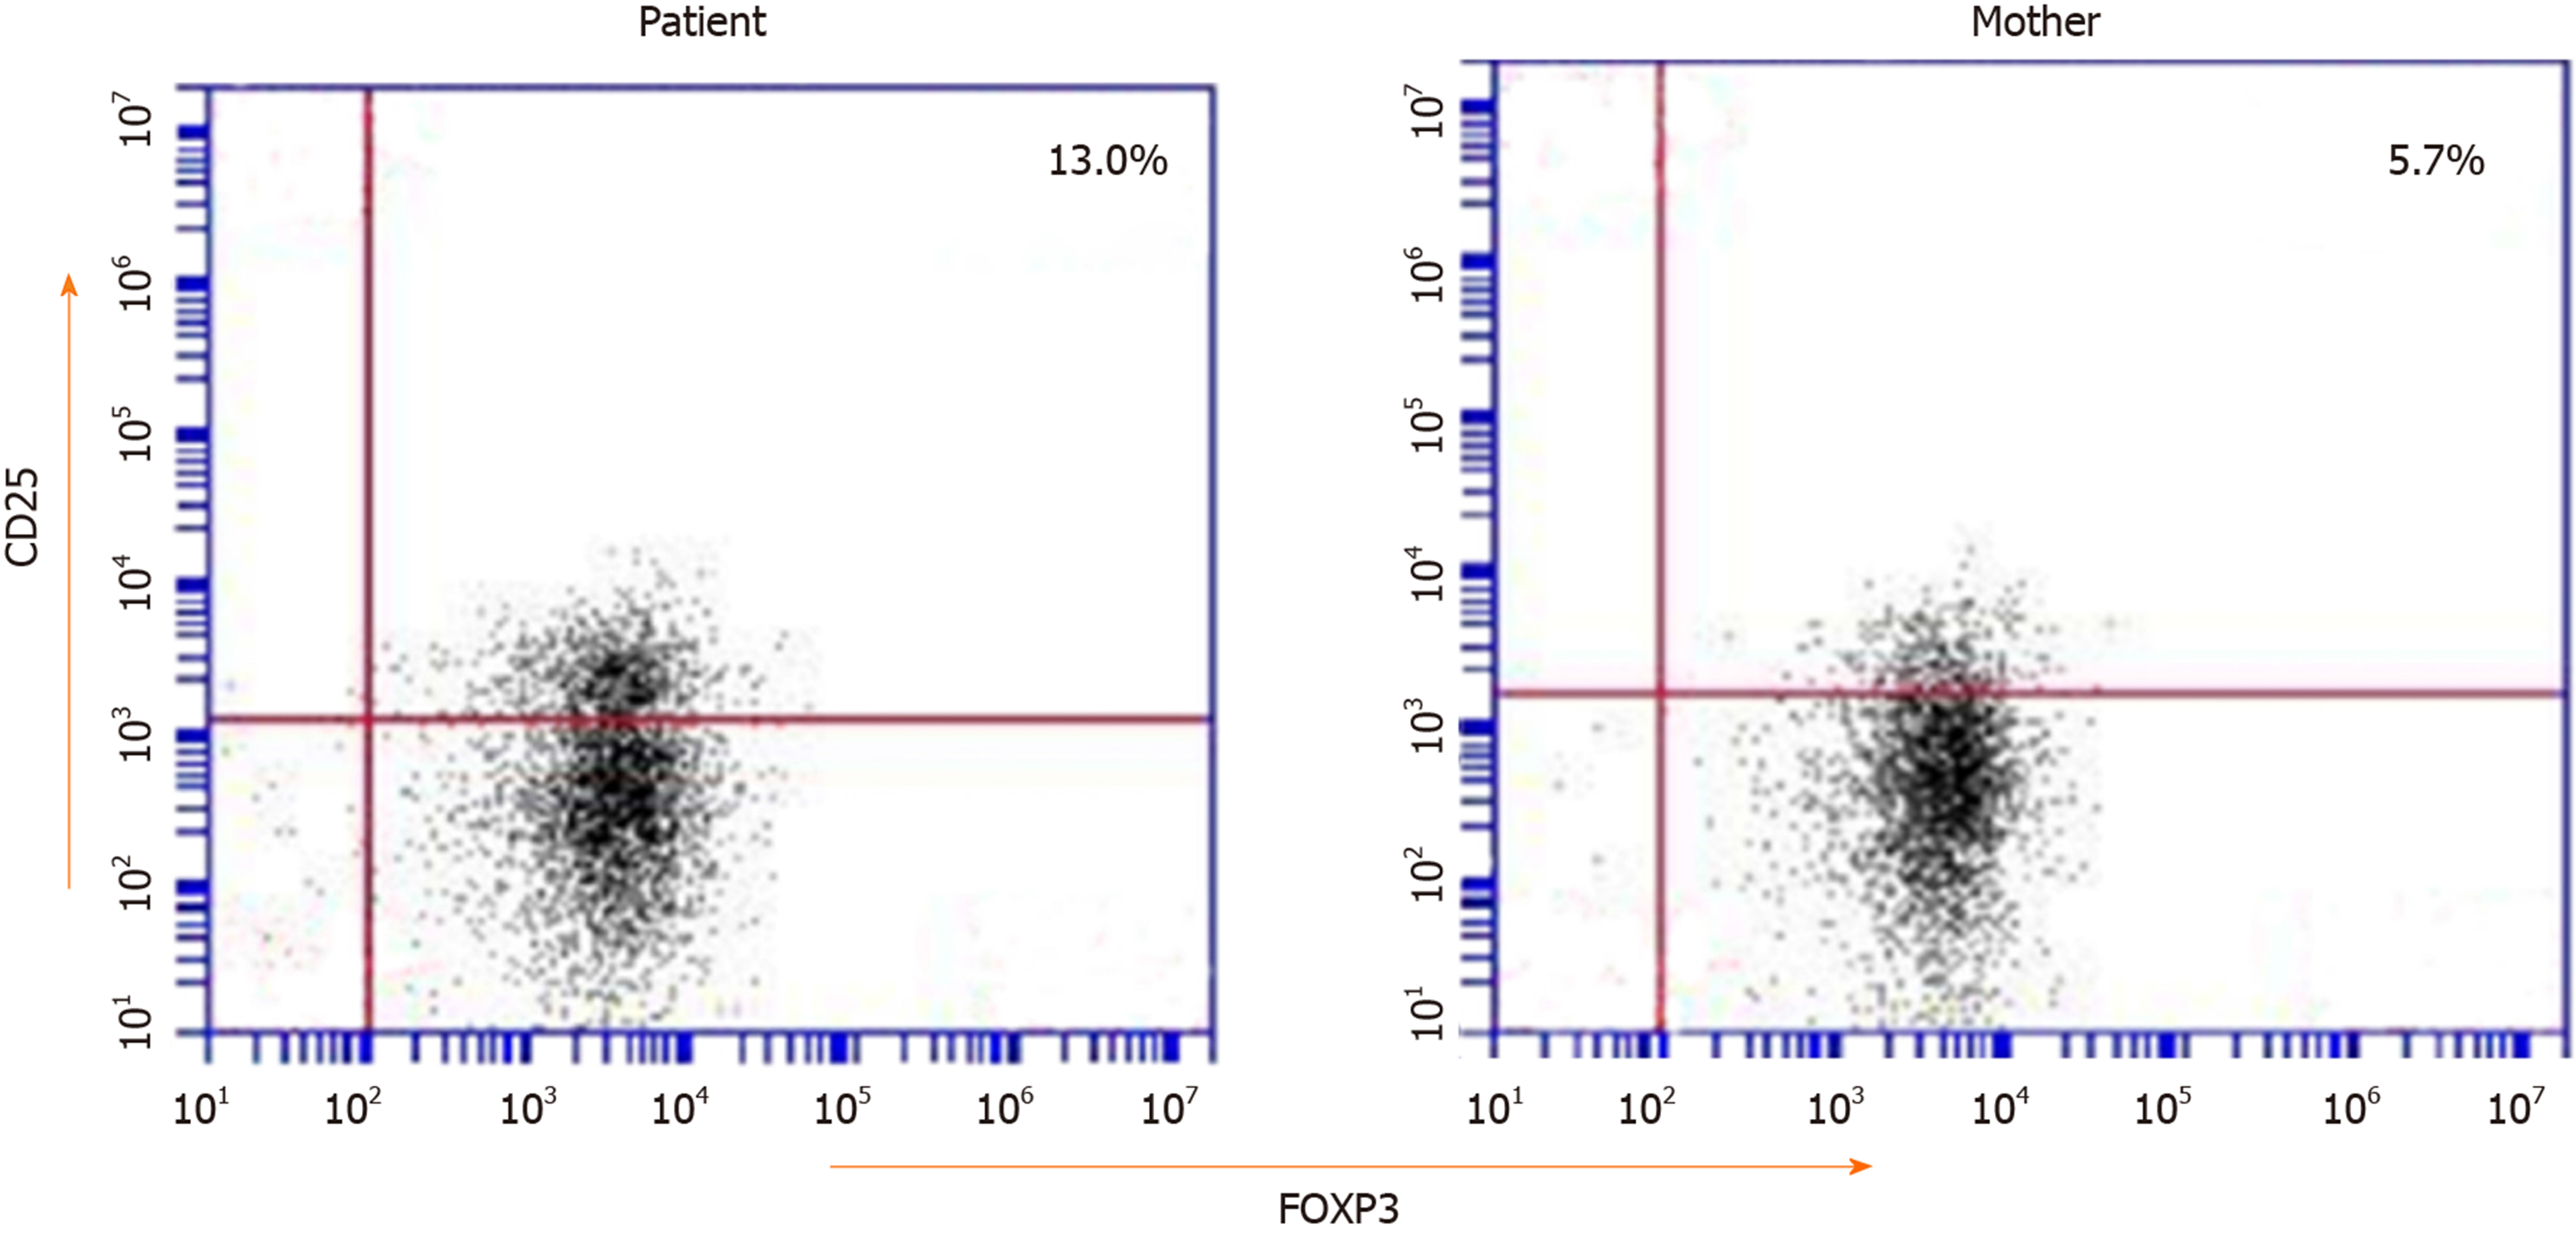
Figure 2 Flow cytometry showing CD25+FOXP3+ regulatory cells in the CD4+T cell population in peripheral blood.
The red number in each quadrant indicates the percentage of the individual. The percentages of CD25+FOXP3+T cells of the patient and his mother were not reducing (reference range 5.1%-12.7%).
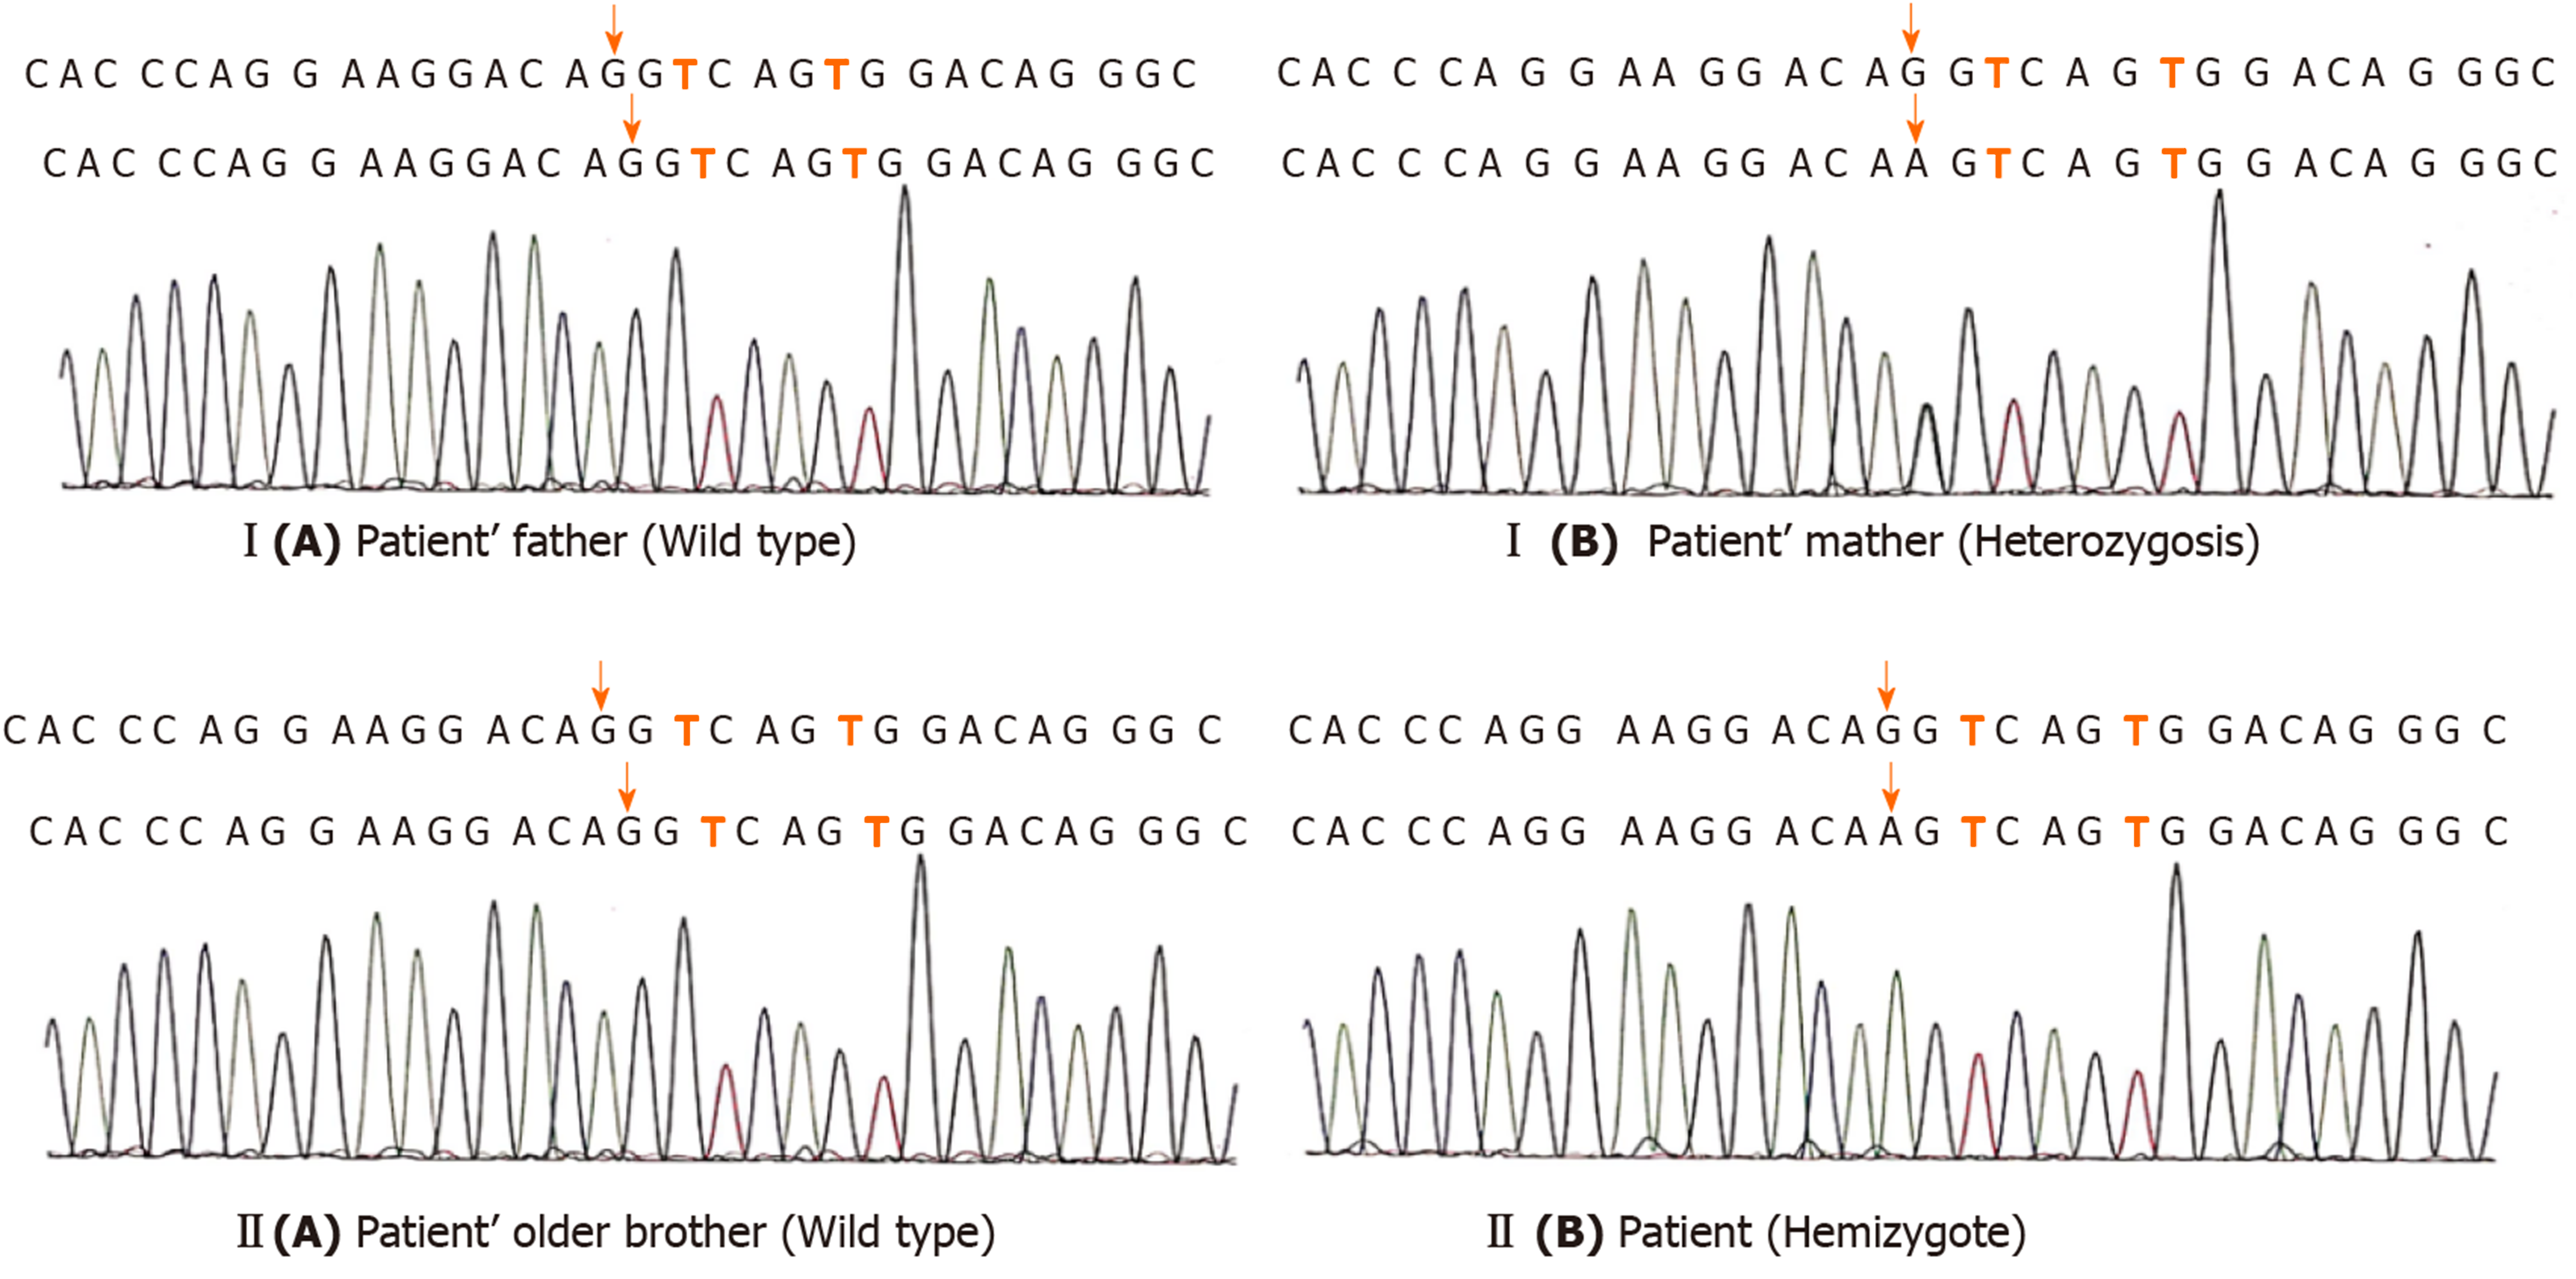
Figure 3 The gene sequencing peaks of the two-generation family.
I (A) and II (A) indicate that no mutation was found; I (B) and II (B) indicate that the mutation site is c.542G> A.
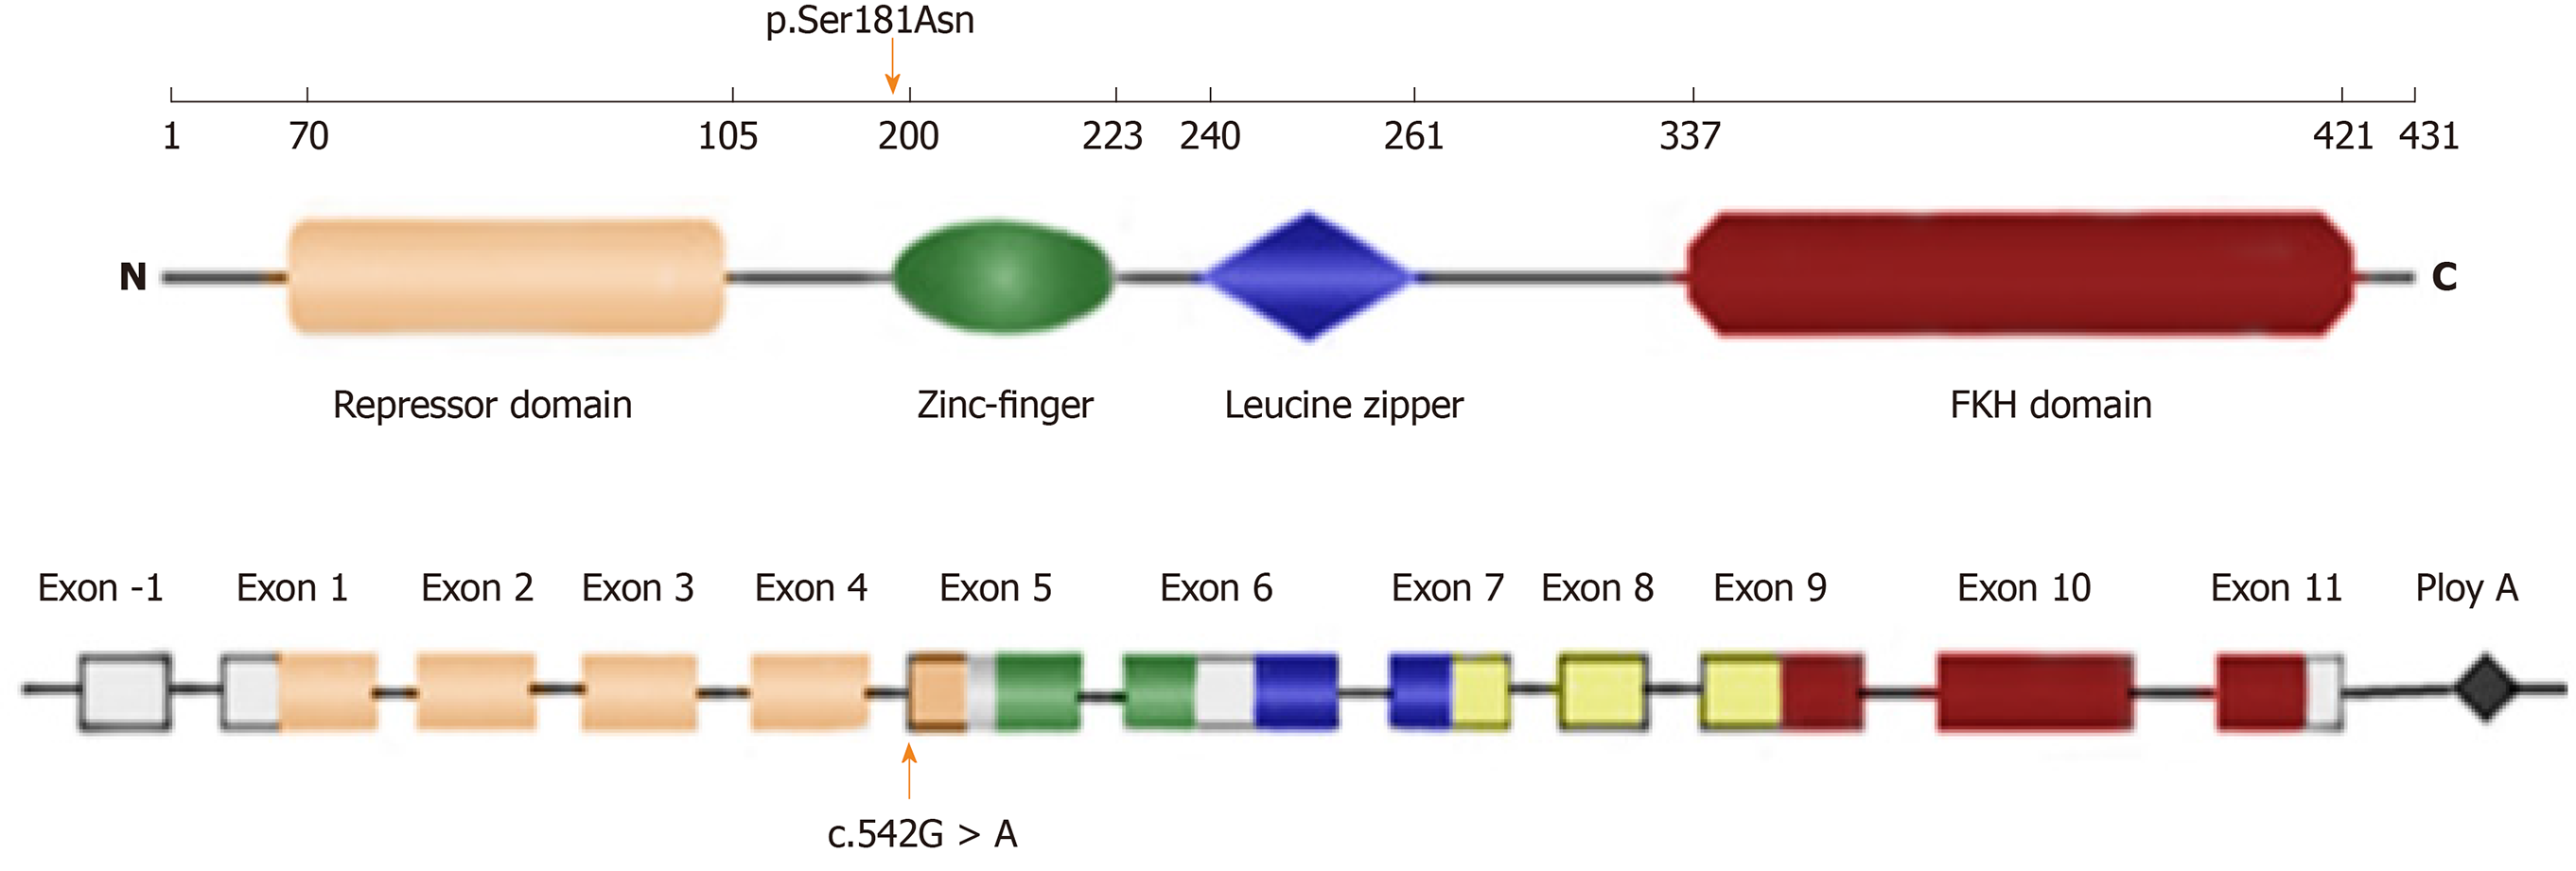
Figure 4 Schematic representation of the FOXP3 gene and protein.
Numbers along the top line indicate amino acid number (1–431). The latter two lines refer to the gene structure, the coding and non-coding regions: N-terminal domain (orange), zinc-finger (ZF) domain (green), leucine-zipper (LZ) domain (blue), LZ-FKH loop (yellow), and FKH domain (red). The orange arrows indicate the mutation site identified in this study.
- Citation: Su N, Chen C, Zhou X, Ma GD, Chen RL, Tian C. Early-onset refractory diarrhea due to immune dysregulation, polyendocrinopathy, enteropathy, X-linked syndrome associated with a novel mutation in the FOXP3 gene: A case report. World J Clin Cases 2020; 8(10): 1988-1994
- URL: https://www.wjgnet.com/2307-8960/full/v8/i10/1988.htm
- DOI: https://dx.doi.org/10.12998/wjcc.v8.i10.1988


