Copyright
©The Author(s) 2020.
World J Clin Cases. May 26, 2020; 8(10): 1916-1922
Published online May 26, 2020. doi: 10.12998/wjcc.v8.i10.1916
Published online May 26, 2020. doi: 10.12998/wjcc.v8.i10.1916
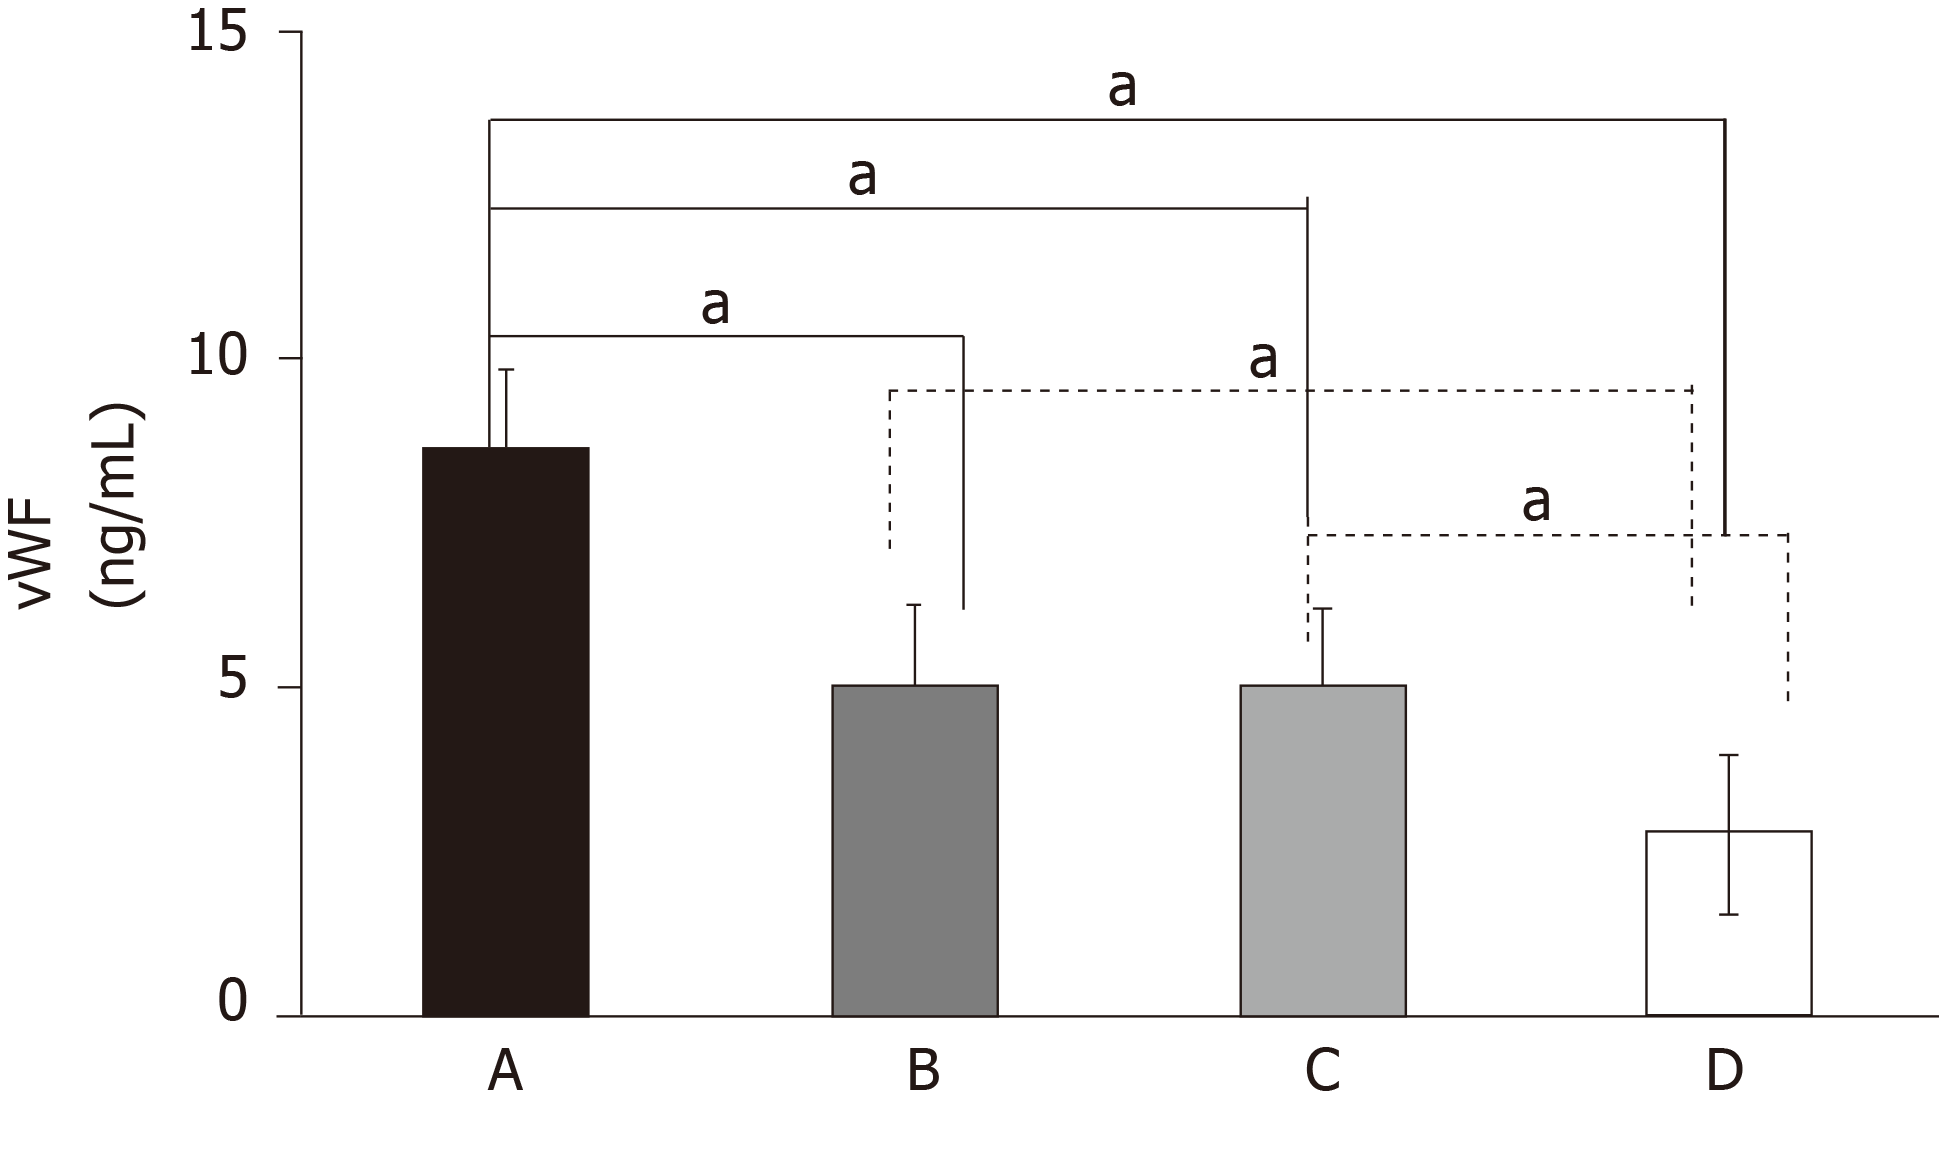
Figure 1 Serum von Willebrand factor (ng/mL) concentrations in different groups of subjects.
A: Type 2 diabetes mellitus + adenocarcinoma in situ group (n = 43); B: Type 2 diabetes mellitus group (n = 43); C: Adenocarcinoma in situ group (n = 43); D: Control group (n = 43). aP < 0.01. vWF: von Willebrand factor.
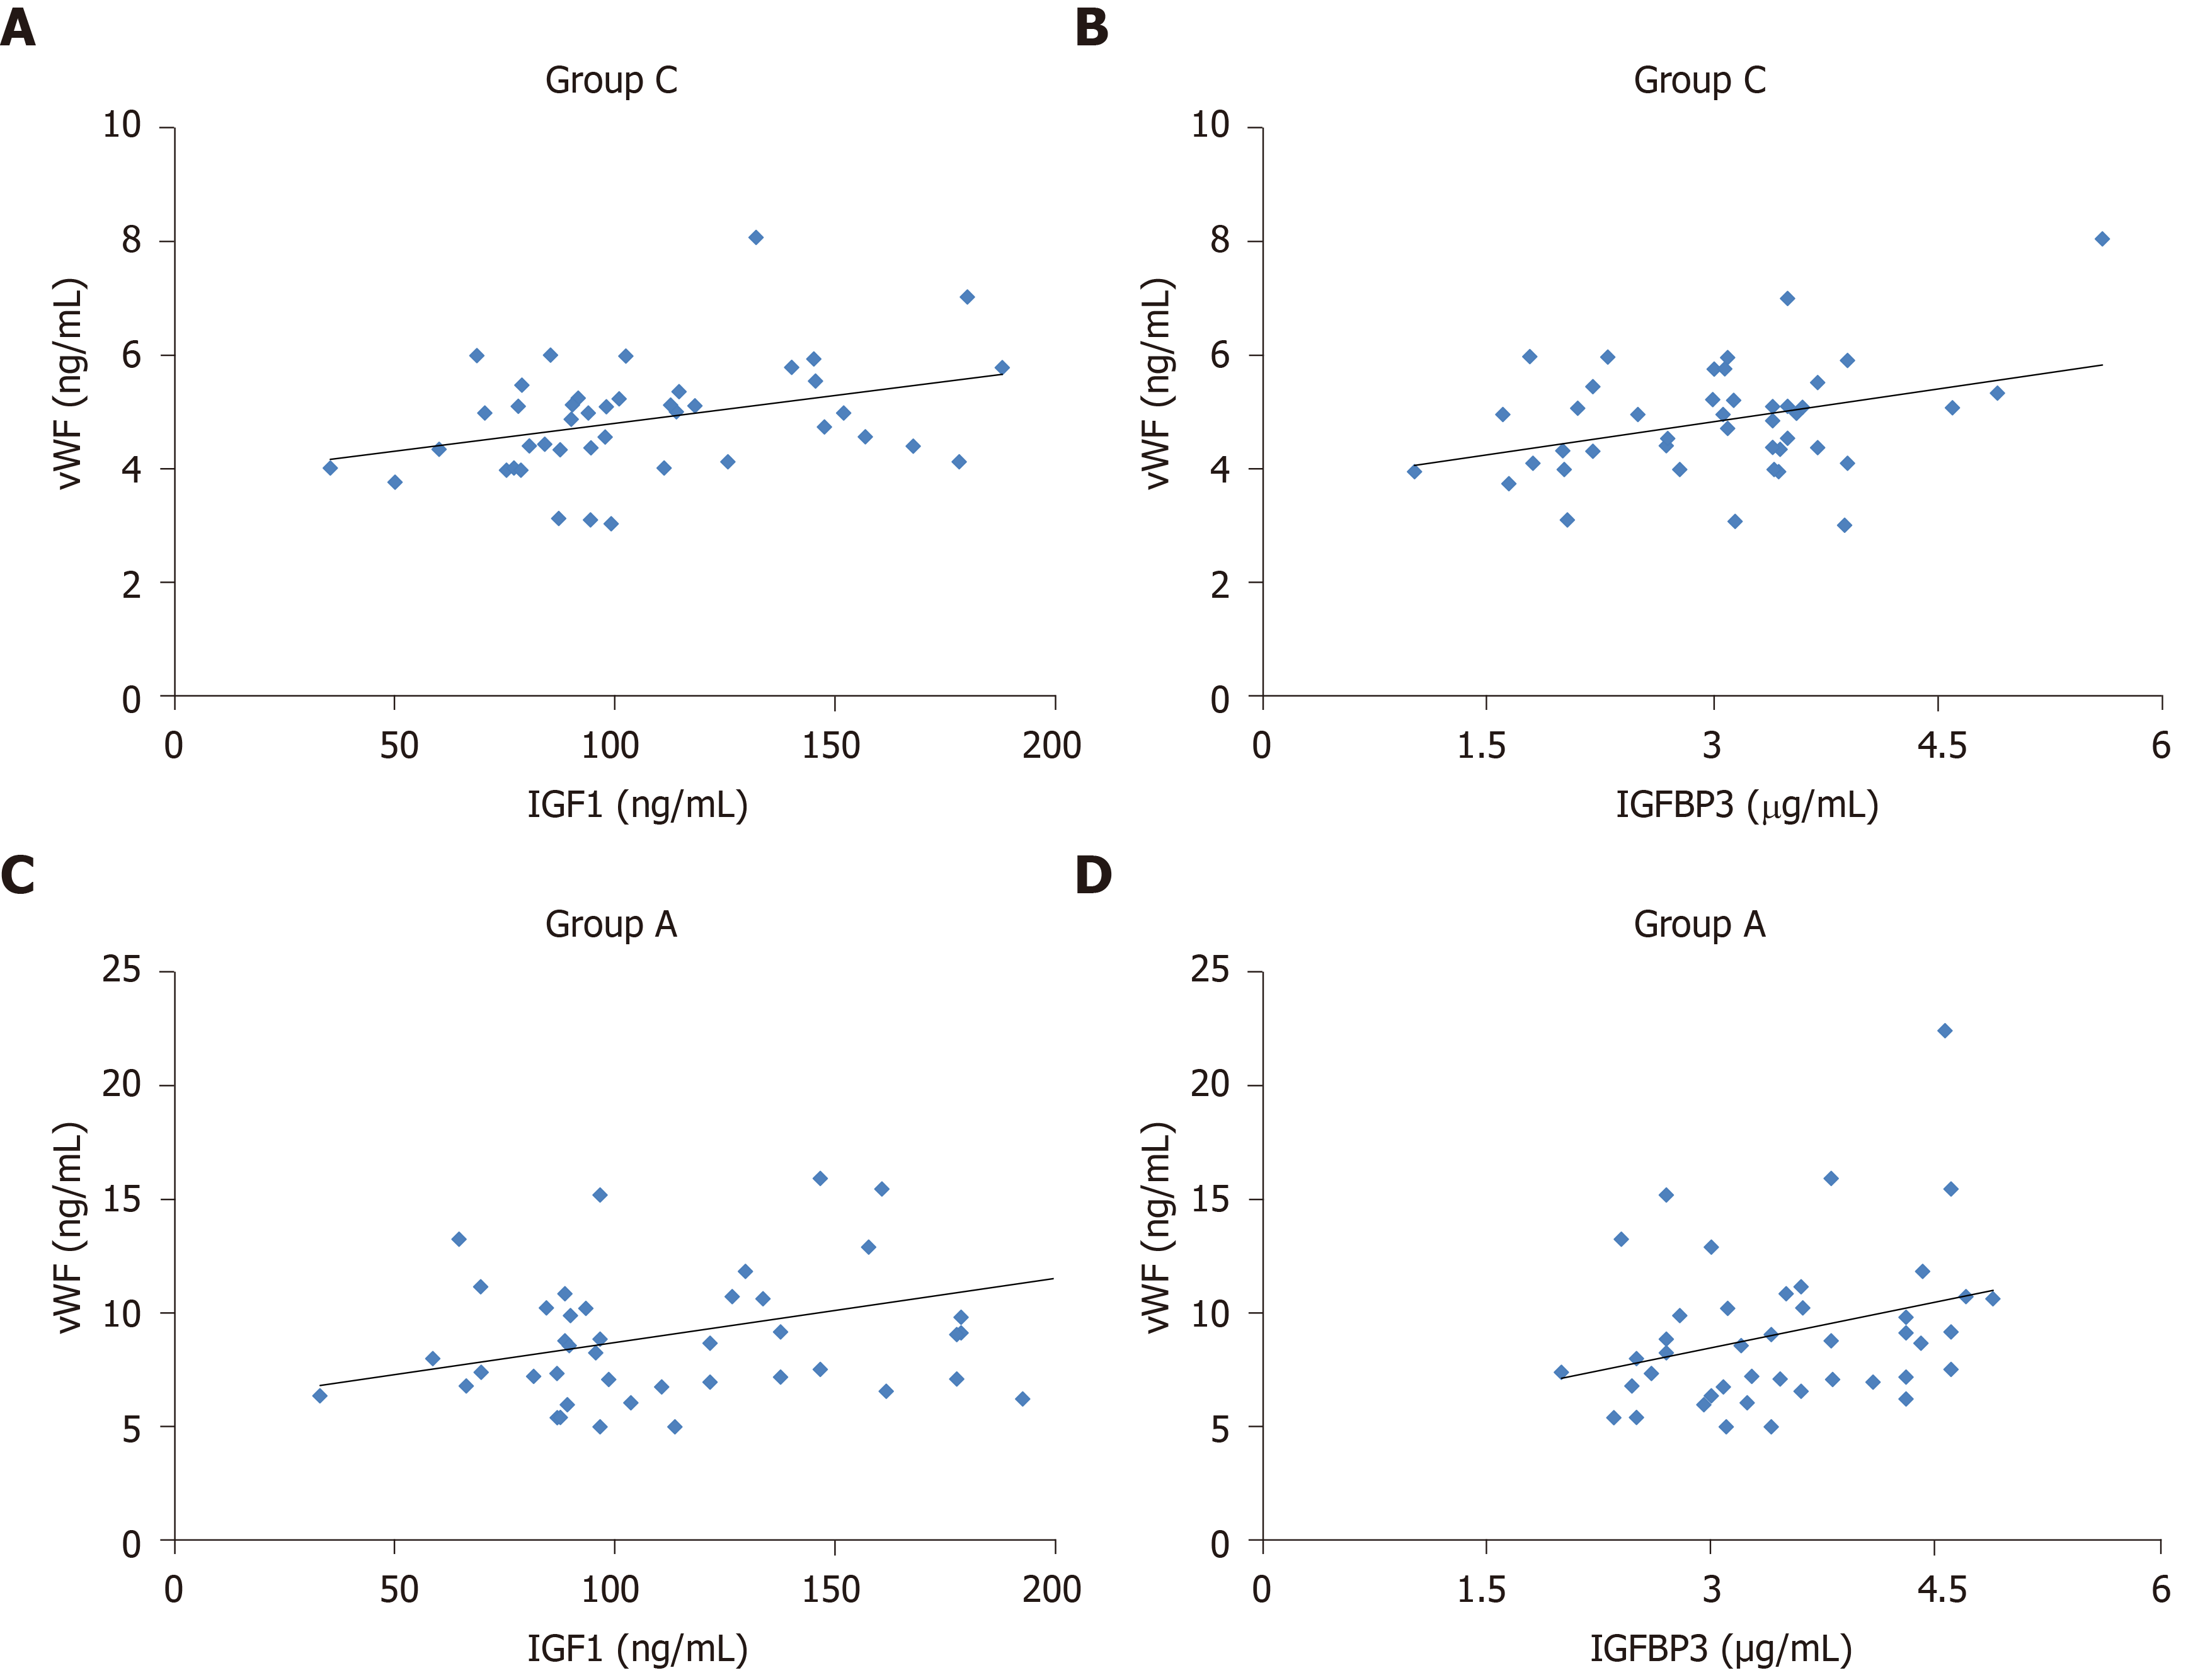
Figure 2 Correlation of serum von Willebrand factor with clinical indicators by multiple linear stepwise regression analysis.
A: Correlation between serum von Willebrand factor and insulin-like growth factor 1; B: Serum von Willebrand factor and insulin-like growth factor binding protein 3 in the adenocarcinoma in situ group; C: Correlation between serum von Willebrand factor and insulin-like growth factor 1; D: Serum von Willebrand factor and insulin-like growth factor binding protein 3 in the type 2 diabetes mellitus + adenocarcinoma in situ group. IGF-1: Insulin-like growth factor 1; IGFBP3: Insulin-like growth factor binding protein 3; vWF: von Willebrand factor.
- Citation: Zhou YY, Du X, Tang JL, Wang QP, Chen K, Shi BM. Serum von Willebrand factor for early diagnosis of lung adenocarcinoma in patients with type 2 diabetes mellitus. World J Clin Cases 2020; 8(10): 1916-1922
- URL: https://www.wjgnet.com/2307-8960/full/v8/i10/1916.htm
- DOI: https://dx.doi.org/10.12998/wjcc.v8.i10.1916


