Copyright
©The Author(s) 2020.
World J Clin Cases. May 26, 2020; 8(10): 1897-1907
Published online May 26, 2020. doi: 10.12998/wjcc.v8.i10.1897
Published online May 26, 2020. doi: 10.12998/wjcc.v8.i10.1897
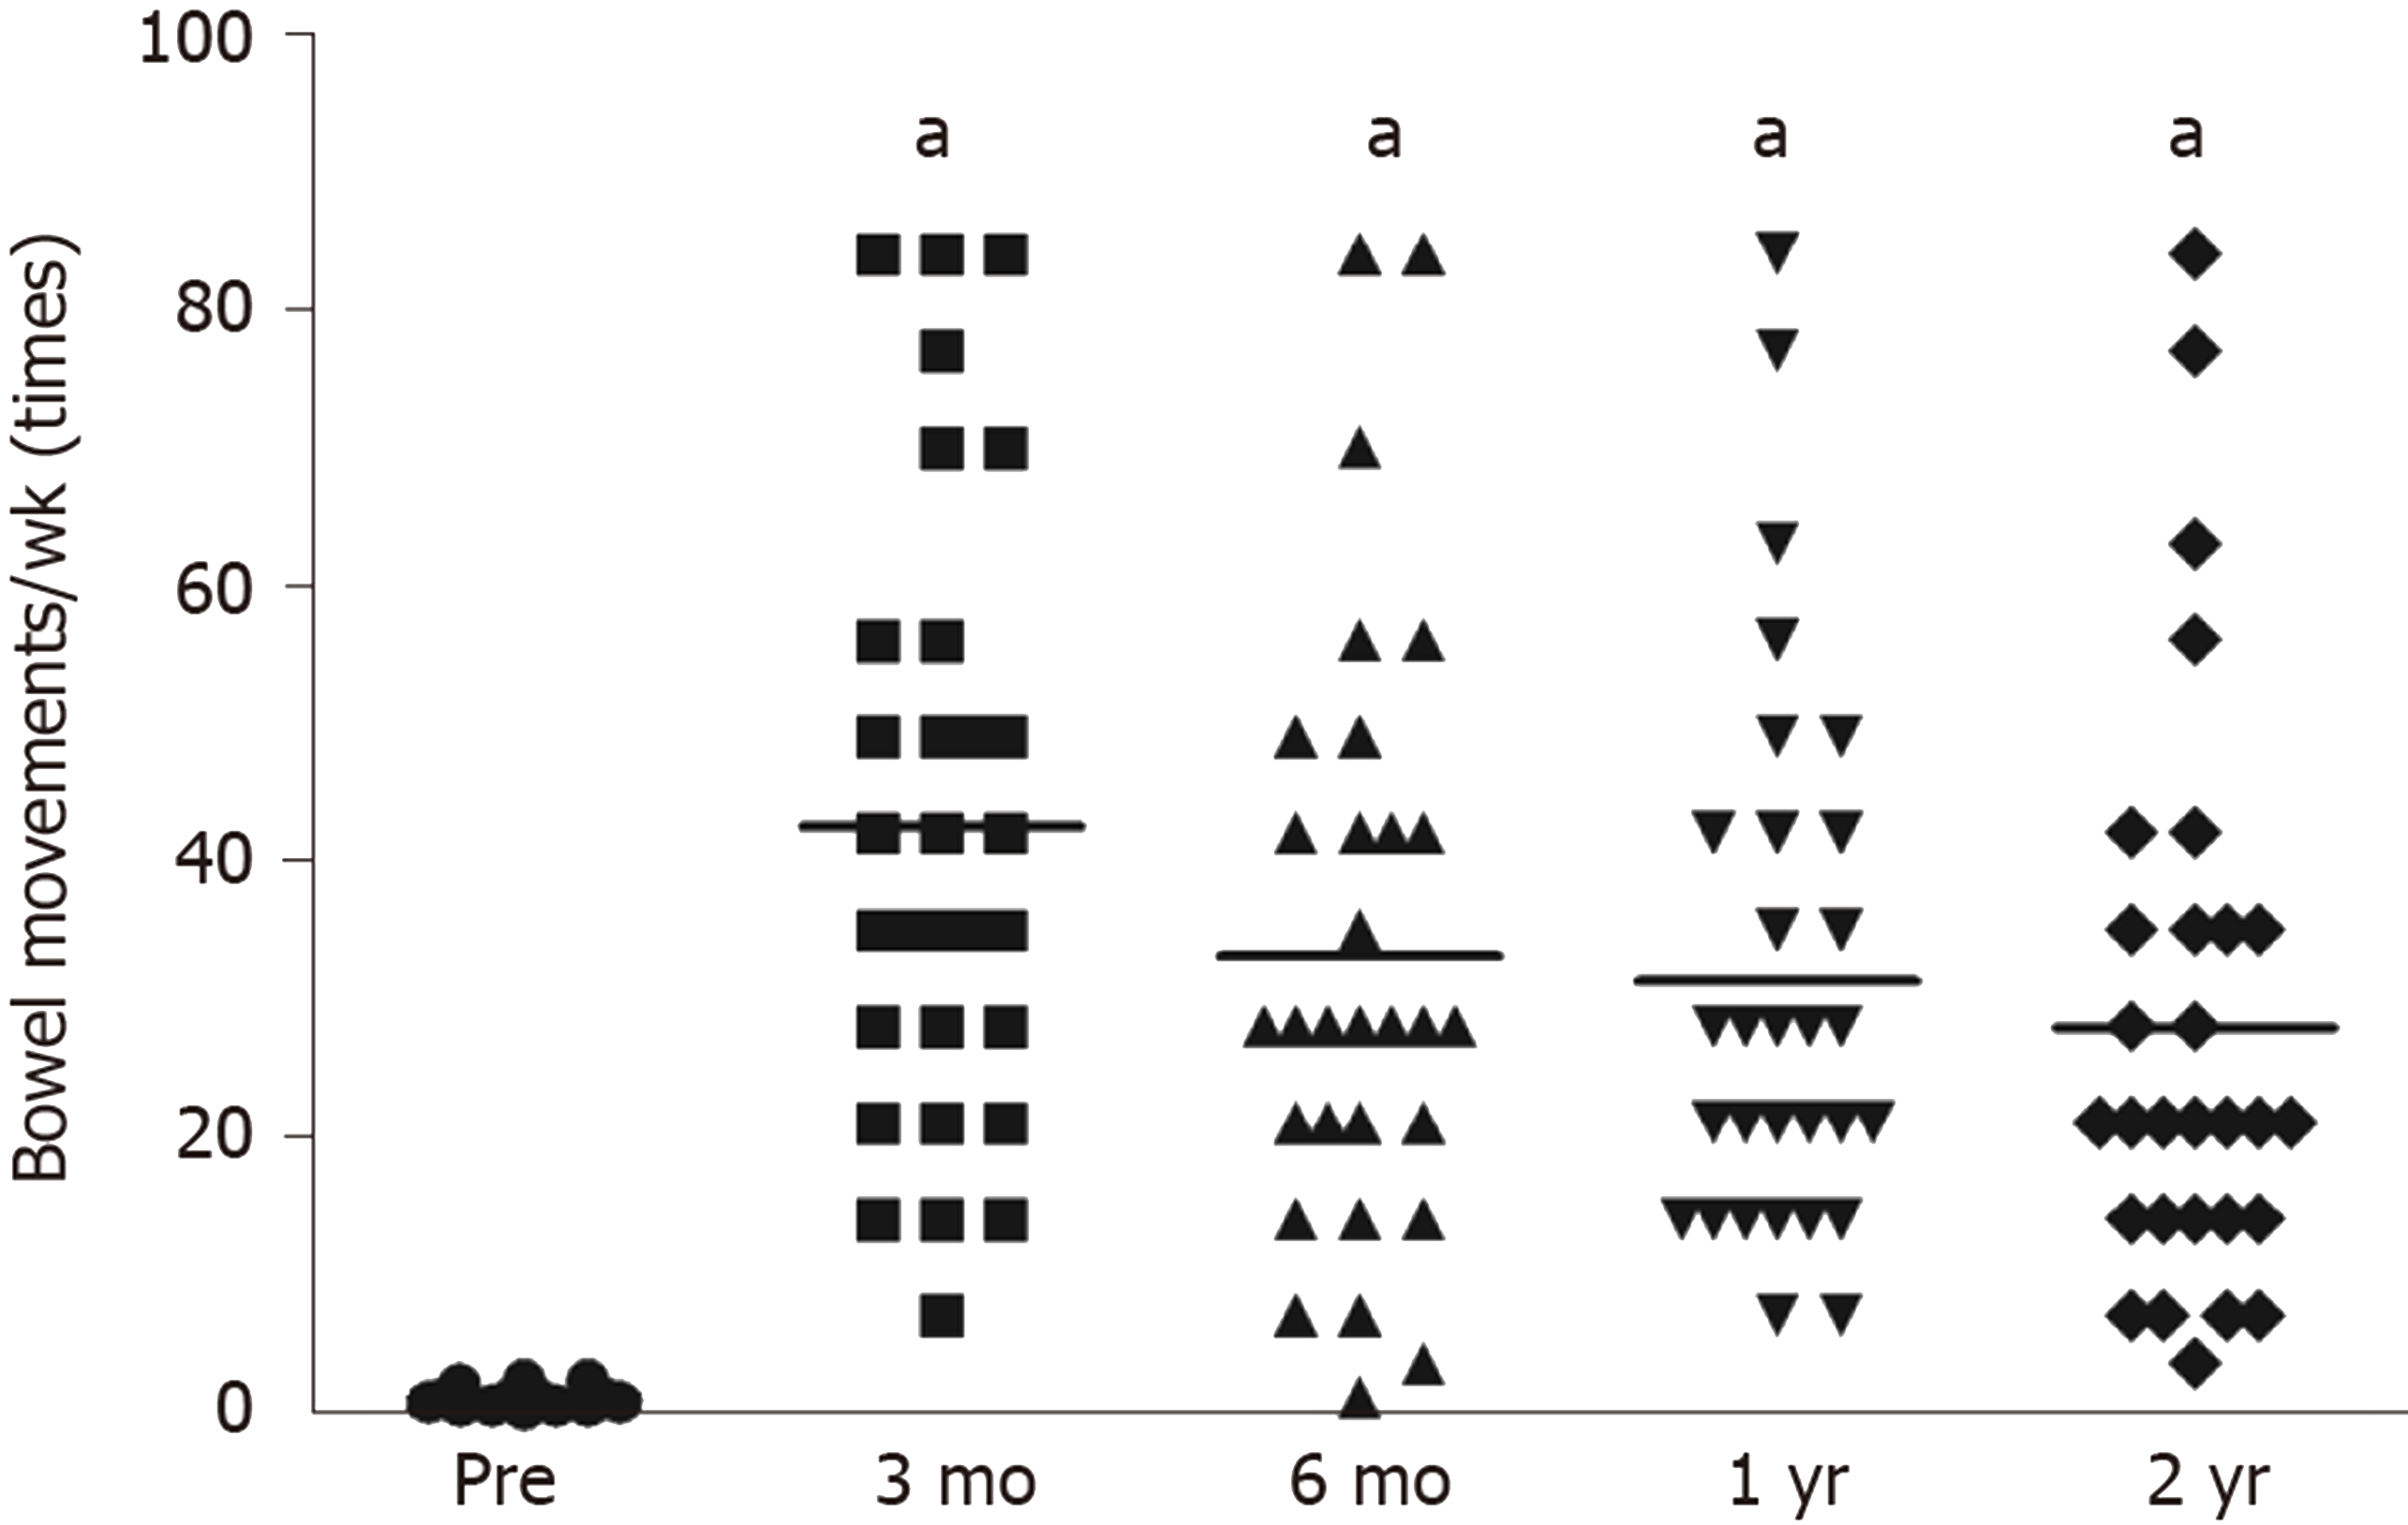
Figure 1 Number of bowel movements in patients with slow-transit constipation.
aP < 0.05 vs preoperative data.
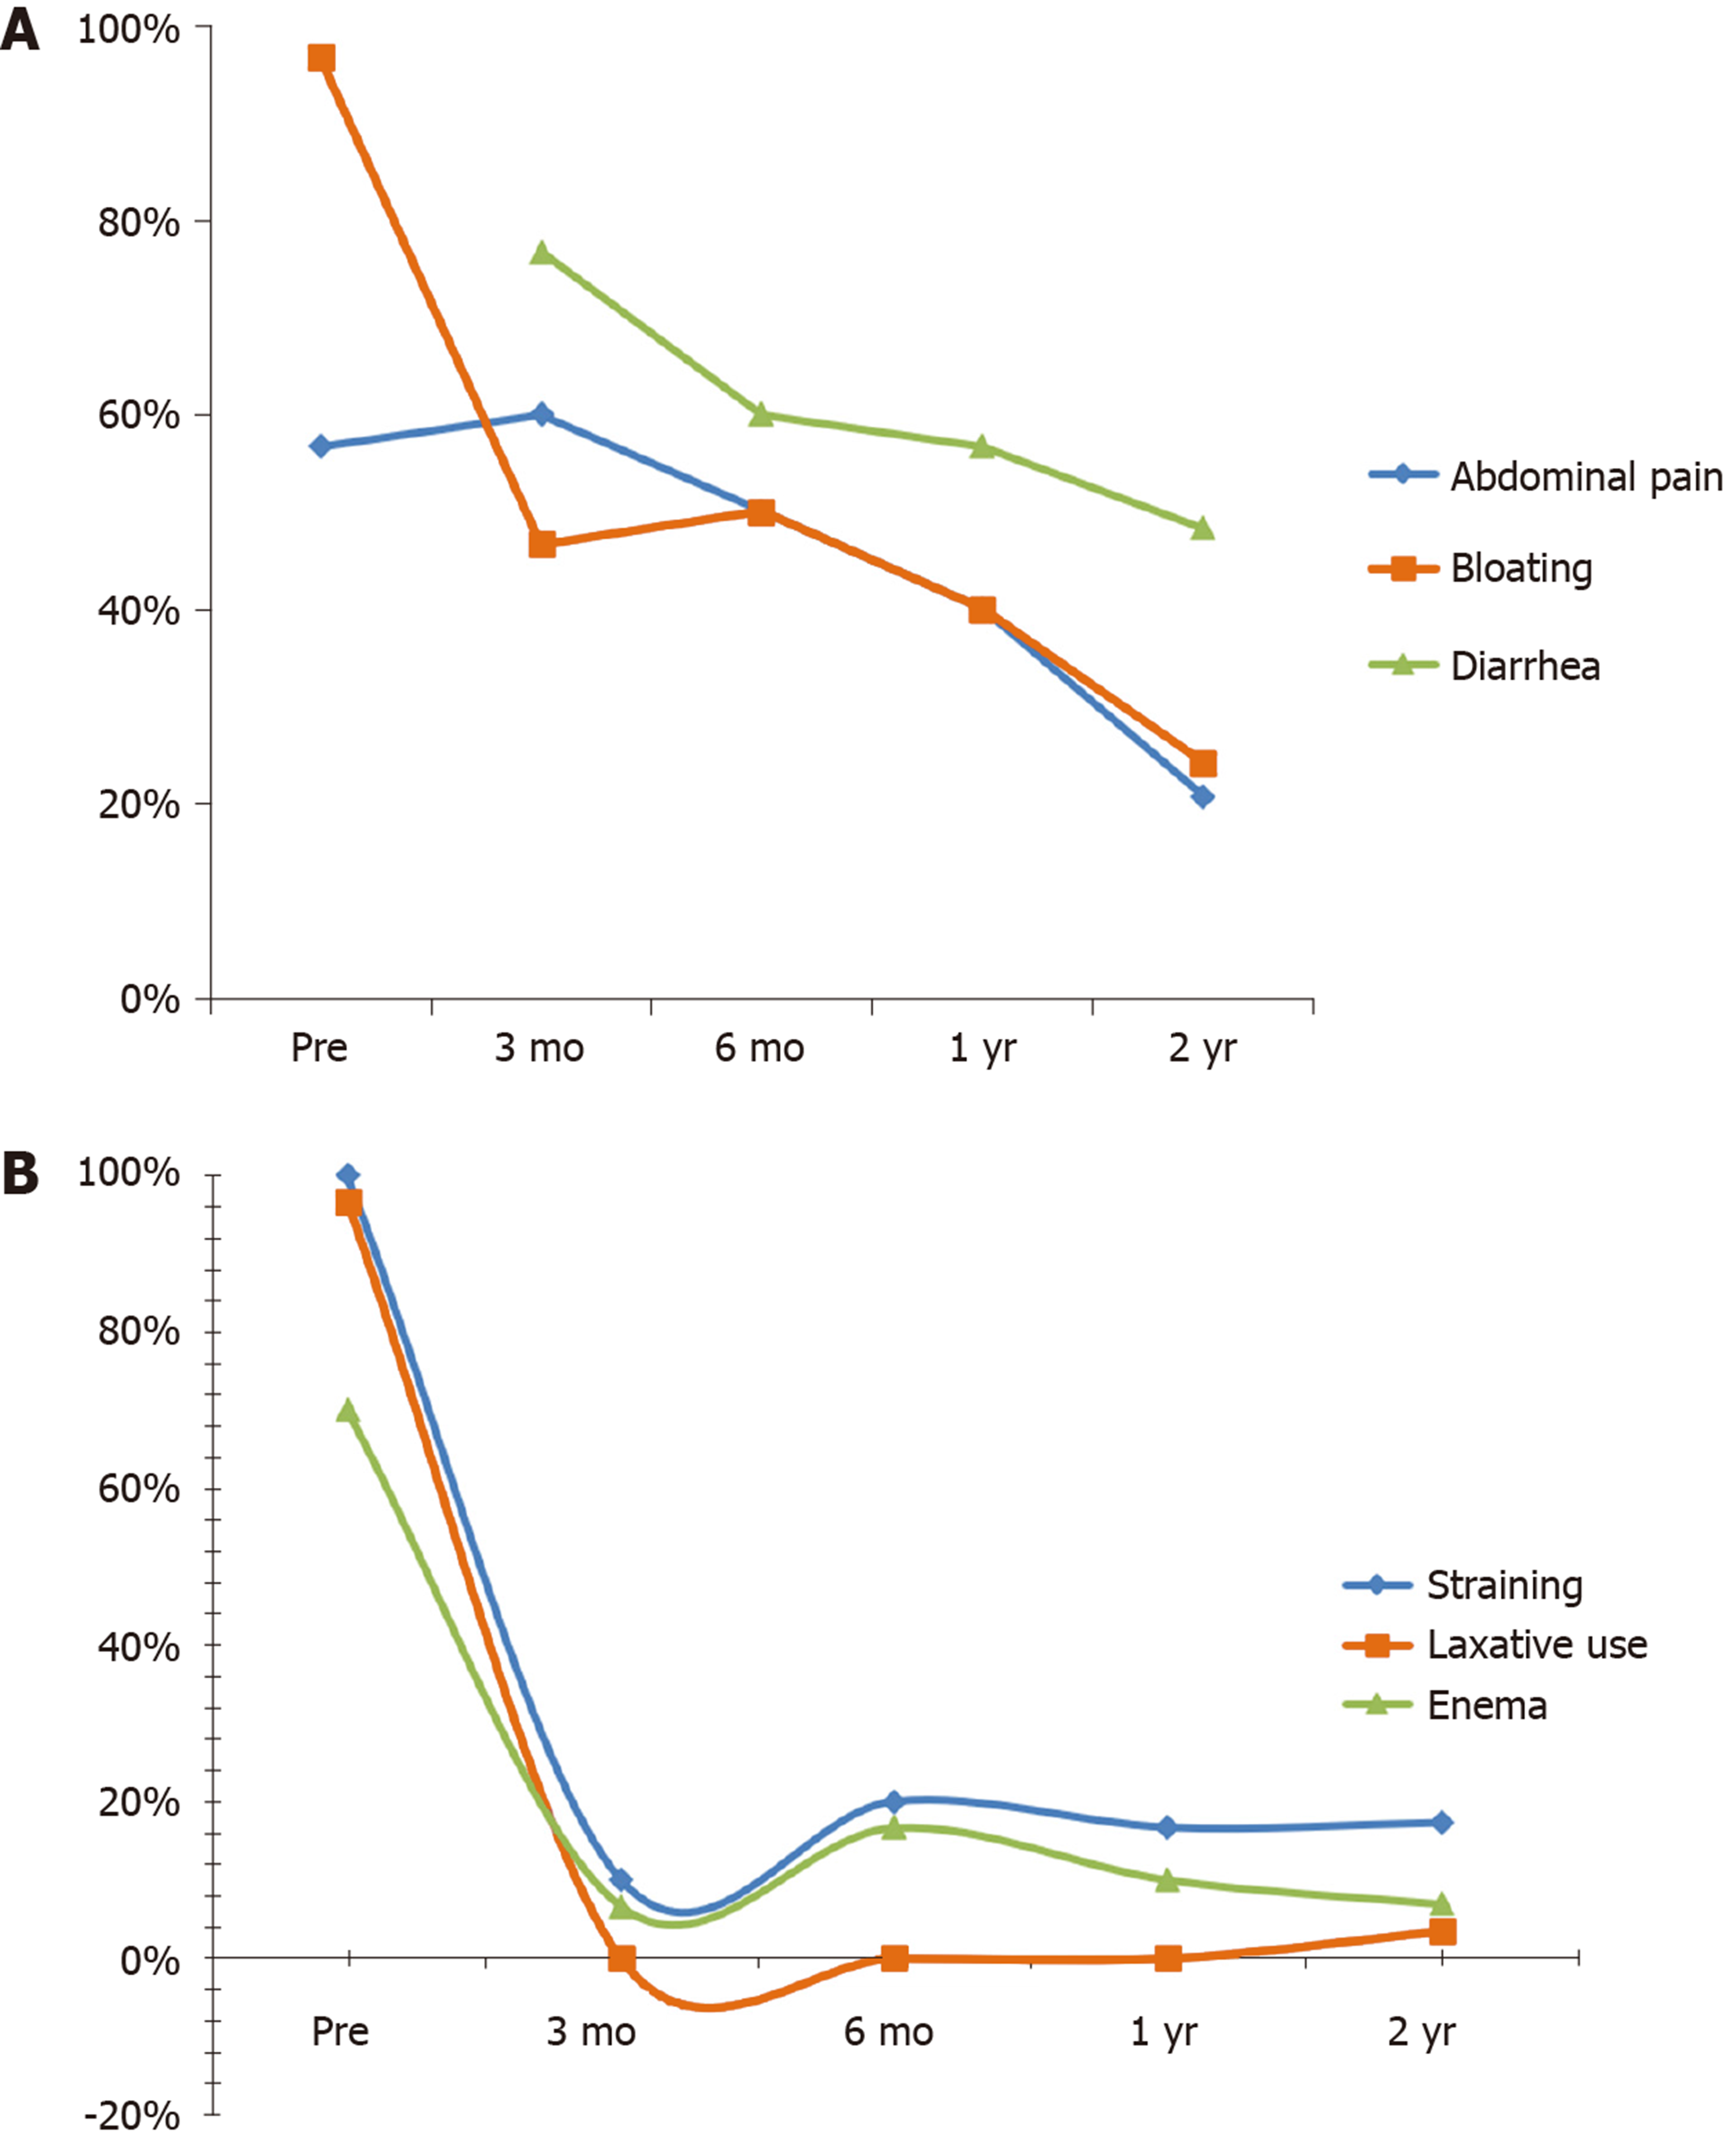
Figure 2 Incidence in patients with slow-transit constipation.
A: Abdominal pain, bloating, and diarrhea; B: Straining, laxative use, and enema.
Figure 3 Wexner constipation and incontinence scale scores in patients with slow-transit constipation.
A: Wexner constipation (WC) scales; B: Wexner incontinence (WI) scales. aP < 0.05 vs preoperative data; bP < 0.05 vs 3-mo follow-up data.
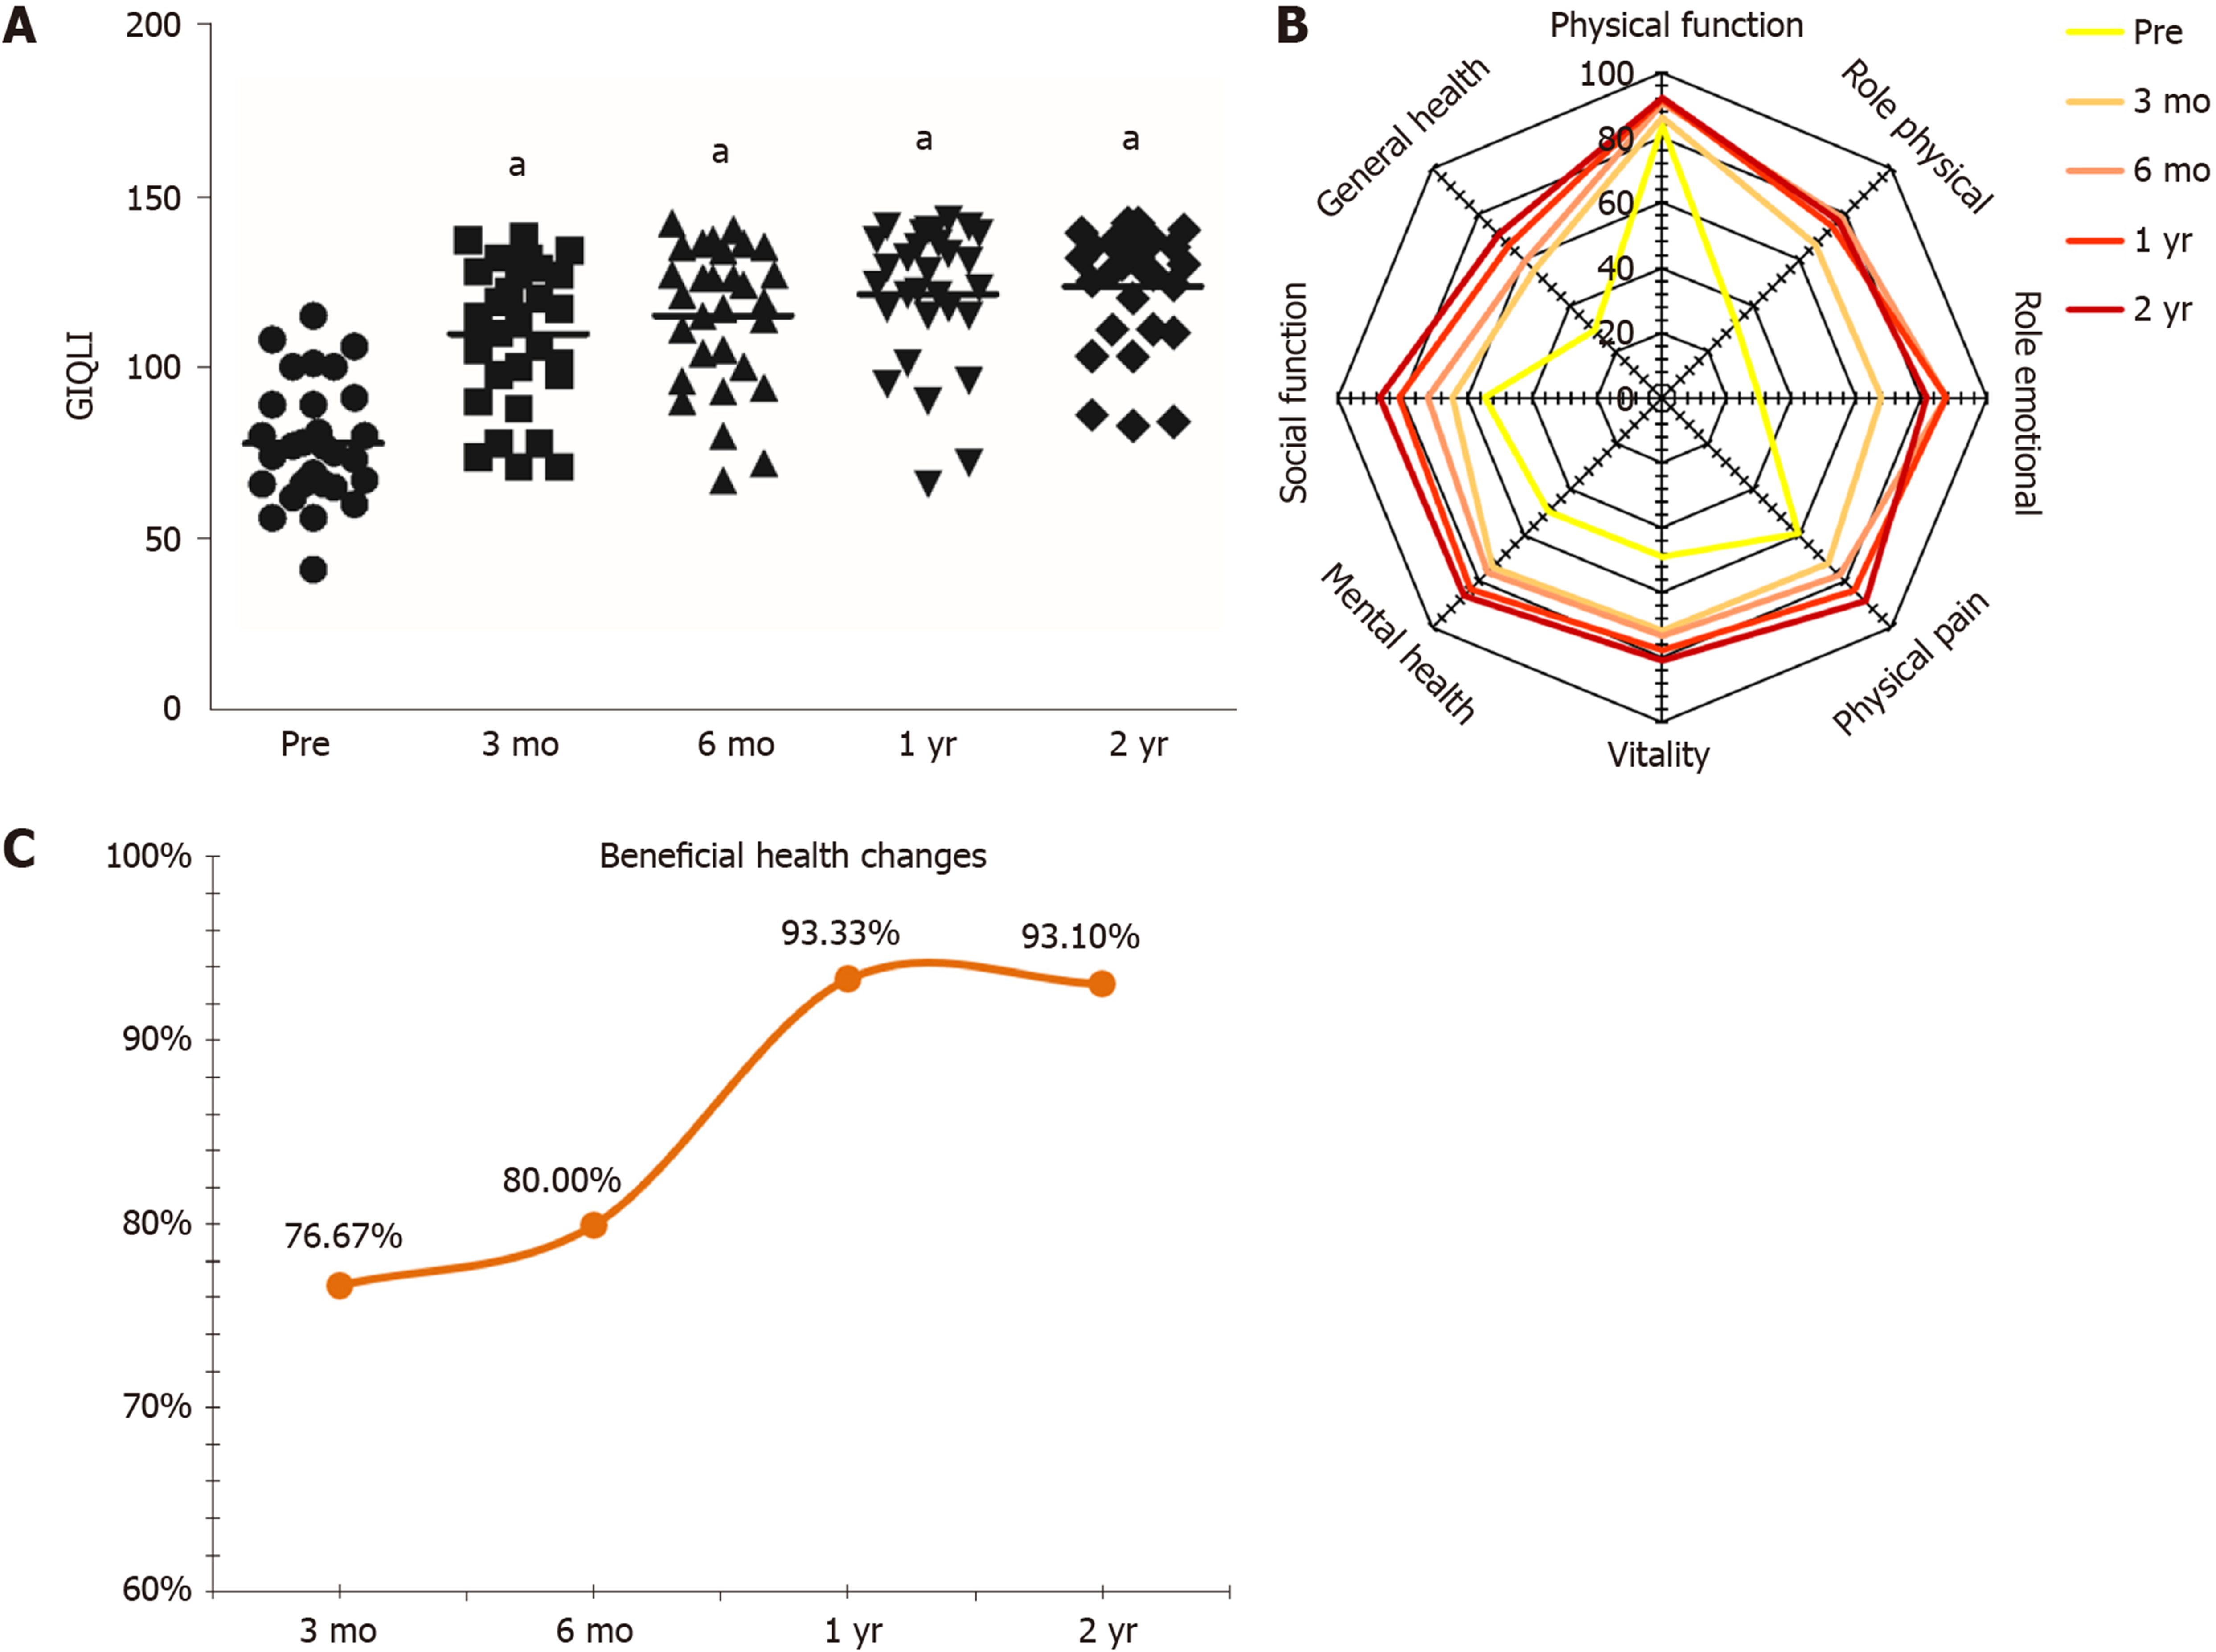
Figure 4 Quality of life in patients with slow-transit constipation.
A: Gastrointestinal quality of life index (GIQLI) scores; B: 36-item short form survey results; C: Beneficial health changes. aP < 0.05 vs preoperative data.
- Citation: Tian Y, Wang L, Ye JW, Zhang Y, Zheng HC, Shen HD, Li F, Liu BH, Tong WD. Defecation function and quality of life in patients with slow-transit constipation after colectomy. World J Clin Cases 2020; 8(10): 1897-1907
- URL: https://www.wjgnet.com/2307-8960/full/v8/i10/1897.htm
- DOI: https://dx.doi.org/10.12998/wjcc.v8.i10.1897


