Copyright
©The Author(s) 2020.
World J Clin Cases. May 26, 2020; 8(10): 1878-1886
Published online May 26, 2020. doi: 10.12998/wjcc.v8.i10.1878
Published online May 26, 2020. doi: 10.12998/wjcc.v8.i10.1878
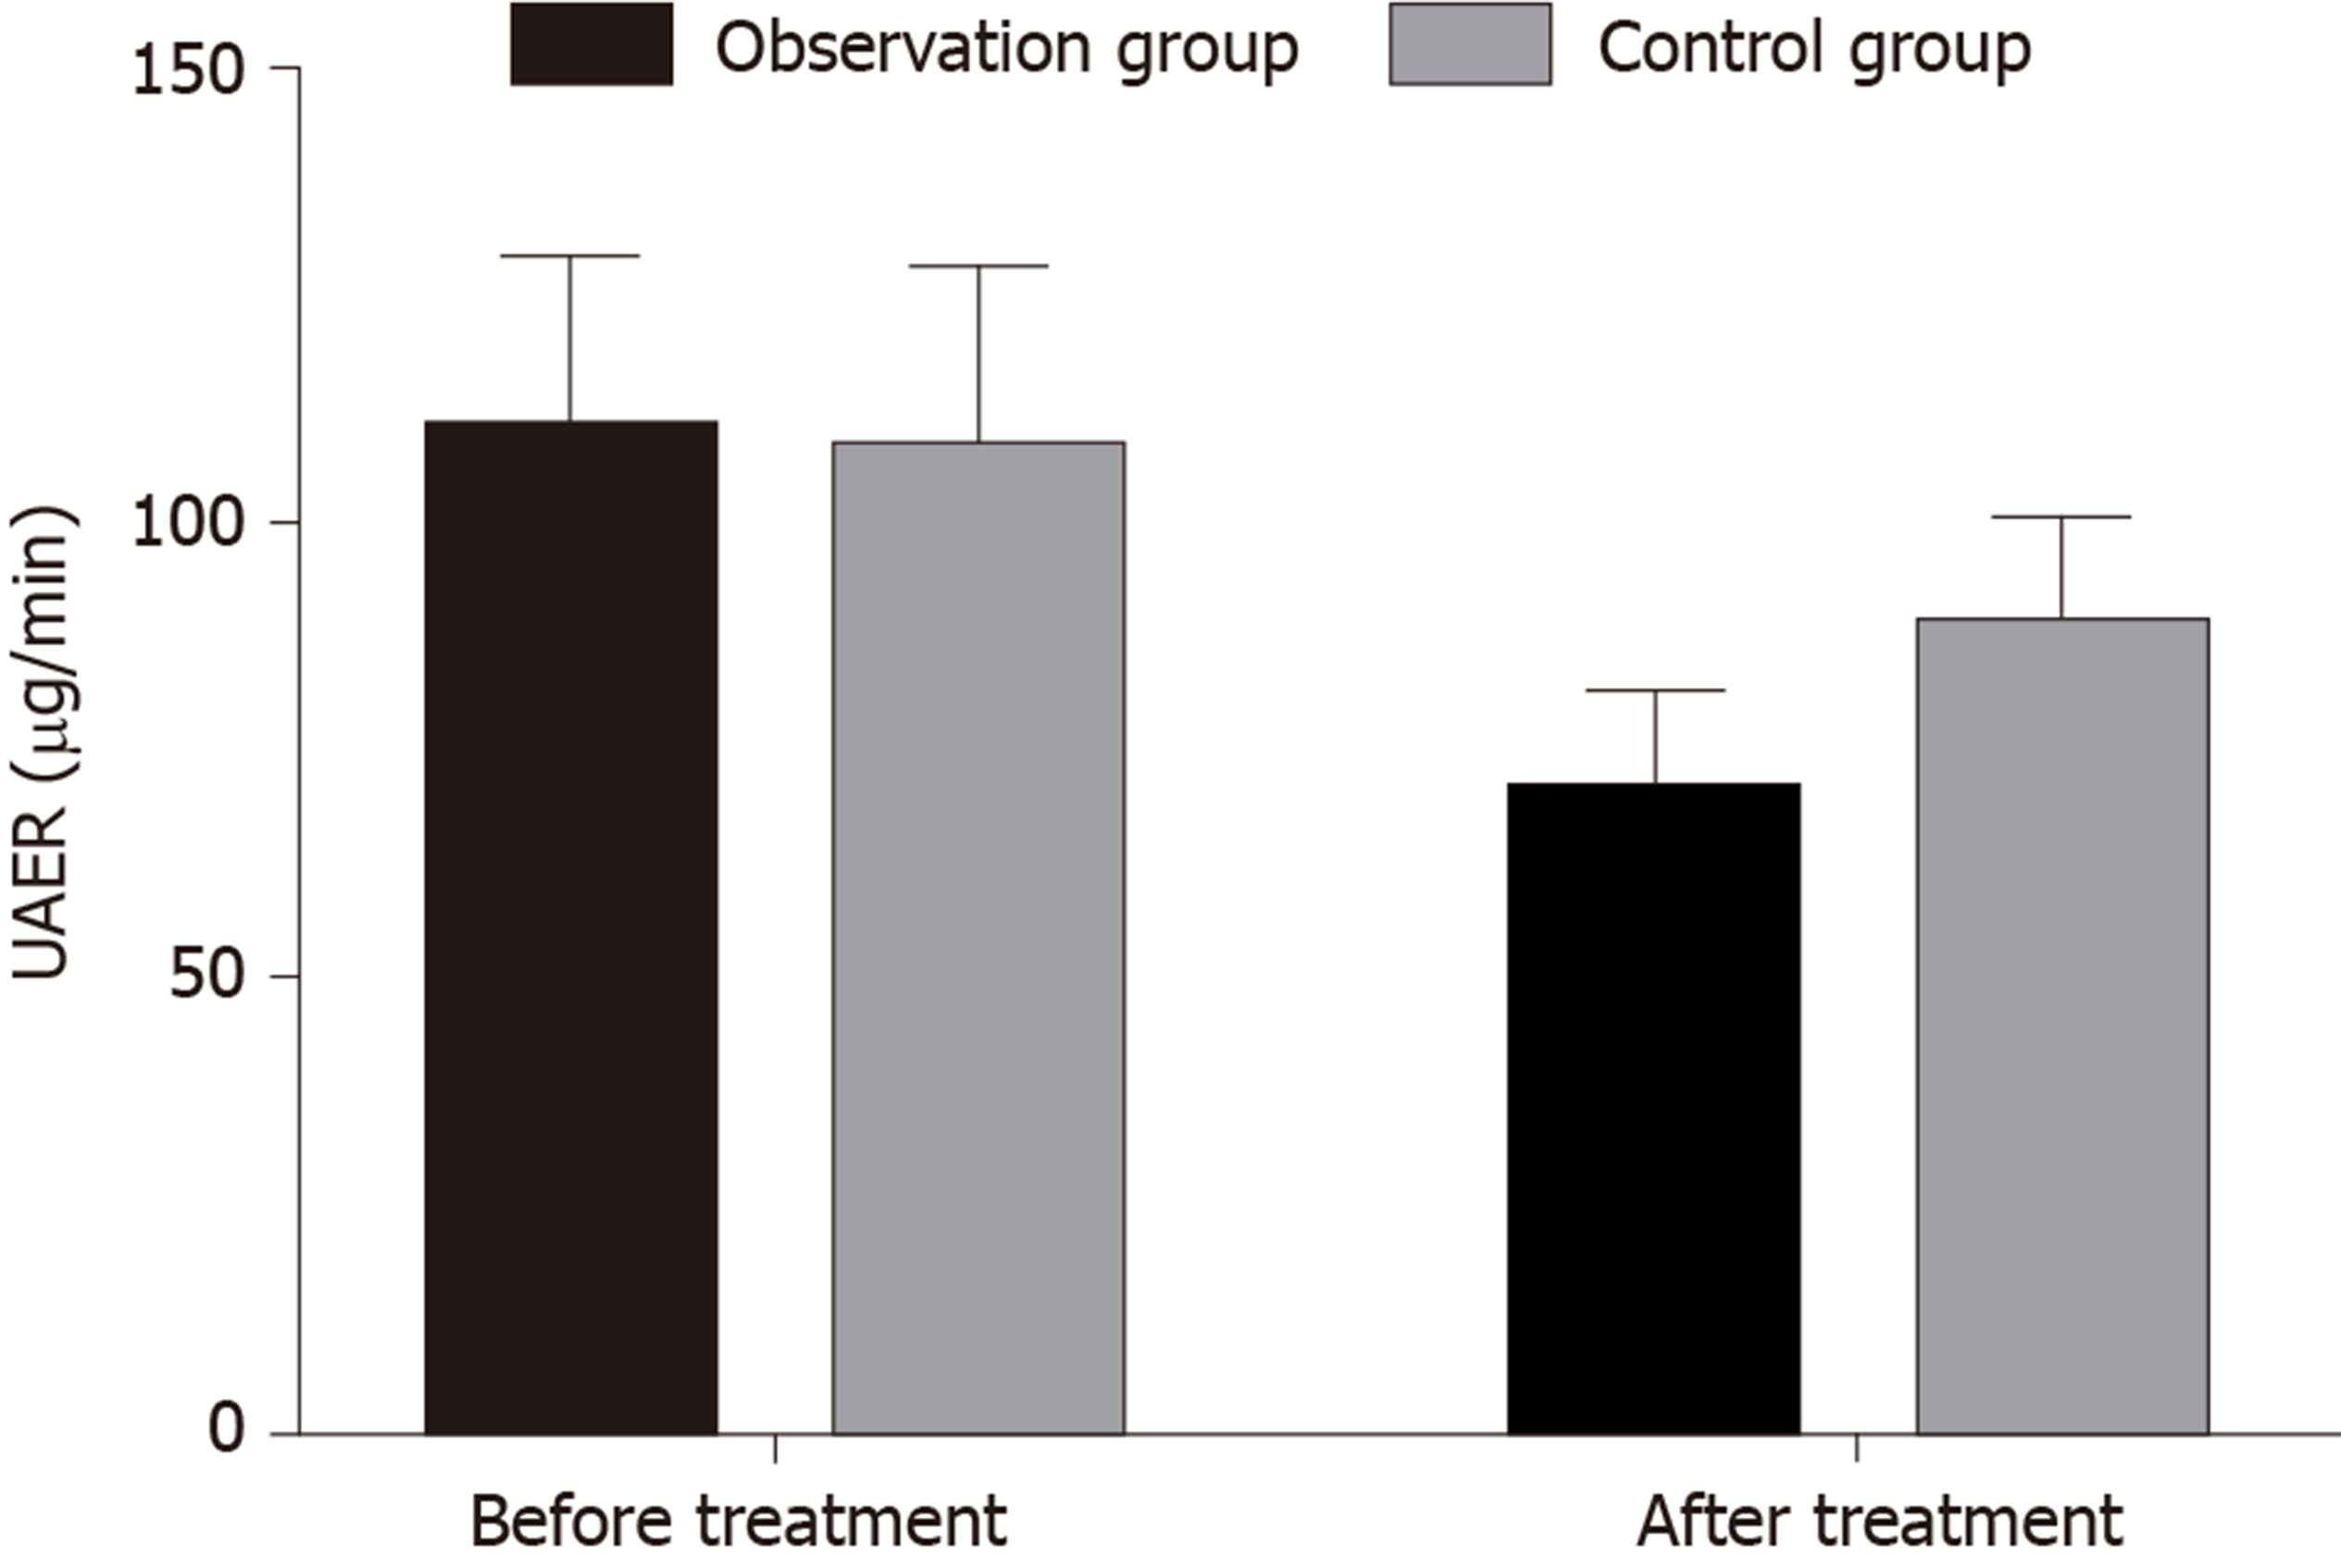
Figure 1 Histogram of urinary albumin excretion rate before and after treatment in the two groups.
UAER: Urinary albumin excretion rate.
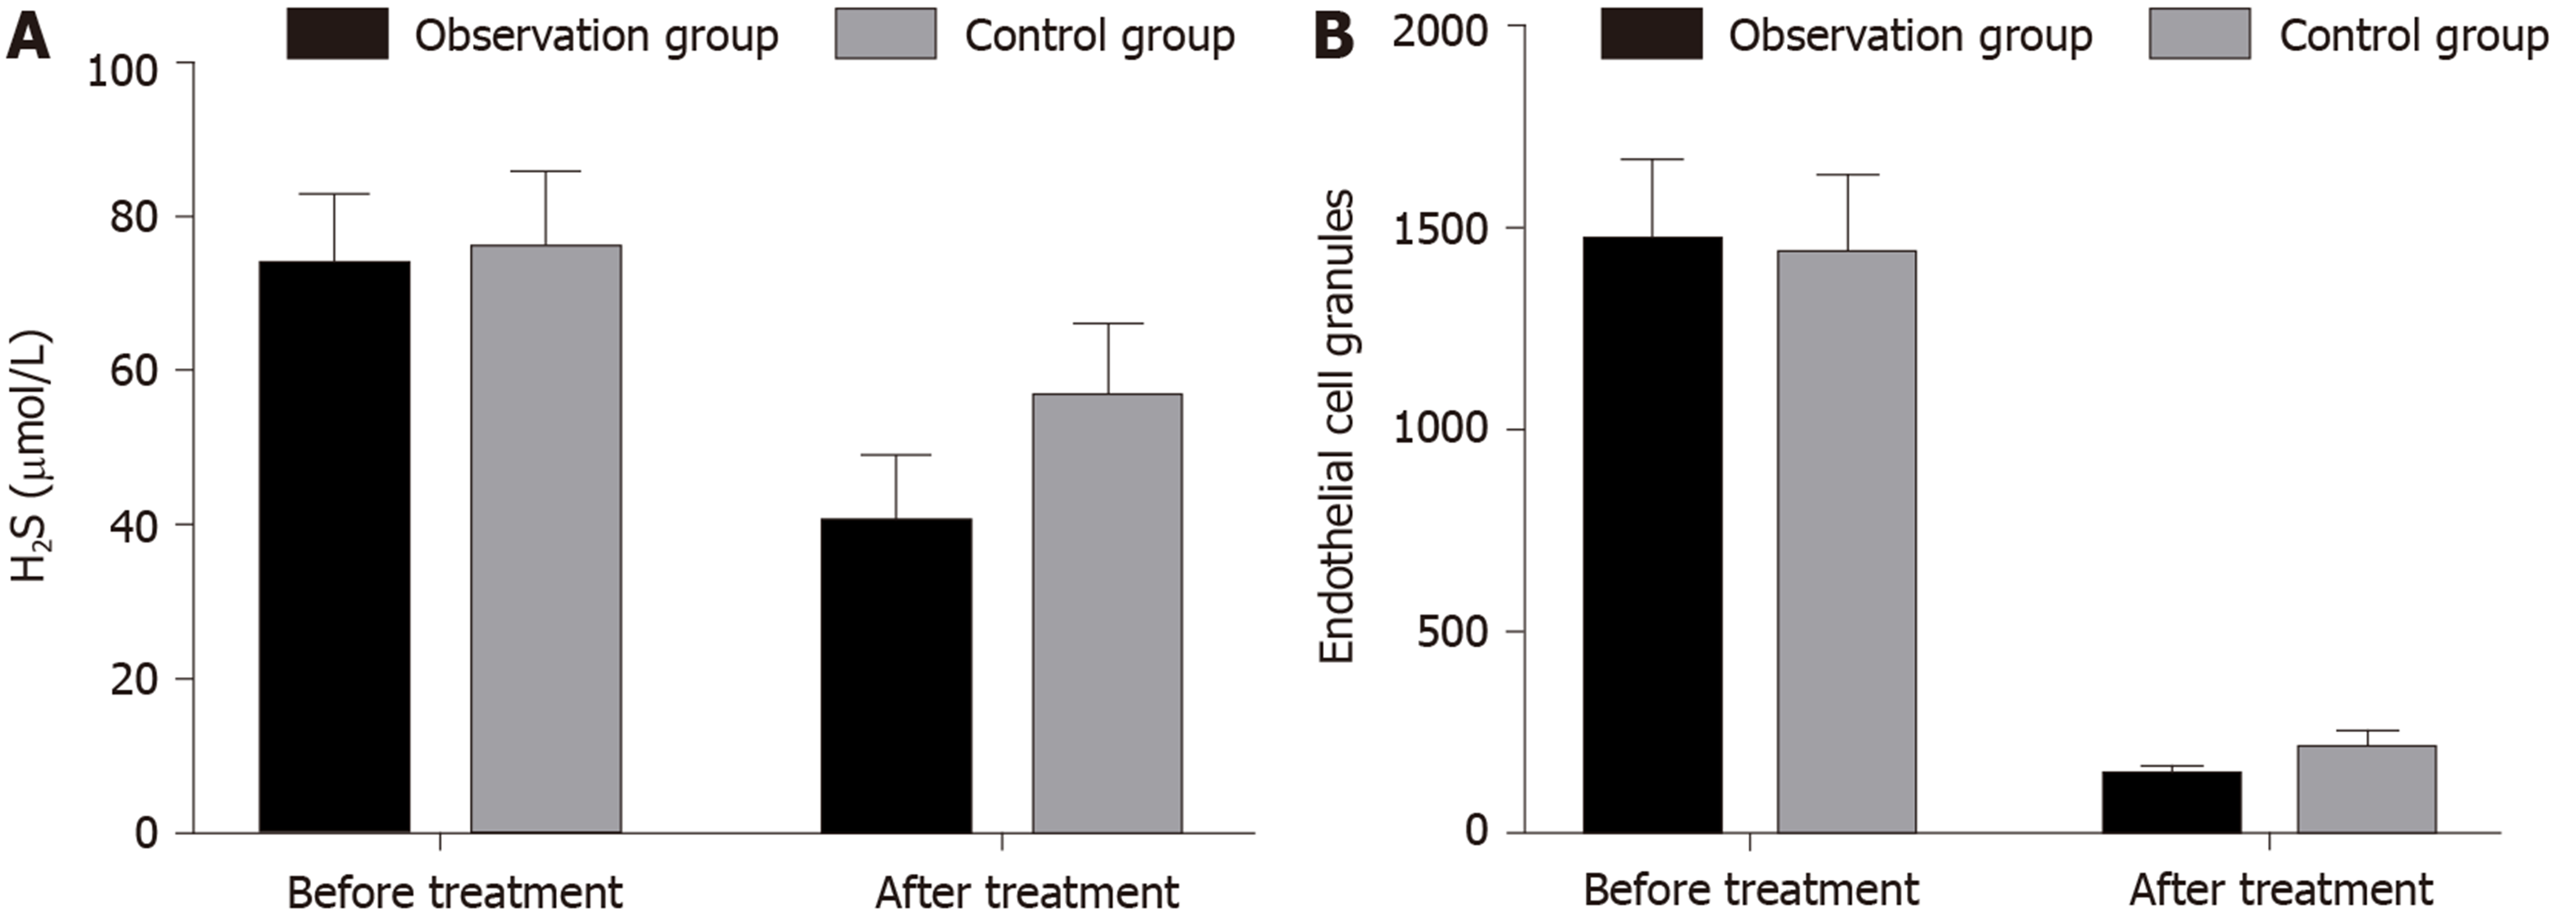
Figure 2 Histograms of endogenous hydrogen sulfide and endothelial cell microparticles in serum before and after treatment in the two groups.
A: Hydrogen sulfide; B: Endothelial cell granules. H2S: Hydrogen sulfide.
Figure 3 Histograms of endothelin-dependent diastolic function and nitric oxide before and after treatment in the two groups.
A: Endothelin-dependent diastolic function; B: Nitric oxide. FMD: Endothelin-dependent diastolic function; NO: Nitric oxide.
- Citation: Zhang J, Du YL, Zhang H, Sui H, Hou WK. Ligliptin for treatment of type 2 diabetes mellitus with early renal injury: Efficacy and impact on endogenous hydrogen sulfide and endothelial function. World J Clin Cases 2020; 8(10): 1878-1886
- URL: https://www.wjgnet.com/2307-8960/full/v8/i10/1878.htm
- DOI: https://dx.doi.org/10.12998/wjcc.v8.i10.1878


